Original publication
Original title: 生物控制论与气功
Author: Huang Bingxian (黄秉宪), compiler and author
Publication year: 1990
Original language: Chinese (Simplified)
Source file MD5:49f089c5a208920ff9e53ea48201973d

China Qigong Series, No. 4
Compiled by Huang Bingxian
Huaxia Publishing House
China Qigong Series
Biocybernetics and Qigong
Compiled by Huang Bingxian
Responsible editor: Li Min
Cover design: Bi Lei and Wang Dayou
Zhejiang Library collection mark: B766591
Classification/call numbers: R247.4; 359; B775/13
Chinese Qigong Series
Biocybernetics and Qigong
Compiled and written by Huang Bingxian
Published and distributed by Huaxia Publishing House (No. 4, Beili, Xiangheyuan, outside Dongzhimen, Beijing)
Distributed by Xinhua Bookstore Printed by Wenzi 603 Factory
850 × 1168 mm, 1/32 format; 8 printing sheets; 194 thousand Chinese characters; 2 inserted pages
First edition, Beijing, December 1990; first printing, Beijing, December 1990 Print run: 1–1,500 copies ISBN 7-80053-806-0/G·154 Price: 4.80 yuan
Editorial Committee
Chief editor: Zhang Zhenhuan
Editorial committee (arranged by the number of strokes in the surnames):
Wang Bo · Shi Ping · Bi Xiaofeng Liu Youqiao · Huang Junjie
Qigong is a precious and rich cultural heritage accumulated by the Chinese nation over the long river of its history. In order to benefit the descendants of Yan and Huang and revitalize [the] Eastern civilization, after three years of effort, the Chinese Qigong Series has finally met its readers.
At present, qigong is flourishing in our country and throughout the world. As a science of body and mind, it has immeasurable effects in many areas, including medical rehabilitation, strengthening the body and maintaining health, prolonging life, cultivating the disposition, developing intelligence, and stimulating the latent potential of the human body. In society, those who devote themselves to qigong have expanded from comrades who are elderly and physically debilitated to people from all walks of life; especially in recent years, an increasing number of experts in academic circles have devoted themselves to academic research in this field, thereby giving stronger impetus to the development of the qigong enterprise.
Qigong, as well as the human potential stimulated by it, in fact exists widely throughout human society. Blindly denying it, or adopting an excessively superstitious attitude, is unacceptable. We adhere to an objective and analytical attitude and explore and research it realistically, on the basis of facts.
Qigong is an important component of Eastern civilization. Looking at the currents of contemporary global science and culture, exchange between Eastern and Western cultures is developing daily and a trend of mutual inspiration and mutual absorption is taking shape. As a crystallization of Eastern culture, qigong occupies a very important position in this trend of mutual intermingling. For this reason, organizing and publishing, systematically and according to plan, a Chinese Qigong Series with considerable authority and wide-ranging dissemination is of important significance for inheriting and developing the precious cultural heritage of the motherland and promoting exchanges between Eastern and Western cultures.
This series mainly includes: research into qigong science; collating, proofreading, and annotating ancient qigong classics; summaries of and research into the clinical effects of qigong therapy; research into qigong history and qigong literature; excellent qigong principles and methods suitable for dissemination; and introductions to and research on qigong and parapsychology abroad, among other contents. This series adheres to the editorial policy of letting a hundred flowers bloom and a hundred schools of thought contend, and strives to eliminate prejudice, not to select on the basis of reputation, and to draw on the strengths of many sources. The series seeks, under the guidance of qigong experts and with the support of relevant academic institutions, to add a brick and a tile to the great undertaking of qigong scholarship in our country and provide theoretical reference and practical guidance for those with aspirations in the future.
The views of the individual authors in this series are not entirely identical, and do not represent the orientation of the editorial committee. Our basic requirements for each author are: thorough verification, reliable conclusions, substantive and well-reasoned discussion, an approach that goes deeply into the subject while remaining easy to understand, and language that is popular and accessible. Nothing, at its initial stage, can be perfect in every respect. Precisely for this reason, we sincerely hope that experts will criticize and instruct us regarding the shortcomings and errors in the series, so that it may gradually become more complete.
The publication of this series received vigorous support from Huaxia Press and the assistance of the Oriental Civilization Research Institute and the Peking University Qigong Research Institute. We believe that the appearance of the Chinese Qigong Series will not only be welcomed by the many enthusiasts of qigong, but will also lead to the production of more and better works. It will contribute to research and development in numerous disciplines, including Chinese medicine and modern medicine, psychology, physics, biology, philosophy, and anthropology.
Editorial Committee of the Chinese Qigong Series
June 1988
Preface
Qigong is a precious cultural wealth of our country. Clarifying the principles of qigong is an important task for our scientific workers. Qigong has extremely rich content; research into its principles is currently still at an initial exploratory stage. Clarifying the principles of qigong requires multidisciplinary cooperation and joint effort. Qigong is a complex regulatory and control process of the human body, while biocybernetics is the science that studies the laws governing regulation, control, and information-processing processes in biological systems. Therefore, the concepts and methods of cybernetics, as well as the results of biocybernetics research, will all play an important role in exploring the principles of qigong. This book discusses the basic concepts and methods of cybernetics, the application of biocybernetics in research on the human body’s regulatory and control systems, and the role of cybernetics in research into the principles of qigong, among other subjects. The book’s exploration of qigong principles is only preliminary, but we believe that cybernetics will be one of the indispensable methods for exploring the principles of qigong.
This book is divided into ten chapters. In addition to introducing the general principles of cybernetics, it also discusses in detail cybernetics’ research on the human body’s main regulatory and control systems, including the nervous system, respiratory system, circulatory system, body temperature regulation system, endocrine system, and immune system. These systems have a close relationship with the qigong regulation process; the book also discusses Readers unfamiliar with these mathematical formulas may skip them and still grasp the main content of the book. In order to use cybernetics to explore the principles of qigong, this book discusses at greater length the application of cybernetics in biomedicine. It is also a valuable reference book for readers and students who are interested in biocybernetics and its applications.
Table of Contents
-
The basic functional systems of the brain (14)
-
The structure of the central nervous system and its information-processing functions (18)
-
The processing of sensory information (31)
-
Information and Information Content (39)
-
Transfer functions and frequency characteristics (44)
-
State equations and modern control theory (95)
-
Computer modeling (simulation) (100)
-
System identification (106)
-
Optimal control (110)
-
Adaptive control (116)
-
Control theory and catastrophe theory, dissipative-structure theory, and synergetics (121)
Chapter Four The Respiratory System and Qigong (121)
-
A chemical-receptor feedback-control model of ventilation (124)
-
Simulation research on ventilation control (127)
-
Adaptive control of the respiratory system (131)
-
Changes in the respiratory system in the qigong state (134)
Chapter Five Circulatory System and Qigong
- The main functions of the circulatory system (139)
- Regulation and Control of the Cardiovascular System (144)
- Modeling and simulation of regulation of the cardiovascular system (149)
- A model of the baroreceptor feedback system (154)
- Research on the effect of acupuncture on the blood-pressure regulation system (155)
- A model and simulation of the entire circulatory system (157)
- The effects of qigong on the circulatory system (161)
Chapter Six Thermoregulation and Qigong (163)
- Regulation of body temperature (168)
- A mathematical model of human thermoregulation (168)
- Changes in the thermoregulatory system in the qigong state (175)
Chapter Seven Regulation of the Immune System and Qigong (178)
- The structure and functions of the immune system (181)
- Regulatory control of the immune system (185)
- Mathematical models of immune regulation (190)
- The antibody regulation process (190)
- A model of the clinical course of hepatitis B (194)
- The effects of qigong on immune regulation (198)
Chapter Eight The Endocrine System and Qigong (201)
- The functions of the endocrine system and the mechanism of hormone action (201)
- Regulatory control of the endocrine system (206)
- Mathematical models of the endocrine system (210)
- A model of the blood-glucose regulation system (210)
- A dynamic model of thyroxine (216)
- A feedback-control model of ovarian activity (218)
- The effects of qigong on the endocrine system (221)
Chapter Nine Biofeedback (223)
- The principles of biofeedback (223)
- Biofeedback devices (225)
- Detection of biological signals (225)
- Biological-signal processing (226)
- Feedback-signal output (227)
- Clinical applications of biofeedback (229)
- Similarities and differences between qigong and biofeedback (232)
Chapter Ten Cybernetics Is an Important Method for Studying Qigong (235)
- Qigong phenomena take many varied forms (235)
- Qigong is a complex process of human regulation and control (237)
- The nervous system is the key to the effects of qigong (239)
- Cybernetics is a useful tool for qigong research (242)
Principal references (246)
Chapter One Biocybernetics and Qigong
We can often see that some elderly people who have practiced qigong for many years possess vitality and strength far beyond those of ordinary people. Some people who have been clinically pronounced to have “incurable diseases” have obtained unexpected therapeutic results through qigong training. These phenomena suggest that qigong can, through conscious self-control, place the human body in a state different from its ordinary condition. This new state is beneficial to the organism’s activity and the treatment of disease. How can this beneficial state be achieved? What actual contents does this beneficial state include? These are questions that concern people. Because modern science has an extremely insufficient understanding of the human body, this exceedingly complex system, it still cannot answer these questions well. From the viewpoint of cybernetics, this book attempts to use knowledge from modern physiology, biochemistry, psychology, and systems science to explore the possibility of achieving this beneficial state, in the hope of contributing to the understanding and deeper study of qigong.
- The Qigong State
Qigong is a precious cultural heritage of our country with a long history. As early as two or three thousand years ago, writings concerning qigong already existed. For a long time, our ancestors used qigong to strengthen the body, prevent disease, and treat disease. The qigong of our country has a long and far-reaching history; there are many schools and methods of practice. Its concrete forms of expression differ in countless ways, but they also share common features. As the British historian of science Dr. Joseph Needham believed, qigong is a kind of physiological alchemy: it attempts to use the various body fluids and organs that the human body already possesses, as well as things produced by the body, to refine an elixir of immortality. Although this statement is not comprehensive, it nevertheless largely captures the principal common features of qigong.
From the viewpoint of cybernetics or systems science, qigong may be summarized as follows: through self-awareness and training, it fully mobilizes the positive factors within the organism, draws out the organism’s inherent potential, and places the organism in a state favorable to its own survival and development, or
Second, the organism is in some kind of optimal state. Thereby, the organism’s ability to adapt to the external environment is enhanced, and its ability to prevent and treat disease is improved, bringing into play the human body’s capacity to understand and transform the world.
Different qigong methods and forms of training reach different depths; the degree and particular emphasis of the beneficial state they produce also differ. We collectively call the optimal state in some particular aspect and under some particular circumstances that is produced by practice a qigong state. Therefore, the purpose of qigong training is to bring about a qigong state within the organism. The various effective qigong methods are summaries of the experience of bringing the organism under self-control to change toward a qigong state. Qigong therapy, moreover, is a component of traditional Chinese medicine, and it is consistent with the theories of traditional Chinese medicine. Both regard the human body as an internally interconnected whole—that is, as a system. Qigong therapy emphasizes self-regulation: through self-control, it causes the organism to change toward a state favorable to the prevention and treatment of disease, that is, to form a qigong state, thereby achieving the purpose of preventing and treating disease.
The concrete manifestations of the qigong state—that is, what specific changes practice can bring about in the organism—are not yet very clear. Clearly, these changes are multifaceted, because the human body is an interconnected whole and the various parts of the organism strongly influence one another. We have observed changes in many physiological systems during practice. These changes still await further observation and accumulation, followed by systematic induction and summarization that separates the true from the false. On the basis of these objective facts, it should be possible to establish a model that reflects this process. These questions will be discussed further in the chapters below.
Here it may be pointed out that the human system developed through hundreds of millions of years of evolution has already prepared the necessary conditions for the organism to carry out self-control. Beginning with the vertebrates, the nervous systems of living organisms had already developed to a high degree; human beings possess a relatively well-developed capacity for self-awareness, and the nervous system has become the control center of the entire organism. All the principal activities of the organism are governed by the nervous system. Consciousness occurs in the higher regions of the nervous system. Generally speaking, the higher regions of the nervous system possess a certain capacity to govern the functions of the next lower level. Therefore, through appropriate pathways, consciousness may govern the activities of the entire body. Thus, the conditions for changing the state of the organism through conscious self-control already exist. The question is how to open up and find these appropriate pathways, so that the organism changes toward a qigong state.
Unlike lower animals, the principal abilities by which human beings survive and develop do not depend on innate instinct; most are acquired through later learning and training. Through training, people can become outstanding soccer players, and they can also become gymnastics stars.
A person can become an outstanding artist, while another can become a creative scientist. People with these special abilities that ordinary people do not possess have acquired them through later effort; they constantly regulate themselves so as to remain in a state suited to the exercise of their particular expertise. The enormous plasticity of human functions suggests that the great majority of people can, through qigong training, place themselves in a qigong state.
For a long time, qigong has played a positive role in the practice of disease prevention and treatment among the people of our country. However, our understanding of qigong has remained weighted toward experience, and a complete theoretical system has not yet been formed. Therefore, it is the task of China’s scientific and technological workers to use modern science and technology to study qigong, establish it on a scientific foundation, and thereby enhance its role in medical treatment and other areas.
II. Characteristics of Biocybernetics and Its Applications in Biomedicine
Biocybernetics is the science that studies the laws governing regulation, control, and information processing in biological systems. The qigong state is achieved by the human organism under the control of consciousness; it is a complex process of regulating the human body. It is therefore also a subject of biocybernetic research.
Biocybernetics is the application of cybernetics, or systems science, to biology. It regards the organism as a whole, or as a system composed of many components. In this respect it accords with the theories of traditional Chinese medicine. As a modern science, biocybernetics emphasizes studying the organism from systemic, dynamic, and quantitative viewpoints. It studies not only the interactions among the components and their effects on the whole system, but also the dynamic processes caused by those interactions, and it obtains quantitative results concerning the issues described above. This is important for the deeper study of biological systems, and it is likewise important for the study of the qigong process.
In the 1940s, the development of automatic-control technology, communications technology, neurophysiology, and physiology led to the birth of an interdisciplinary field spanning many disciplines—cybernetics. Cybernetics is the science of control and information processing in machines and animals. During the establishment of cybernetics, the collaboration between the mathematician Norbert Wiener, who had participated in research on automatic-control systems for antiaircraft guns, and the physiologist Arturo Rosenblueth played an important role. The laws of regulation and control in biological organisms were important subjects of cybernetic research from the beginning. The establishment of cybernetics connected control engineering with biomedicine, allowing knowledge from the two fields to be used mutually.
The machines and animals studied by cybernetics can both be regarded as systems; these are also the systems that have received the greatest attention. Cybernetics overlaps to a considerable extent with systems science, the science that studies general systems laws. Many of the concepts, principles, and methods that can be applied to qigong research are consistent in these two disciplines. Therefore, this book treats cybernetics and systems science, without distinction, as a unified discipline.
Biocybernetics is an important branch of cybernetics. Norbert Wiener, the founder of cybernetics, played an important role in the development of biocybernetics. In his classic 1948 work Cybernetics, he discussed the stability of the internal environment of the human body and proposed cybernetic questions concerning neuropathology and organ compensation, among other topics. These questions remain important subjects of biocybernetic research to this day. From the end of the 1950s to the beginning of the 1960s, the application of cybernetics to problems in physiology and pathology made rapid progress, and several relevant monographs were published. Research into information processing in the nervous system became the mainstream of bionics research at that time. In the mid-1960s, Wiener and Schade co-edited Advances in Biocybernetics, in three volumes, collecting examples of the application of cybernetics in different branches of biomedicine. This thereby established biocybernetics as an independent branch of cybernetics.
Cybernetics studies systems in depth from holistic, dynamic, and quantitative viewpoints. It grasps the object under study through its interconnections and mutual constraints. In order to reveal the essence of things and grasp their common laws, cybernetics often overlooks differences in the material structures of a system and its components, focusing mainly on the functional relationships among them. At the same time, cybernetics disregards the magnitude of energy and emphasizes the role of information in interconnections.
Biological systems have two notable characteristics. First, their principal components are structurally complex macromolecules—proteins and nucleic acids. Second, they are highly organized: at different structural levels, their various parts are closely connected to form a whole. The disintegration of the connections among the parts immediately leads to the death of the organism. Moreover, every normal function of an organism depends on correct connections among its parts. The organism is the most complex form of matter known to date. Its material structure, energy conversion, and interconnections all possess highly advanced forms.
Therefore, information as an advanced form of the interconnection of matter is even more important in organisms. If molecular biology can promote the development of biomedicine in the area of material structure—starting from the characteristics of biological macromolecules and proceeding from an analytical viewpoint—then biocybernetics will promote the progress of biomedicine in the area of interconnections, from holistic, dynamic, and quantitative viewpoints.
In quantitative research, the biological sciences have already made important progress. Marx once pointed out that a science is truly developed only when mathematics has been successfully applied within it. The application of mathematics has promoted the development of biology. In Marx’s time, the application of mathematics in biology was still virtually zero, a point Engels clearly made in Dialectics of Nature.
The situation has now changed. The biological sciences have become an important field for the application of mathematics. The mathematical branch that was first successfully applied to biomedicine is biomedical statistical methodology. It plays an important role in basic, clinical, and preventive medicine—in investigation and research, experimental design and results processing, efficacy analysis, and other work. In recent years, multivariate methods, such as multiple regression, discriminant analysis, and cluster analysis, as well as other statistical methods, have been widely applied in many areas of biomedicine.
However, statistical methods are mainly suited to studying the laws of large numbers of events or group activities. They are very effective for eliminating random factors and determining certain laws that are masked by individual differences. But when we want to understand things further, study individual differences (for example, treating people according to their individual circumstances and prescribing medication according to the symptoms), reveal the interconnections among the parts of a system, and seek the mechanisms and dynamic processes governing the development of things, statistical methods are not very suitable. Although statistical methods can also study relationships from the standpoint of correlation, correlated events do not necessarily have a causal relationship. When there are not many observational data, conclusions drawn from correlations may be wrong. In these areas, cybernetics can play its role.
Cybernetics commonly uses mathematical models to describe systems. A mathematical model generally reflects the causal relationships between a system and the interactions among its internal components. By establishing a mathematical model, performing system identification on the model, and then further analyzing the model or studying it through computer simulation, many mathematical techniques are introduced into biomedicine. In this way, many problems encountered in the development of biomedicine can be addressed more deeply and quantitatively.
In the field of basic medical research, and in research on physiological, pathological, and pharmacological mechanisms, cybernetics shows broad prospects for application. This is because various regulatory and control processes exist within the biological organism, thereby maintaining the body’s normal vital activities. For example, the body’s internal environment—including body temperature, blood pressure, respiratory frequency and ventilation volume, and the concentrations of various electrolytes, hormones, and other constituents in the blood—is maintained in relative stability by feedback control. The nervous and motor systems, meanwhile, ensure the precision of activity through feedback. The various biologically active substances within cells likewise remain approximately constant because of feedback inhibition by the end products. Therefore, feedback is an important means by which organisms regulate and control themselves.
Biocybernetics has applied methods developed in engineering and technology. Studying various biological feedback systems has deepened understanding of the physiological and pathological mechanisms of the human body. For example, last century it was discovered that patients with brain tumors could develop systemic blood-pressure fluctuations (third-order waves). Although several explanations had been offered, none was satisfactory. In the 1960s, open-loop frequency-characteristic experiments on the cerebral ischemia circuit demonstrated that when cerebral ischemia corresponded to a blood pressure of 30–40 mmHg, the gain of this circuit increased and consequently produced self-sustained oscillation. That is, at this time, the response of the vasomotor center to ischemia became stronger. Creating corresponding conditions artificially in animals could also reproduce the corresponding blood-pressure fluctuations, and thus a reasonable explanation was made for the cause of this phenomenon.
Applying frequency-characteristic testing to control systems such as the respiratory, motor, pupillary, and carotid-sinus blood-pressure feedback circuits has advanced understanding of the physiological and pathological mechanisms of these physiological regulatory systems. After establishing a mathematical model of a biological system, analytical methods can be used to study it, thereby obtaining new qualitative and quantitative understanding of certain systems. For example, analysis of a mathematical model of the muscle-tension regulatory system, applying stability-determination data from control theory, led to the conclusion that the muscle spindle organ has the function of increasing system stability in the tension-regulation loop using muscle-spindle feedback—something that traditional physiological methods could not establish.
Because biological systems are relatively complex, there are few problems that can be solved directly by analytical methods. With the rapid development and broad application of electronic computers, mathematical simulation methods can be applied on the basis of mathematical models: that is, the mathematical model is installed in an electronic computer, allowing the system’s dynamic responses under different conditions to be studied. For example, in the entire circulatory system, it is currently clear that nine feedback systems are related to blood-pressure regulation. Each feedback system has its own operating range and a different response speed; together they achieve relative stability of blood pressure under various conditions. A system of such scale has already been studied through electronic-computer simulation. The model includes 354 blocks; each block corresponds to a physiological process, and there are more than 400 equations.
In the simulation, changing the parameters in the model corresponded to different operating states. For example, the dynamic processes of blood pressure and related conditions caused by sudden blood loss or by drinking a large amount of water when renal function was reduced were simulated, yielding quantitative results that had previously been unclear. Similarly, simulation research on the blood-gas control loop of ventilation in the respiratory system, research into the conditions producing Cheyne–Stokes breathing (a type of pathological breathing)—the principal conditions producing this breathing have been found, including excessive system gain corresponding to increased sensitivity of the respiratory center to hypoxia—and research into the time delay in the transport of blood from the lungs to the brain can all explain why cardiac patients are prone to developing this pathological breathing.
Many fields of basic medicine can be studied with cybernetics. Take cancer, for example: regardless of its cause, it manifests as disordered regulation of the growth of a cell population. A corresponding model of cancer development can therefore be established. On this basis, mathematical simulation has been used to study the dynamic process of skin-tumor development, and the results obtained were consistent with the results of animal experiments using mice.
In research on the immune system, biocybernetics regards the immune response as a complex, special feedback process. Multiple mathematical models have been established under different hypothetical conditions. Analytical and mathematical-simulation methods have been used to study the dynamic processes of differentiation of the immune-specific cells and production of antibody molecules reflected by the models, and to explore optimal schemes for immunotherapy and issues such as immune tolerance in allogeneic transplantation. In applying optimal control to study regulation of the immune system, it was discovered that the conversion of immune cells between IgG and IgM proceeds according to the Bang–Bang (switching) control method of optimal control.
In clinical medicine, cybernetics provides new methods and means for the diagnosis and treatment of disease. In diagnosis, cybernetics can make full use of the dynamic information supplied by the organism to obtain more precise and reliable diagnoses. For example, when frequency-characteristic testing was applied to patients with Parkinson’s disease, the patients manipulated a handle to track a sinusoidal-motion target. It was found that, in their frequency characteristics, the attenuation of amplitude and phase lag increased as the disease became more severe. This method can therefore be used to make a relatively good assessment of the severity of the disease and to determine the efficacy of relevant drugs.
Parameter estimation of mathematical models reflecting system dynamics, using the resulting parameters to solve medical problems, has broad prospects for application. For example, the parameters of the gas-exchange process have been estimated by measuring the components of respiratory gases, with cardiac output as one of the parameters, thereby obtaining a noninvasive measurement of cardiac output. Parameter estimation from electroencephalograms can also be used to determine the depth of anesthesia, making it possible to automate anesthesia. Parameter-estimation methods can also be used in disease diagnosis—for example, using the parameters of a mechanical model of the respiratory tract to diagnose different types of pulmonary disease, and using the parameters of a blood-glucose regulation model to diagnose different types of diabetes. Parameter-estimation methods also provide a basis for optimal treatment. For example, on the basis of parameter estimation in the blood-glucose system, an optimal treatment scheme for diabetic coma has been proposed.
Various treatment methods constitute a form of control over the organism. Applying cybernetics can improve the effectiveness of these therapies. Drugs are the most basic means of treatment. How to use drugs correctly so that side effects are small and therapeutic efficacy high, and so that drug treatment achieves the best results, is an important problem for doctors to solve. Cybernetics can provide new methods for solving these problems. Applying optimal-control theory, under certain conditions one can obtain the optimal dose and optimal interval between doses. It has been demonstrated that, for many drugs, the best effect is obtained by administering them at equal intervals. In radiotherapy and chemotherapy for cancer, optimal-control theory has begun to be applied to design optimal treatment schemes.
On the basis of cell-population dynamics and pharmacokinetic models, system-identification methods can yield model parameters with relatively good accuracy, making it possible for results obtained theoretically to be applied in practice. At present, however, optimal-control theory is often used to obtain a set of optimal treatment schemes under different constraints and performance criteria for clinical doctors to choose from. The movement and distribution of drugs, radioactive tracers, hormones, and so on within the body can be studied using compartment models. Control theory provides a way to estimate, through calculation from input and observation data, the number of compartments and the rate constants for transfer between compartments. These parameters can be used for pharmacodynamic analysis and the selection of rational medication schemes. On the basis of compartment-model analysis, optimal-control theory is used to study optimal drug-administration methods. For several drugs, it has been found that, if the drug concentration in the blood is to remain above the sterilizing or therapeutic concentration while the total drug quantity is minimized, the intervals between doses should be equal.
Adaptive control methods are the control methods most suitable for clinical application. This is because individual differences in the body’s parameters are very large, and because they also change substantially over time and as the disease changes. Consequently, ordinary methods often have difficulty meeting practical requirements. Many laboratories in China and abroad are currently studying adaptive control of blood pressure during and after surgery, and some systems have already been used clinically. The Institute of Automation of the Chinese Academy of Sciences, in cooperation with Anzhen Hospital, developed an adaptive blood-pressure control system that has been tested in the monitoring ward of Beijing Anzhen Hospital. In artificial pancreases, fully artificial hearts, left-ventricular assist devices, and other areas, experimental research on adaptive control is already under way. Adaptive control of muscle relaxation during surgery and delivery of analgesic drugs after surgery has, on the basis of animal experiments, entered clinical trials. A system is being developed that uses an electronic computer during surgery to control the delivery of anesthetic drugs, control a mechanical ventilator, and control muscle relaxation simultaneously. Experiments are under way using multiple drug infusions while adaptively controlling the patient’s blood pressure and cardiac output. These developments show that adaptive-control methods will play an increasingly important role in clinical medicine.
Automatic-control technology is being applied increasingly to clinical-medical problems, such as sensory substitution, powered prostheses, and control of artificial organs. Many problems remain for cybernetics to solve. The artificial pancreas, for example, is a device that automatically releases insulin, and control is its principal problem: insulin must be released according to need so that a diabetic patient’s blood-glucose value remains close to that of a healthy person. Since the 1960s, the United States, Canada, and other countries have begun developing this technology; by 1974, a large bedside artificial-pancreas product had appeared. Development is now moving toward miniaturization. A complete artificial pancreas consists of a blood-glucose sensor, an electronic computer, and a micropump, forming a closed-loop control system. Optimal-control and adaptive-control methods have already been used to improve the computer-control program. However, because the sensor is required to be small, reliable, and capable of stable operation, a blood-glucose sensor that meets all these requirements has not yet been readily achieved. Recently, program-controlled open-loop portable artificial pancreases have developed rapidly.
The scope of cybernetics’ application in biomedicine is extremely broad. In theoretical research and practical work on qigong, cybernetics may also be applied and thereby bring about substantial progress. Biofeedback technology, which is closely related to qigong, is currently developing relatively rapidly abroad; this is one of the important fields in which cybernetics is applied. Biofeedback uses physiological-parameter measuring instruments to feed information about the body’s physiological state through the human sensory system back to the person, thereby guiding people, through training, to learn to control their own internal environment. Signals such as myoelectric activity, electrical activity, skin temperature, and heart rate have already achieved relatively good therapeutic results in treating hypertension, neuralgia, muscle spasms, and other diseases.
In short, biocybernetics studies biomedical problems from holistic, dynamic, and quantitative perspectives. It has made rapid progress in basic research on physiological, pathological, pharmacological, and other mechanisms; in disease diagnosis and treatment; and in the development of sensory compensation and artificial organs. From now on,
It will subsequently play an increasingly important role in every field of biomedicine, including research topics concerning qigong.
III. Establishing a Phenomenological Model of Qigong
After deeply analyzing the current state of qigong science, the renowned Chinese scientist Qian Xuesen proposed the task of establishing a phenomenological qigong science. Therefore, the most urgent task in qigong-science research is to establish a phenomenological model that reflects the qigong process. Professor Qian Xuesen also pointed out that a human being is a giant system with a hierarchical structure, that people are closely related to their environment, and that the brain can act back upon lower levels. Researching such a complex system requires applying the theories and methods of systems science. To establish a phenomenological model reflecting the changes in the human system during the qigong process, Professor Qian believed that several levels of data and information needed to be considered. The first level is grounded in the objective changes in the illness during qigong treatment; the second level is the practical experience summarized by qigong practitioners; and the third level is the theoretical literature on qigong. Starting from the second level, the data from the first level should be used for verification, and qigong books should be used to assess the model being established. Finally, it must also be examined for compatibility with Marxism, systems-science theory, and certain basic knowledge. Clearly, this is a fairly arduous task.
By applying the methods of systems science, the changes in the human system during qigong practice, qigong practitioners’ practical experience, and the qigong theories in classical literature can be integrated; the relationships and contradictions among these materials can be clarified; and they can be summarized relatively systematically in a model. Such a model will be able to reflect the qigong process—that is, the relationship between the practitioner’s qigong state and the various factors affecting this process. If the model is relatively successful, it will correctly grasp the principal factors in the qigong process and may be able to guide our qigong practice. Based on the influence of different factors on qigong, we will be able to predict what kind of qigong state will appear when those factors change. Conversely, in order to reach the qigong state we desire, we need to create the relevant conditions, or determine how to change the control factors, in order to attain the expected qigong state. At the same time, using a phenomenological qigong model can provide reliable clues for further exploring qigong’s principles. Therefore, establishing a phenomenological qigong model will enable the theory and practice of qigong to advance one step further.
At the outset, the phenomenological qigong model we wish to establish cannot possibly encompass everything. More likely, we will first establish a model reflecting a specific qigong process under a specific set of circumstances. Various qigong models of different levels of complexity and different types can be established, and models can be established separately for different practices. The black-box theory of cybernetics can provide a theoretical basis for different types of qigong models, and can point the way toward the continual deepening and development of all kinds of models. In establishing models that reflect reality, in obtaining system-model parameters through the measurement of actual data by means of system identification, and in simplifying models by disregarding secondary factors while retaining principal ones, systems science has already accumulated a relatively mature set of methods. These methods can be used to help establish a phenomenological qigong model. Biocybernetics will play its due role in establishing the phenomenological qigong model and in the continual deepening and development of qigong models.
IV. Biocybernetics and Qigong
As discussed above, qigong enables the organism to reach a special state through the control of consciousness. To study the qigong process, it is necessary to establish a model reflecting this process. A phenomenological qigong model should be established first, while the principal method biocybernetics uses to study biological systems is to establish mathematical models of the relevant systems. A mathematical model grasps the system’s dynamic processes and quantitative relationships in a concise and explicit form. Moreover, through analysis, calculation, and simulation of the mathematical model, it is possible to predict the system’s future and determine its dynamic changes under different external actions and environmental conditions. Therefore, the theories and methods of biocybernetics can be applied to the study of qigong; in particular, they can play an important role in establishing a phenomenological mathematical model of qigong.
The purpose of cybernetics is to study systems, especially complex systems. In studying complex systems, cybernetics developed black-box theory, making quantitative research possible even when the system’s internal structure is unclear. Regardless of how complex the system’s interior is, it is treated as a black box, and the system is grasped through the effects exerted on it by the outside and its effects on the outside. Its characteristics are determined from the response it makes to input quantities—that is, its output. As long as the relationship between the input and output quantities is the same, the two are regarded as equivalent. This method is of great significance for qigong research. Because the human body is an extremely complex system with a multilayered structure, many details of each structural level and of the connections between the various levels are not yet clear.
We cannot wait until physiology, biochemistry, molecular biology, and other disciplines have clarified these details before beginning qigong research. By applying black-box theory, we can temporarily regard the things whose details are unclear as a black box, and examine it solely through the relationship between its inputs and outputs. A corresponding mathematical model can then be established. Thus, existing knowledge and information, as well as experimental data already obtained, can be fully utilized to make reasonable generalizations. In this way, our understanding of the qigong process can be advanced another step. The completion of such a model is not the final completion of the task. As science and technology advance, some details originally inside the black box will gradually be revealed. As part of the black box is opened, we can establish a somewhat more complete model. However, humanity’s understanding of the objective world will not remain at one level. Black-box theory enables us not only to establish a qigong model at our current level of understanding, but also to point the way toward continually deepening our work in the future and establishing more accurate and more complex qigong models.
The changes produced by the qigong process in the human-body system may differ greatly under different practices. However, judging from what has already been observed, different practices all produce extensive changes and all involve the various physiological regulatory systems. Biocybernetics has applied cybernetics to the relatively in-depth study of many physiological systems, established mathematical models of these physiological regulatory systems, and, through analysis of these mathematical models and computer-simulation research, revealed the responses of these systems under different conditions and clarified the roles and mutual influences of the various parts of the systems, as well as the influence of the external environment or inputs on the systems. Changes in the parameters of these mathematical models can reflect the mutual transformation between normal physiological and pathological states of the systems. Therefore, on the basis of biocybernetics research, we can use the already established mathematical models of the regulatory processes of the various physiological systems to study the influence of qigong on these physiological processes. The changes caused by qigong may cause changes in the parameters of the corresponding mathematical models, or changes in the external environment or inputs of the corresponding systems. By analyzing these circumstances, it may be possible to discover the pathways through which qigong regulates the various physiological systems. Adding these regulatory factors to the original mathematical models may produce a model reflecting the qigong process,
Qigong regulates and controls the human body through self-awareness. Consciousness is a product of the nervous system. Clearly, the nervous system plays an extremely important role in the formation of the qigong state. To study the changes in the human-body system caused by qigong, it is first necessary to clarify the changes in each part of the nervous system during the qigong process. Biocybernetics studies information processing in the nervous system and its function of regulating and controlling the organism. It has already achieved relatively important results in studying the transmission and processing of information in the sensory systems, the structure and function of information-processing systems within the brain, and the nervous system’s control of the motor system. Therefore, applying the results of biocybernetics research on the nervous system to qigong research will help reveal the changes in the nervous system during the qigong process, as well as the conditions that produce these changes, thereby taking qigong research a step further.
Qigong is a complex human regulatory and control process involving a wide range of aspects. There are many laws governing this process that modern science and technology have not yet resolved. Therefore, applying cybernetics to the study of qigong may reveal currently undiscovered laws of human regulation and control, thereby also promoting the development of biocybernetics.
“In the following chapters, we will introduce separately the achievements of biocybernetics in researching the various subsystems of the human body, including achievements concerning the nervous system, respiratory system, circulatory system, human thermoregulatory system, immune-regulatory system, endocrine system, and so forth. We will also discuss the possible significance of these results for qigong research, providing useful ideas and clues for in-depth research on qigong.
Chapter Two: The Nervous System and Qigong
The nervous system is the control center of the entire human body, as well as the processing center that receives information transmitted from the outside world. Consciousness, meanwhile, is a function of the higher region of the nervous system—the cerebral cortex.
In the preceding chapter we already pointed out that qigong achieves a special state in the organism through the active control of consciousness. This state refers mainly to function: given the brain’s existing organizational structure, a particular functional state appears. Therefore, the nervous system plays an especially important role during qigong. A considerable part of the qigong state may be realized through the body’s control system centered on the neuroendocrine system. In this chapter we will focus on the information-processing and control functions of the nervous system. We will analyze the relationship between qigong and the nervous system from the perspectives of the overall function of the nervous system; the division of labor and coordination among its various parts; the transmission and processing of information in the sensory systems; the plasticity and learning functions of the nervous system; the formation of conditioned reflexes; the regulation of emotional and stress responses; the nervous system’s control of the internal environment; and changes in the nervous system during qigong. We will explore the possible pathways through which the nervous system may act in the qigong process.
I. The Brain’s Basic Functional Systems
The human brain is composed of approximately 100 billion nerve cells (or neurons), forming an extraordinarily complex system. The functions of this enormous system are likewise extremely rich and varied. Qigong is closely related to people’s conscious psychological activity. Therefore, analyzing the brain’s basic functions in psychological processes and exploring the relationship between these functions and the qigong process are important for revealing the principles of qigong.
Every psychological process can proceed smoothly only through the mutual coordination of many parts of the brain.
This is carried out through the basic functions of the nervous system involved in psychological processes. According to the analysis of the famous Soviet neuropsychologist Luria, these functions can be roughly divided into three basic functional systems. The first functional subsystem regulates levels of tension and states of arousal; the second receives, processes, and stores information about the external world; and the third formulates, regulates, and controls psychological activity. Clearly, most psychological processes can be completed only through the mutual cooperation of these three basic functional subsystems.
The reticular formation of the brainstem is the principal component of the subsystem that regulates levels of tension and states of arousal. The reticular formation of the brainstem can activate or inhibit all of the organism’s sensory and motor functions, and can regulate the organism’s states of sleep and wakefulness. To ensure that psychological processes proceed as needed, a person must be in an awake state. Only under this condition can a person receive information and process incoming information, formulate a program of activity, and control psychological processes. We know that in the dream state, psychological processes cannot be clearly controlled. At such times, the thoughts or images appearing in people’s minds are disorganized, cannot reflect actual conditions, and cannot complete psychological processes in a directed and selective manner. Maintaining an appropriate level of tension in the cerebral cortex is a necessary condition for purposeful, directed activity by the brain. In addition to the brainstem reticular formation, some neurons in subcortical structures such as the hippocampus and caudate nucleus also participate in regulating tension. These structures are not within the cortex, but they have two-way connections with the cerebral cortex: they can regulate cortical tension, while at the same time being regulated by the cerebral cortex.
In the qigong state, the subsystem regulating tension does not completely suppress cortical activity as it does in sleep, but it also appears to differ from the ordinary waking state. Clearly, this subsystem will play an important role in ensuring the establishment of the qigong state, because it is involved in regulating and controlling the basic state of the entire organism.
The subsystem that receives, processes, and stores external information. According to its functional nature and the specificity with which it processes information, this subsystem can also be divided into several levels. The first level directly receives incoming external information. It is located mainly in the posterior part of the cerebral cortex and includes the primary sensory areas for different senses, such as the primary visual area (the occipital lobe), the primary auditory area (the temporal lobe), and the primary somatosensory area (the parietal lobe). A characteristic of this level is that its different parts have clear specificities for patterns of information.
For example, the first primary visual area of the visual cortex (Brodmann area 17), the auditory area in area 41, and general somatic sensation in area 3. In these areas, neurons respond only to the corresponding specific sensation, and there is a clear correspondence with the original information. For example, excitation of a neuron in area 17 corresponds to light stimulation at a particular location on the retina. At the second level, such as the second primary visual areas (areas 18 and 19) and the general somatosensory areas (areas 1, 2, and 5), neuronal excitation corresponds to the result of processing the original information and reflects certain features of a class of sensations. For example, in occipital areas 18 and 19 there are so-called “complex cells” and “hypercomplex cells”; their responses are unrelated to the position of the light stimulus on the retina, but are related only to certain features of visual input, such as light stimulation from a line segment in a particular orientation or light stimulation corresponding to movement in a particular direction. At the third level, neuronal excitation reflects the result of integrating different sensory patterns. This occurs mainly in association areas of the cortex. Information is organized here, and the neurons can respond to several sensory modalities, meaning that their specificity is reduced. Neurons at these higher levels have less specificity; information is processed at every level, making it more suitable for processing at the next higher level.
During qigong practice, generally, visual and auditory input is required to decrease, while incoming information from the outside remains between seeming awareness and seeming non-awareness. This indicates that this subsystem appears to be in a relatively low state of excitation during the qigong process.
In addition, judging from the regularities in the relationships among the various kinds of sensory information in the human body, besides mutual inhibition among the various senses, there is also mutual inhibition between surface and external sensations on the one hand and visceral and deep sensations on the other. Unfortunately, our current understanding of the visceral and deep sensory systems is still limited. Under ordinary circumstances, people attend to changes in the external environment, while internal and visceral sensations are in an inhibited condition; we cannot sense activity within the body. The qigong state may create a special condition in which external perception is inhibited, thereby strengthening the connections between the viscera and deep tissues and the cerebral cortex. This would benefit the cerebral cortex’s control of the internal environment, putting the internal environment into a state more favorable for preventing and treating disease.
The subsystem for planning, regulating, and controlling complex activities is located mainly in the anterior part of the cerebral cortex. The behavior and activities of higher animals are complex and require the integration of various circumstances in order to produce appropriate actions. This subsystem also has different functional levels. At the lowest level is the brain’s “output” link, located mainly in the motor area of the cortex (area 4). Different movements—such as those of the fingers, wrist, neck, trunk, and face—have corresponding representative points.
Thus, excitation of neurons at a certain position in the motor cortex can elicit a particular movement. The second level is the part responsible for formulating motor programs and preparing motor commands, including the premotor area and the internal association area. At this level, neuronal specificity is reduced: neuronal excitation does not correspond only to movement of one particular body part. The highest level is located mainly in the frontal lobe. It plays an important role in forming intentions, formulating motor programs, and regulating and controlling the most complex human behaviors. In humans, the frontal lobe is the structure that developed most recently and most rapidly. The frontal lobe accounts for approximately 14.5% of the entire brain in anthropoid apes, whereas in humans it reaches 24%. It is built upon the various parts of the cerebral cortex and has the broadest functions. The frontal lobe has extensive connections of nerve fibers with other parts of the brain, enabling it to integrate the various incoming signals and to plan and prepare various behaviors in advance.
The frontal lobe has close connections with the limbic system and the hypothalamus, while the limbic system is also a control center for emotion and the internal environment. During qigong, the planning, regulation, and control subsystem may, through the activity of the frontal lobe and under the guidance of consciousness, play a leading role in forming the qigong state. In the qigong state, this subsystem will shift its planning from external movement to planning and controlling the internal environment. The other levels are generally inactive. However, during spontaneous movement practice and when spontaneous movements are elicited, neural structures at the other levels will also participate in activity.
The three functional subsystems described above are not independent of one another; rather, they are interconnected. All activities of the organism depend on the division of labor and cooperation among the subsystems. For example, during voluntary movement, the first subsystem ensures that the muscles remain at the necessary level of tension. Without an appropriate level of tension, no coordinated movement is possible. The second subsystem ensures the correct completion of the movement by transmitting various kinds of information about the movement’s result into the brain and integrating it. The third subsystem, based on the requirements and the incoming information, determines the motor-execution program and ensures that the movement conforms to its predetermined purpose. A failure of any one subsystem will cause an impairment of movement. Clearly, during the qigong process these three functional subsystems should likewise be in a mutually coordinated and unified state. Analyzing the condition of each functional subsystem during qigong and clarifying the role of each subsystem in the qigong process is an important component of the principles of qigong.
At present, research on these functional systems is mainly limited to the conditions of everyday life; sufficient data on the special state of qigong are still lacking.
II. The Structure of the Central Nervous System and Its Information-Processing Functions
The central nervous system consists of two major parts: the spinal cord and the brain. The brain, in turn, is composed of the brainstem, diencephalon, cerebellum, and cerebral cortex. The general structure of the brain and spinal cord is shown in Figure 2-1.
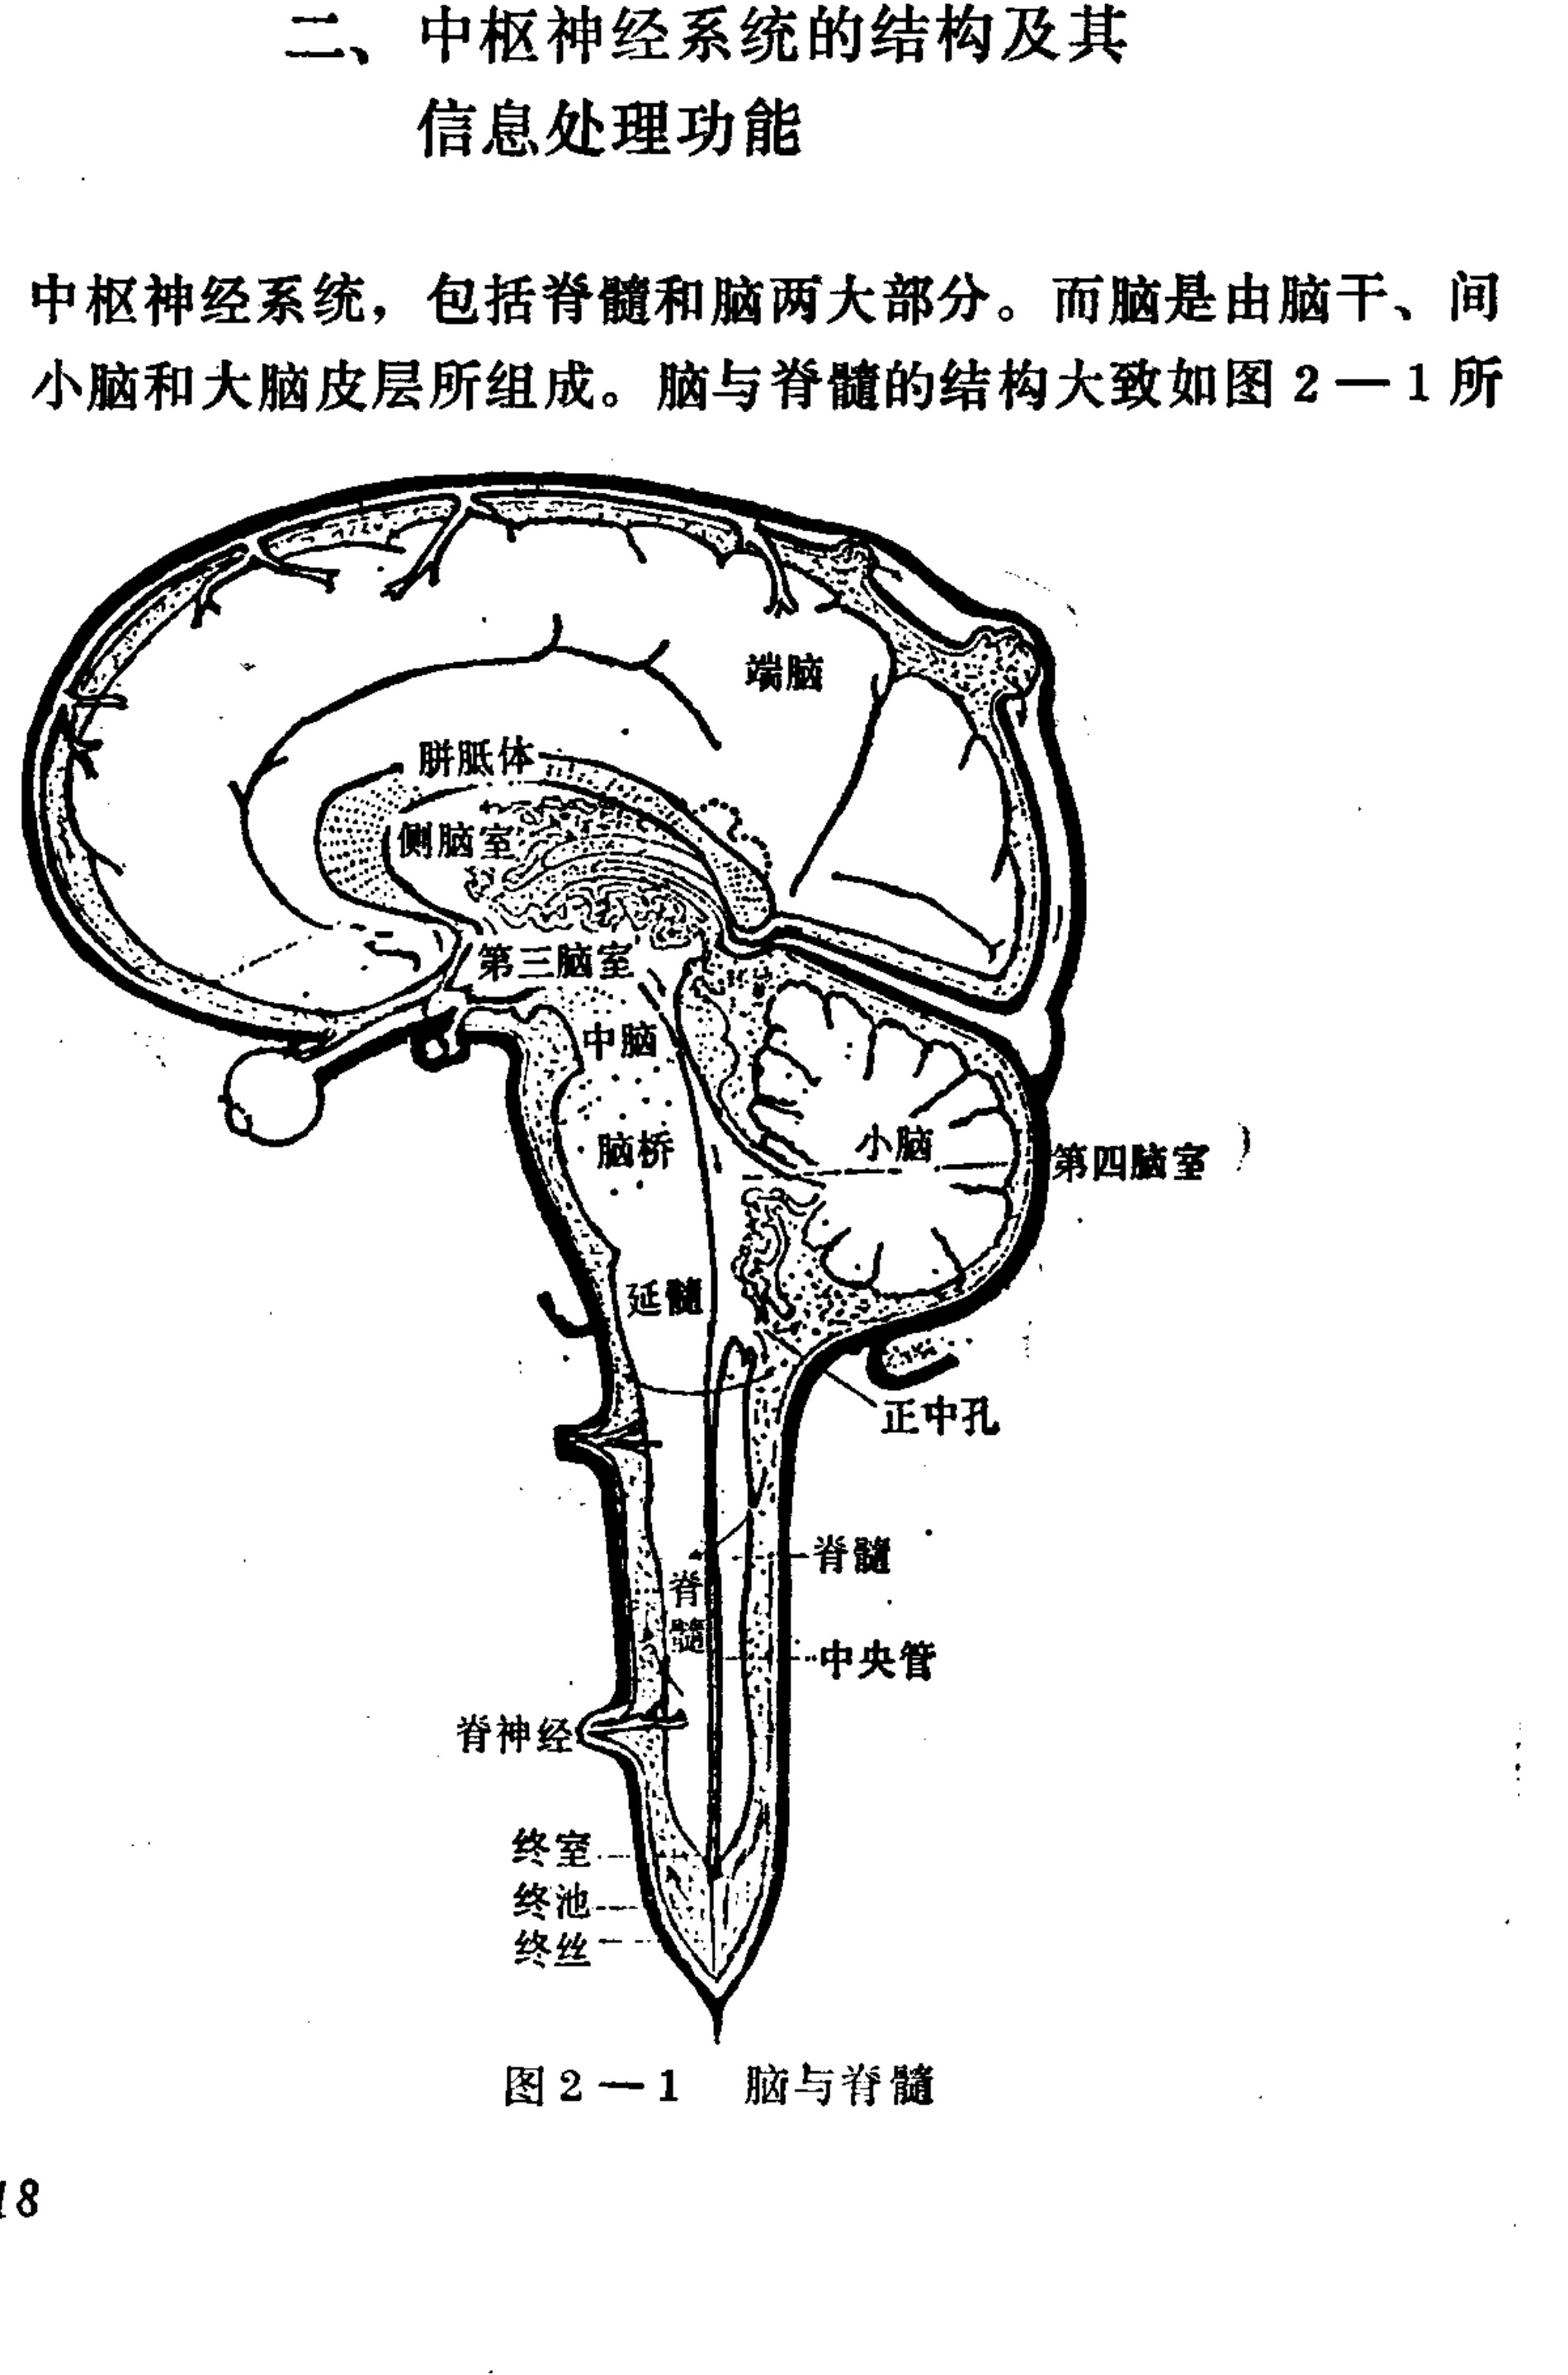
Figure 2-1. The brain and spinal cord
Translated labels: Telencephalon; Corpus callosum; Lateral ventricle; Third ventricle; Midbrain; Pons; Medulla oblongata; Cerebellum; Fourth ventricle; Foramen of Magendie (Median aperture); Spinal cord; Central canal; Spinal nerve; Terminal ventricle; Terminal pool; Terminal filament
The cerebral cortex is the highest-level part of the nervous system and the material basis of human conscious activity and thought processes. The cerebral cortex almost covers the other structures of the brain. The human cerebral cortex has a volume of approximately 2,600 cubic centimeters and is estimated to contain 100 billion nerve cells. The monkey brain has a volume of only 400 cubic centimeters. This shows that the cortex is the structure that developed most rapidly and most recently during phylogenetic development.
In the vertical direction, from the scalp inward, the cerebral cortex can be roughly divided into six layers. The cell types and the types of afferent fibers in each layer are different. In the horizontal direction, along the surface of the brain, it can be divided into different regions. The structures of these regions, especially their functions, differ from one another. Figure 2-2 shows a rough division of the cerebral cortex into regions. The cerebral cortex can also be divided more finely. Brodmann’s scheme, which divides it into 52 areas, is accepted by most people.
Morphologically, the nerve cells of the cerebral cortex comprise roughly 50–60 different types. The cerebral cortex has two-way connections with the other structures of the brain and exercises control over them. It is therefore the highest center for the organism’s information processing and the center for the organism’s regulatory control.
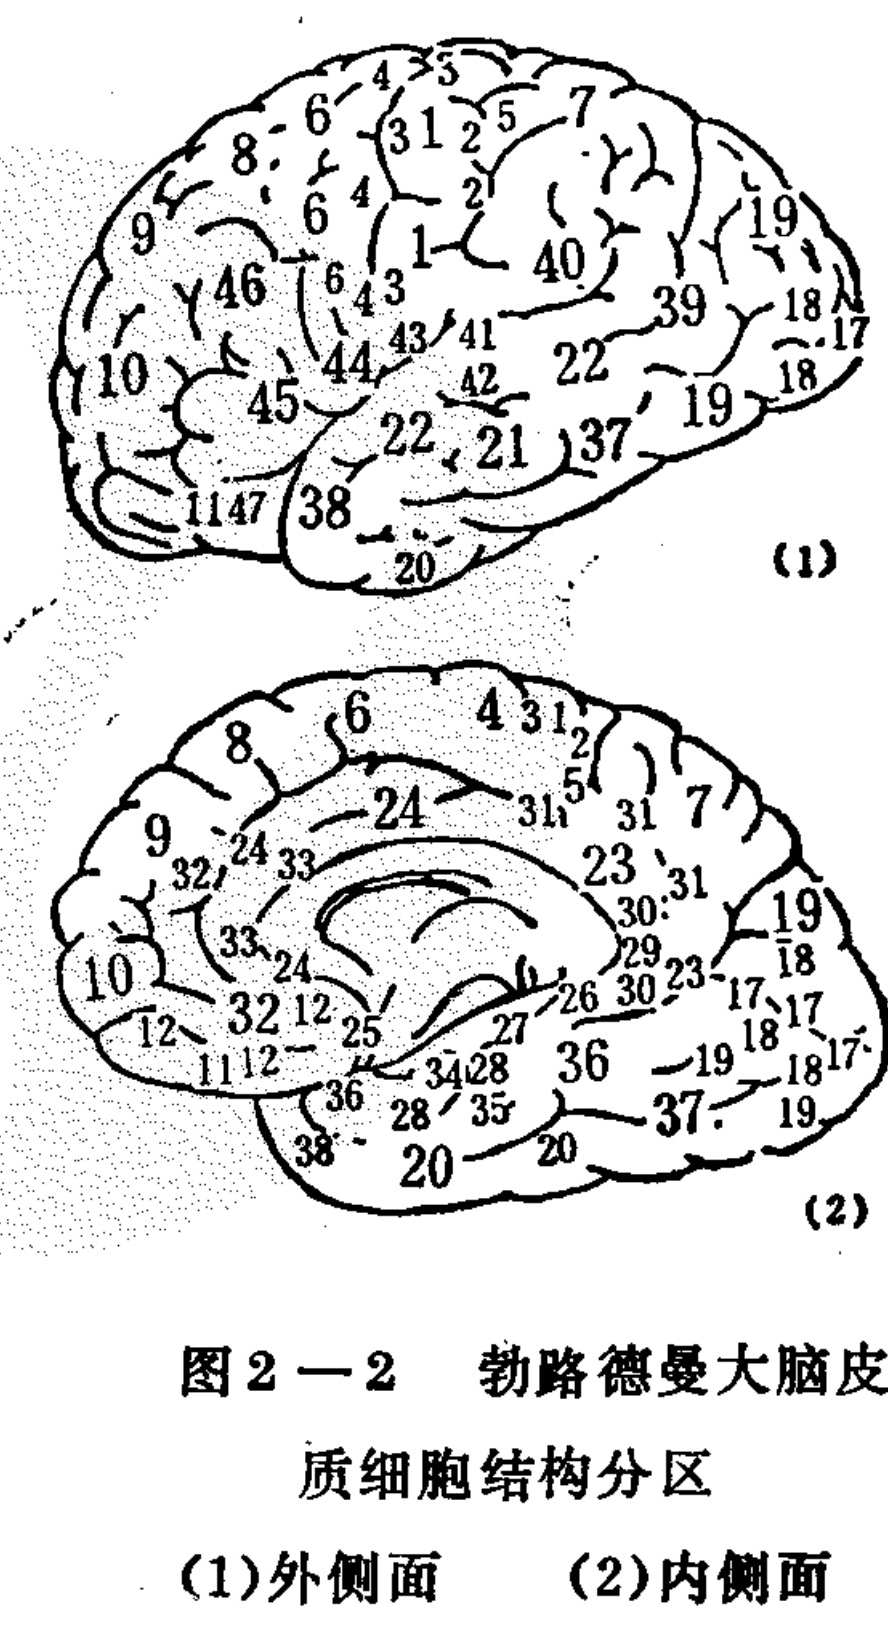
Figure 2-2. Brodmann’s division of the cerebral cortex into cellular-structural areas
Translated labels: Brodmann’s cytoarchitectonic areas of the cerebral cortex; (1) Lateral view; (2) Medial view
(1) Lateral view (2) Medial view
19
(2)
On the medial side of the cerebral cortex are many relatively ancient neural structures, collectively called the limbic system. These include the hippocampus, septal area, amygdala, cingulate gyrus, and others; their anatomical distribution is shown in Figure 2-3. The functions of the limbic system are closely associated with somatic and visceral activity and play an important role in regulating the organism’s basic activities. It regulates other primary centers and also has important effects on autonomic nervous-system functions, emotion, learning, and memory. It may also be an important hub involved in the qigong process.
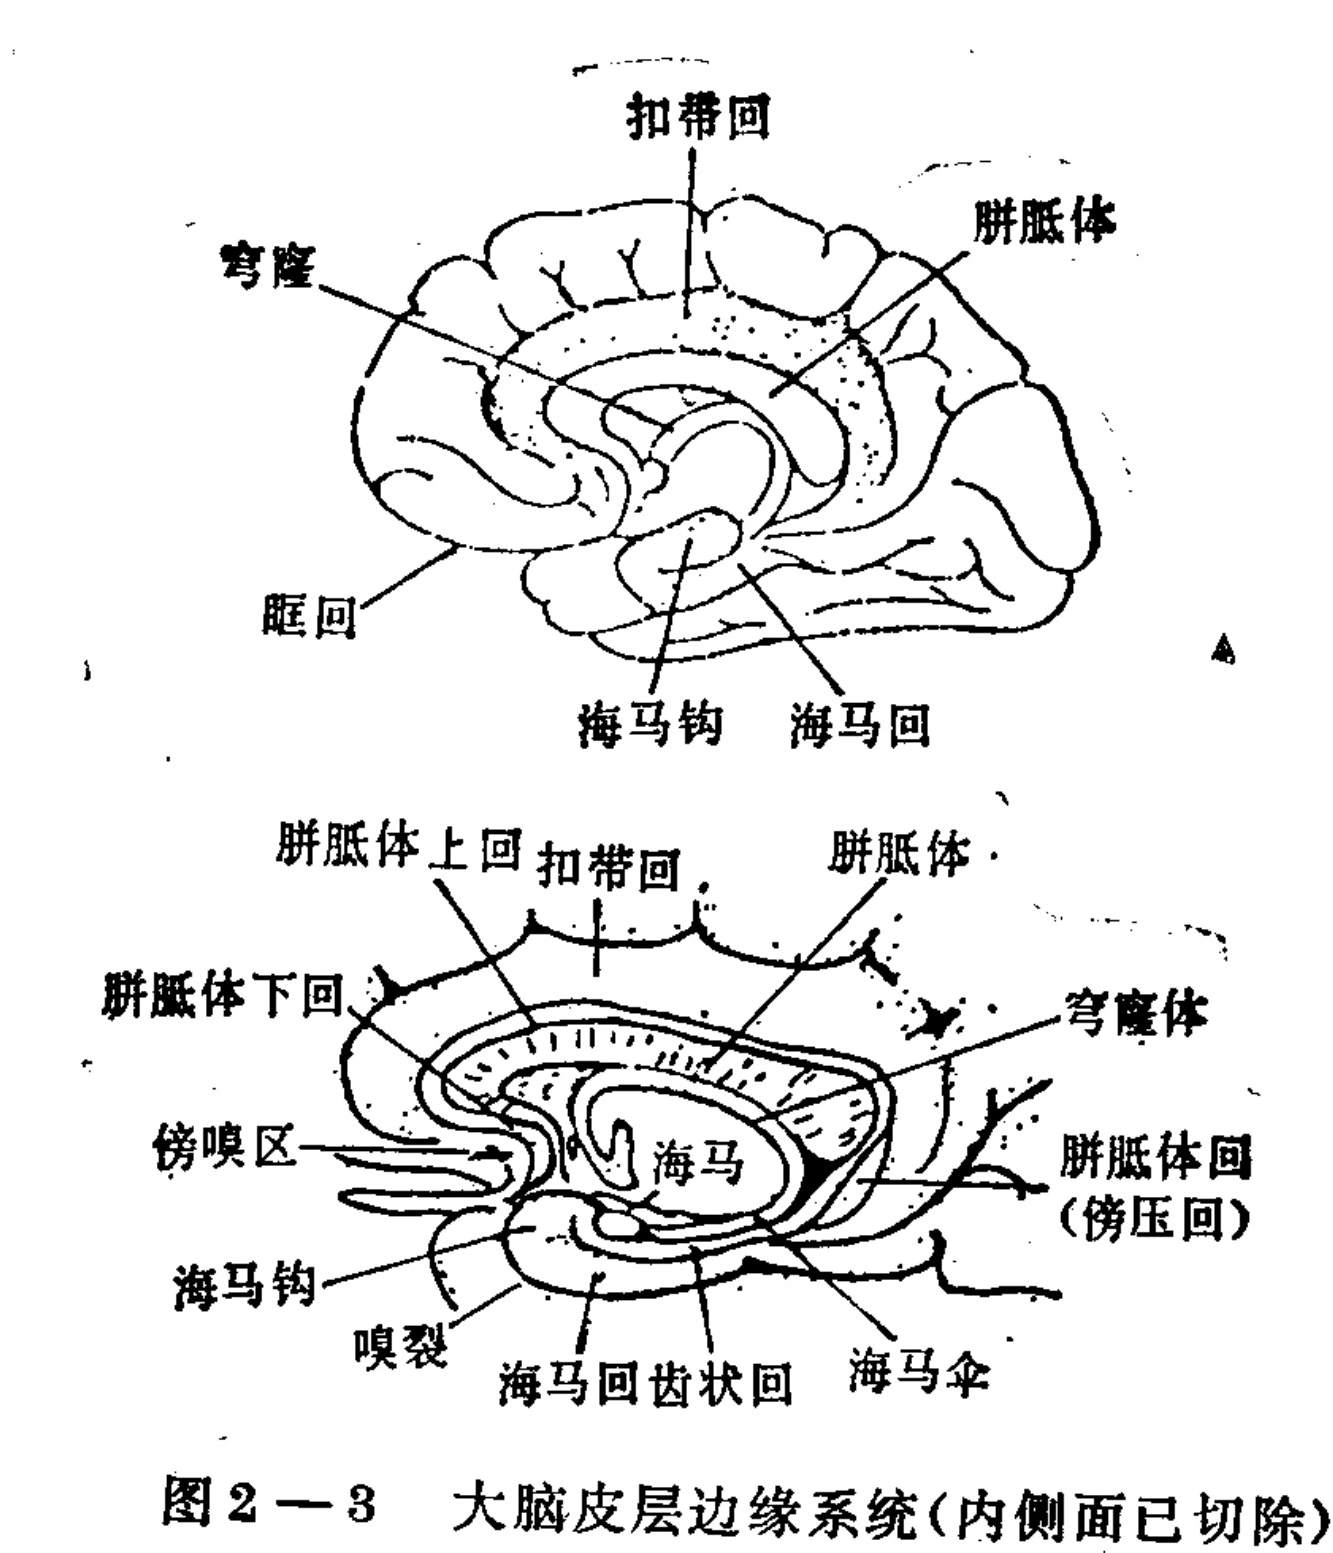
Figure 2-3. The limbic system of the cerebral cortex (medial surface, cut away)
Translated labels: Cingulate gyrus; Corpus callosum; Parahippocampal gyrus; Orbital gyrus; Hippocampal uncus; Hippocampus; Genu of corpus callosum; Splenium of corpus callosum; Subcallosal area; Dentate gyrus; Hippocampal fascia; Olfactory sulcus; Paraterminal gyrus; Presubiculum; Retrosplenial gyrus (paracentral gyrus)
Between the cerebrum and the midbrain lies the diencephalon. It includes the thalamus, epithalamus, hypothalamus, and the subthalamic region. The thalamus is a relay station through which various sensory signals enter the cerebrum, and it plays an important role in processing signals within the brain. Some people compare the thalamus to the operating-management system of a cerebral computer. The hypothalamus, meanwhile, is a higher center controlling the internal environment. In addition to directly controlling centers such as those for thermoregulation, feeding, and hunger, it coordinates other internal-environment activities, including modulation of the cardiovascular centers.
The hypothalamus is connected to the pituitary gland, and the pituitary regulates the body’s endocrine activity. Therefore, the hypothalamus plays a crucial role in maintaining the body’s normal physiological state. During qigong, the hypothalamus may also be an important link.
The brainstem is the part within the cranial cavity that extends downward to the spinal cord. It includes the midbrain, pons, and medulla oblongata. Nerve fibers mutually connecting the spinal cord to the cerebral cortex and cerebellum must all pass through the brainstem. Many nerve centers governing basic physiological processes, such as the cardiovascular center and respiratory center, all are located in the brainstem. Near the brainstem’s central axis, extending from the medulla to the thalamus, is a group of relatively scattered neural nuclei known as the brainstem reticular formation. These nuclei have extensive connections with one another and with other brain structures; they are interconnected in all directions and can reach almost every brain structure. As described in the preceding section, they are major components of the functional system that maintains the organism’s overall wakefulness and regulates its level of arousal.
Because the nerve-fiber connections among them are extremely complex and form a network, this structure is called the reticular formation. Neurons in the brainstem reticular formation receive an average of 1,000 inputs, and their axons (outputs) can extend throughout the brainstem. A single cell can receive sensory signals from auditory, visual, and tactile stimuli, as well as incoming signals from internal organs and hormonal changes. The neurons here differ greatly in size, shape, coloration, and other characteristics—features not found in the other brain structures—indicating the diversity of this structure’s functions.
The brainstem reticular formation has two-way connections with the cerebral cortex above and the spinal cord below. In both directions there are inhibitory and excitatory nerve fibers. All sensory systems send collaterals to the reticular formation. The brainstem reticular formation can regulate the excitability of the cerebral cortex. If it is damaged, an animal may remain unconscious for a prolonged period.
Across vertebrates, the basic structural form of the brainstem reticular formation remains essentially unchanged. From lower mammals to humans, the volume of the reticular formation increases only 2.5-fold, whereas the volume of the medulla increases ninefold and the volume of the cerebral cortex increases 90-fold. Thus, the reticular formation is a relatively basic structure. It may be the control center for the organism’s state, or it may correspond to the queuing-and-interrupt system of an electronic computer, with the ability to select the operating state of the entire system.
The reticular formation in humans contains approximately two million neurons. The organism has various basic operating states, of which some estimate there are roughly twenty-odd kinds, such as sleep, eating, fighting, and escape. In each state, the distribution of excited neurons in the brainstem reticular formation differs, thereby controlling the various parts of the organism to meet the specific demands of survival.
For example, in a fighting state, the spatial resolution of vision decreases, the pain-perception system is almost completely cut off, and clear thinking temporarily stops, producing an angry expression. At that time, movement tends toward fixed motor patterns and causes blood glucose to rise, among other effects. The transitions among these basic states can be completed within a fraction of a second.
The qigong state may also be a special state. However, it seems to differ from the ordinary basic states and may require more refined regulation; its establishment is slower. During transitions between basic states, it requires that within a short time, millions of neurons produce coordinated changes, bringing the organism to the corresponding required state. Like a kaleidoscope, when it is rotated slightly, various patterns appear. The American scientists Kilmer and McCulloch proposed a reticular-structure model capable of realizing the basic-state transitions described above. This model consists of 12 identical modules. Each module corresponds to the neurons within a 100-micrometer-thick slice of the reticular formation of the brainstem. When this brainstem reticular-structure model was simulated with an electronic computer, results consistent with the hypothesis were obtained: it could simulate an animal’s ability to rapidly change its basic state when circumstances changed.
The spinal cord is a lower-level center of the nervous system. It lies within the vertebral canal, is connected to the medulla oblongata, and extends down to between the first and second lumbar vertebrae. It is approximately 40–50 cm long. Along the spine, the human spinal cord is divided into 31 segments. Each segment governs part of the muscles and glands and the corresponding incoming sensory information. Each segment also gives off a pair of nerves: 8 pairs of cervical nerves, 12 pairs of thoracic nerves, 5 pairs of lumbar nerves, 5 pairs of sacral nerves, and 1 pair of coccygeal nerves. The muscular movements and somatic sensory input of the upper limbs are governed or transmitted by the cervical nerves. The lower limbs are governed mainly by the lumbar and sacral nerves. Within each segment there are both incoming fibers from sensory organs and nerve fibers that transmit outgoing motor commands.
With the spinal cord as their center, these form reflex arcs and produce some of the body’s basic reflexes. For example, when the tendon below the front of the knee joint is struck, the lower leg immediately jumps forward—the knee-jerk reflex. This reflex occurs because sensation in the muscle becomes a nerve impulse that travels through nerve fibers via the posterior root to the reflex center in the spinal cord. The reflex center emits an impulse, which is transmitted by the outgoing fibers of a spinal nerve through the anterior root to the muscle, causing the muscle to contract and produce movement. This is a simple feedback system, as shown in Figure 2–4. The spinal cord is a local controller.
Diagram labels: skin (receptor); afferent neuron; efferent neuron; skeletal muscle (effector); posterior root of spinal nerve; spinal ganglion; cell body; interneuron; spinal cord; synapse; anterior root of spinal nerve.
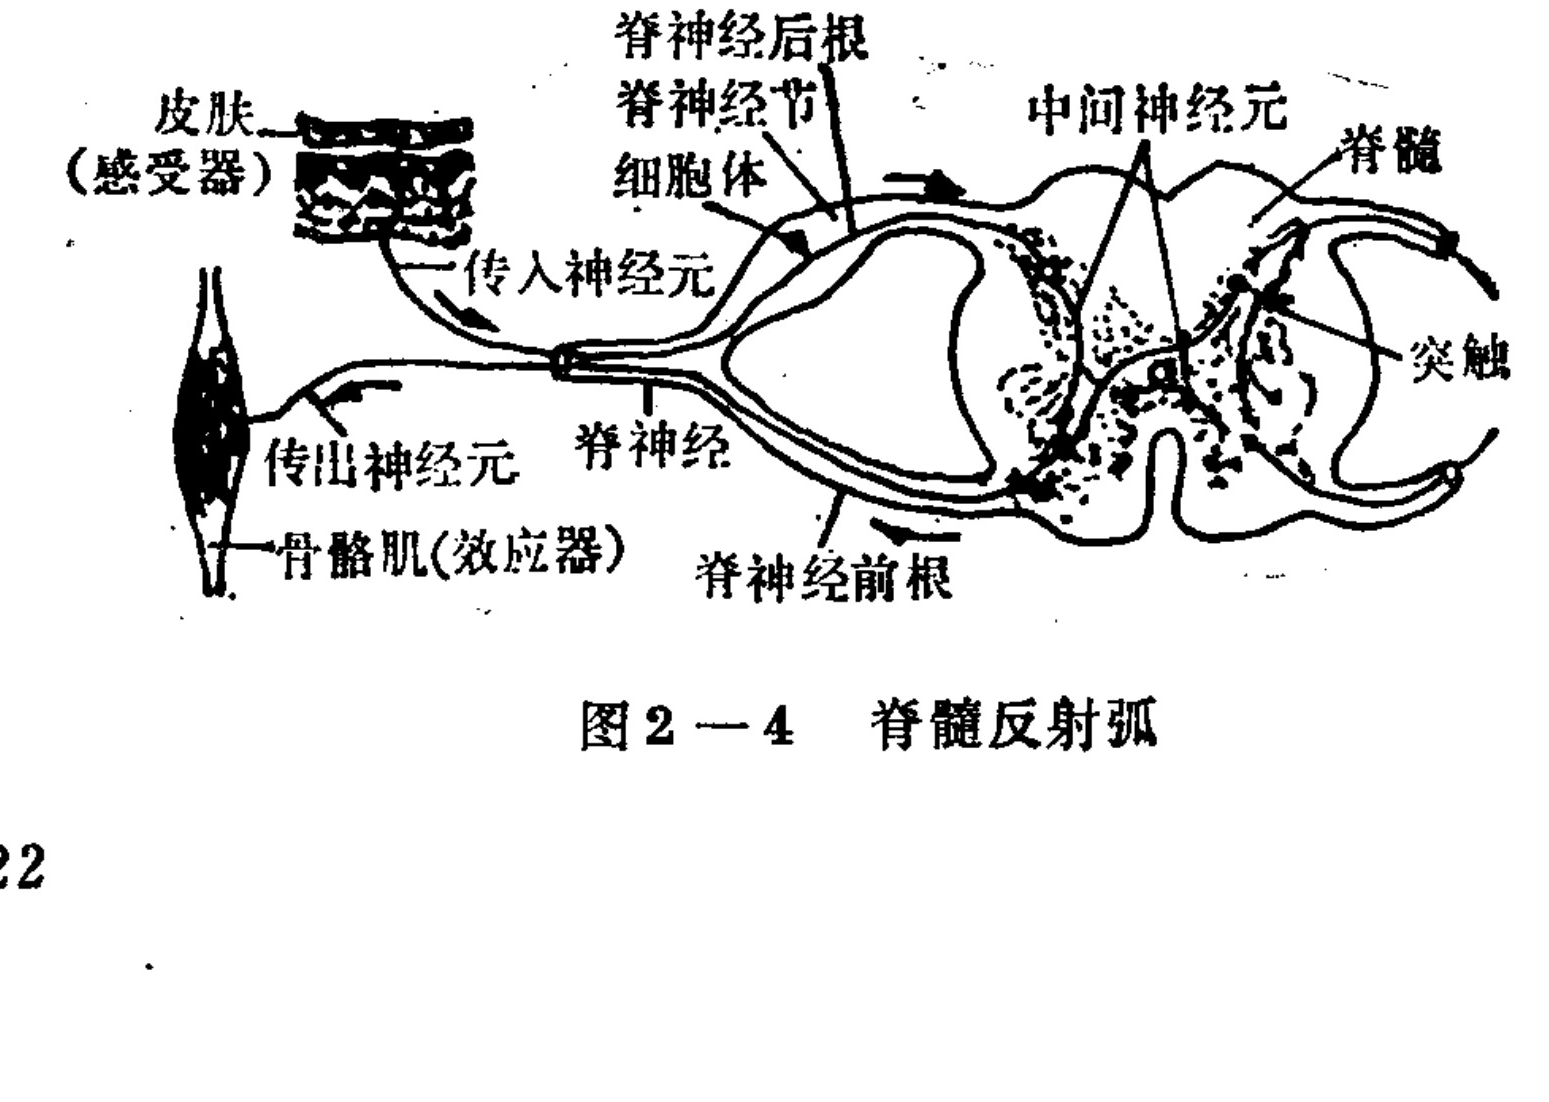
Figure 2–4 Spinal reflex arc
Translated labels: Skin (Receptor); Afferent neuron; Sensory ganglion; Cell body; Dorsal root of spinal nerve; Spinal nerve; Ventral root of spinal nerve; Efferent neuron; Skeletal muscle (Effector); Interneuron; Spinal cord; Synapse
When the body’s local tissue is injured or threatened, this local controller enables the organism to respond rapidly and control the situation in time to avoid harm. For example, after a person touches an electric wire, the hand immediately withdraws; this is also a reflex action. Because the speed of nerve transmission is not high—generally less than 100 meters per second—if all information had to be transmitted to the cerebral cortex and analyzed and integrated before a response was made, irreparable damage might already have occurred. Therefore, the spinal cord’s local controller acts through a reflex immediately, enabling the body to escape danger. Through long-term evolution, the nervous system formed an arrangement in which the “central” and the “local” each perform their own functions, integrating centralization and decentralization and thereby effectively ensuring the body’s normal activity. The spinal cord can also control the activity of the viscera and glands through the spinal nerves and the sympathetic nerve chain. These matters will be discussed in the next section.
The cerebellum lies on the dorsal side of the medulla oblongata and pons. It is generally believed that the cerebellum’s main function is to coordinate the movements of skeletal muscles. When a patient with a cerebellar lesion is given a cigarette, his hand swings back and forth and cannot catch it. A drunk person staggers as he walks because alcohol has a specific paralyzing effect on cerebellar cells. The cerebellum is the most orderly part of the brain’s structure, and more is known about its structure and function than about those of other brain regions. The human cerebellum contains approximately one billion neurons, of five types. Purkinje cells and granule cells are the most basic; the cerebella of lower animals contain only these two kinds of cells. As organisms evolved, the types of neurons in the cerebellum increased, but the newly added neurons were inhibitory. These inhibitory cells exert feedback inhibition, which can accelerate the system’s response and increase its ability to distinguish input patterns. This is consistent with higher animals’ ability to rapidly perform complex movements.
Coordination by the cerebellum is not present innately. Everyone goes through the process of stumbling while learning to walk, and precise movements require arduous learning or training before they can be mastered. For example, when we learn to ride a bicycle, at first we must concentrate completely; if we are even slightly inattentive, we may fall. After a period of learning, however, we can master the skill, and by then we can manage it with ease even when absent-minded. At first, the cerebellum does not know how to coordinate muscle movements, so every movement requires the brain to issue commands governing the activity of the corresponding muscle groups. Human consciousness can process only about 100 bits of information per second, so one must concentrate and proceed relatively slowly in order to complete the desired movement. During this process, the cerebellum is constantly learning. It receives information fed back from the brain and from muscle movements, and stores the information needed for successful coordination.
Correct coordination is achieved step by step. When the cerebellum has correctly stored the coordination requirements, you have mastered the skill. At that point, the brain needs only to issue the command to begin the movement; the cerebellum can automatically issue coordination commands, causing the various muscle groups to cooperate and move together, thereby completing the movement smoothly. Once the cerebellum has learned to coordinate a skill, the brain is freed from the busy task of coordinating movement. Practice makes perfect: the “cleverness” lies in the cerebellum’s having learned the coordination required by the skill.
The cerebellar cortex has only two types of incoming nerve fibers: one type is mossy fibers, and the other is climbing fibers. The former are mainly connected with receptors and can provide information about the actual circumstances of various movements. The latter mainly transmit signals from the brain; when performing a practiced movement, relatively few impulses enter through the climbing fibers. How does the cerebellar cortex learn to coordinate movement? Control-theory research has offered a reasonable explanation of the cerebellum’s learning process: the cerebellum operates according to the manner of a perceptron. A perceptron is an artificial device modeled on visual information processing; through instruction by a teacher, it can learn to distinguish different patterns. The cerebellum is a special perceptron, while the brain is the cerebellum’s teacher. We will give a brief introduction to perceptrons in Section Seven. Recent experiments have shown that the cerebellum also influences processes of the internal environment, such as vasomotor activity.
The nervous system is composed of several central and peripheral neural structures. It is an integrated, mutually coordinated whole in which the various parts cooperate, with the cerebrum as the center, analyzing various internal and external signals while also issuing control signals that govern the body’s activities, enabling the organism to complete smoothly the various processes of life. Labels include: cerebrum, hypothalamus, thalamus, cerebellum, brainstem, spinal cord, exteroceptors, interoceptors, muscles, and glands.
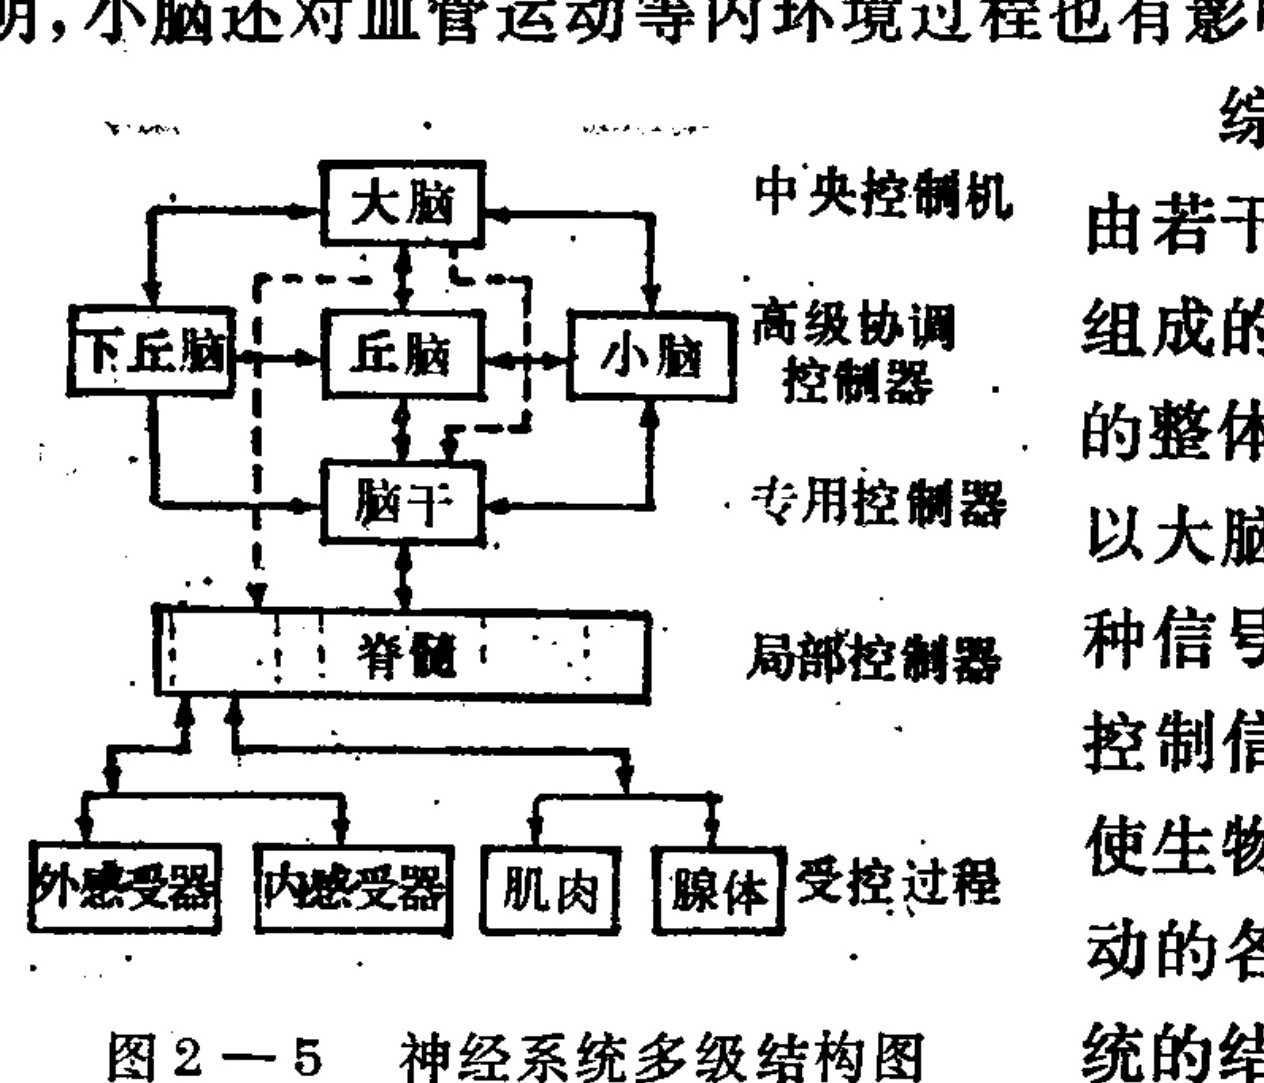
Figure 2–5 Diagram of the nervous system’s multilevel structure
Translated labels: Cerebrum; Hypothalamus; Thalamus; Cerebellum; Brainstem; Spinal Cord; External Receptors; Internal Receptors; Muscles; Glands; Central Controller; High-level Coordinator; Specialized Controller; Local Controller
According to the structure of the nervous system and the functions of its various parts, the function of the entire nervous system can be represented by the multilevel hierarchical structure in Figure 2–5. It is equivalent to a sophisticated multilevel computer system. It is especially important to point out that, unlike ordinary multilevel computer systems, it contains several specialized coordinating organs. These organs effectively organize information of the same type and control commands, enabling them to be used more fully. The cerebellum is the coordinating center for motor control; the thalamus is the coordinating center for incoming sensory information; and the hypothalamus is the coordinating center for control of the internal environment. Because the cerebellum’s coordination of movement is dynamic and the coordination requirements are numerous and cannot be determined in advance, its structure and volume are relatively large. The human cerebellum weighs approximately 130 grams. The hypothalamus coordinates the internal environment. The basic requirements of the internal environment are predictable, so they can be preset in the hereditary genes. The required reaction speed is not high, and this may be regarded as static coordination; therefore, the hypothalamus is smaller in structure and volume. In humans, the hypothalamus weighs only about 4 grams, far less than the cerebellum, but this arrangement is consistent with its functional requirements.
- Control of the Nervous System over the Internal Environment
The relative stability of the body’s internal environment is an important condition for health. A considerable part of qigong’s functions in strengthening the body and treating illness is achieved through improvement of the internal environment. Organs such as the lungs, heart, and blood vessels operate under the control of the neuroendocrine system. It is generally believed that the viscera are controlled by the autonomic (or vegetative) nervous system. The autonomic nervous system consists of the sympathetic and parasympathetic nervous systems. The actions of the sympathetic and parasympathetic nerves are generally antagonistic. Therefore, the nervous system can regulate visceral activity in both positive and negative directions.
The sympathetic nerves originate from the thoracic and lumbar segments of the spinal cord. After passing through sympathetic ganglia, where neurons are switched, they give rise to postganglionic sympathetic fibers that innervate the relevant organs and glands. Excitation of the sympathetic nerves puts the organism into a tense state: it accelerates breathing and heartbeat and increases sweat-gThe parasympathetic nerves controlling the viscera originate from the medulla oblongata. They are extremely fine nerve fibers that are difficult to trace and are called the vagus nerves. They can innervate the lungs and trachea, heart, liver, pancreas, esophagus, stomach, small intestine, large intestine, and so forth.
The mutually antagonistic control functions of the two kinds of nerves over the various visceral organs are shown in Table 2-1.Constricts the bronchi and promotes secretion by the mucosal glands. | | Digestive organs | Secretes thick, viscous saliva; inhibits intestinal movement; promotes sphincter contraction; inhibits gallbladder contraction. | Secretes thin saliva; promotes gastric secretion and intestinal movement; relaxes the sphincters; promotes gallbladder contraction. | | Urinary and reproductive organs | Contracts the bladder detrusor muscle; contracts the sphincters; constricts the blood vessels of the external genitalia. | Relaxes the bladder detrusor muscle and the sphincters; produces penile erection. | | Eye | Dilates the pupil and relaxes the ciliary muscle. | Constricts the pupil, contracts the ciliary muscle, and promotes tear-gland secretion. | | Skin | Contracts the arrector pili muscles and promotes sweat-gland secretion. | | | Pancreatic secretion | Promotes glycogen breakdown, promotes adrenaline secretion. | Promotes insulin secretion. |
In general, the activities of the sympathetic and parasympathetic centers are opposed to one another; that is,
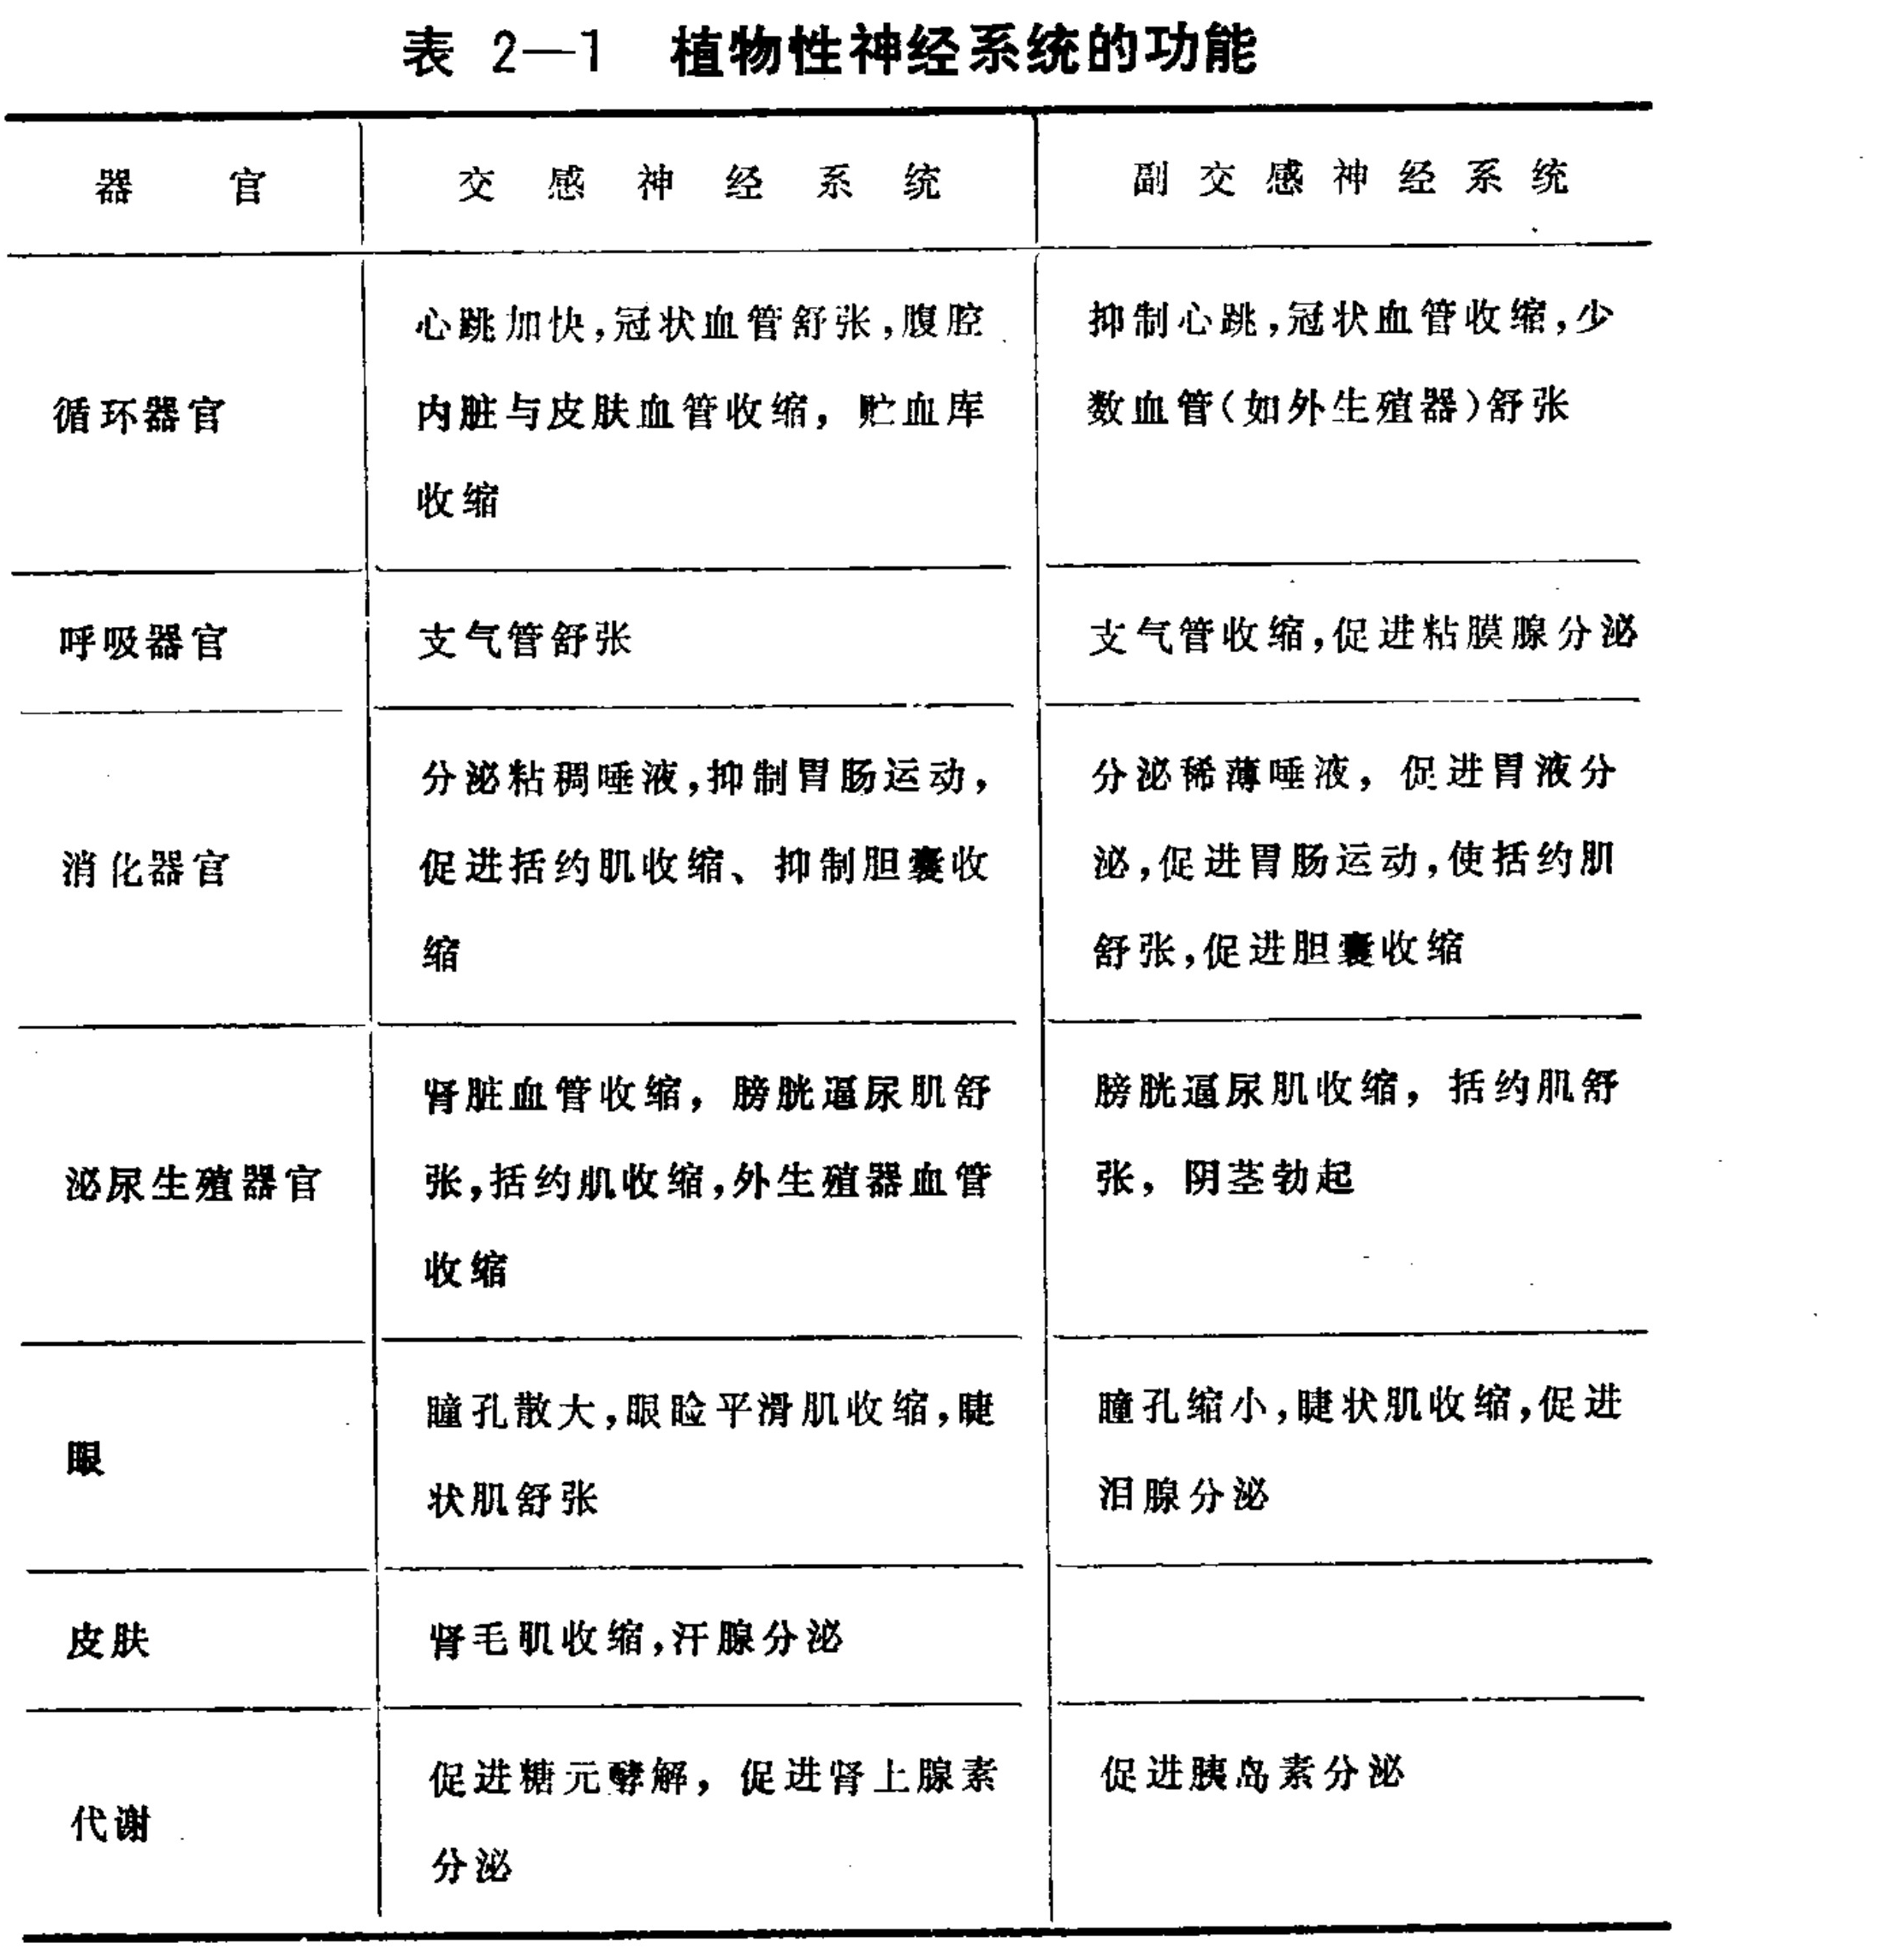
Table 2-1 Functions of the autonomic nervous system
Translated labels: Organ; Sympathetic Nervous System; Parasympathetic Nervous System; Circulatory Organs; Respiratory Organs; Digestive Organs; Urinary Reproductive Organs; Eyes; Skin; Metabolism
when sympathetic activity becomes relatively stronger, parasympathetic activity is often in a relatively weakened condition. Consequently, their control of the viscera appears coordinated and consistent. Sometimes the activities of the sympathetic and parasympathetic systems may both increase or both decrease, but one of the two must occupy the dominant position. Only in a few individual peripheral effectors are the actions of the sympathetic and parasympathetic nerves consistent. For example, both the sympathetic and parasympathetic nerves promote salivary-gland secretion. However, they differ in quality: the sympathetic nerves cause the saliva secreted to be viscous, whereas the parasympathetic nerves cause the saliva to be thin.
Under normal conditions, the autonomic nerves also continually send pulse signals to the effector organs, maintaining their sustained tone. If the vagus nerve leading to the heart is severed, heart rate increases, because the nerve impulses that inhibit cardiac activity have then been removed. If the sympathetic nerves innervating the heart are severed, the opposite effect occurs and heart rate decreases. The effect of the autonomic nerves on an effector may also be related to its functional state. For example, stimulating the sympathetic nerves can intensify the movements of a pregnant uterus, but inhibit the movements of a nonpregnant uterus. Likewise, if the gastric pylorus is originally in a contracted state, stimulating the vagus nerve may cause it to relax. Conversely, if the gastric pylorus is originally in a relaxed state, stimulating the vagus nerve instead causes contraction.
The modes of activity of the sympathetic and parasympathetic systems also differ. The activity of the sympathetic system is often not confined to an individual nerve and the organ it innervates; it frequently excites or inhibits almost all the organs it innervates simultaneously. For example, when an excitatory response occurs in the sympathetic system, in addition to enhanced cardiovascular function there are a series of accompanying responses, including bronchial dilation, inhibition of gastrointestinal activity, and pupil dilation. Therefore, the sympathetic nervous system may be regarded as acting as a whole. Its principal function is to enable the organism to adapt to rapid changes in the environment. When the environment changes drastically, the sympathetic nervous system can mobilize the potential of many relevant organs to deal with the sudden change. During strenuous muscular exercise, blood loss, suffocation, and similar situations, the organism exhibits accelerated heart rate, constriction of the cutaneous and visceral blood vessels, an increased red-blood-cell count, bronchial dilation, accelerated breakdown of liver glycogen, and a rise in blood-glucose concentration. These phenomena are all results of increased sympathetic activity. After the sympathetic nerves are removed, an animal can still survive well in a calm, safe environment; its body movement, growth, digestion, reproduction, and other functions show no obvious changes. However, during strenuous exercise, it cannot raise its blood-glucose level, nor does its red-blood-cell count increase; consequently, its ability to tolerate sudden changes is greatly reduced. Although the activity of the sympathetic nervous system is extensive, it also has relative selectivity. For example, when warming stimulation of the hypothalamus elicits a thermoregulatory response, sympathetic activity in the nerves supplying the cutaneous blood vessels weakens, thereby increasing cutaneous blood flow and strengthening heat dissipation. At the same time, sympathetic activity in the nerves supplying the viscera increases, reducing blood flow through the viscera to meet the need created by the increased cutaneous blood flow.
The activity of the parasympathetic nervous system is generally more localized. The functions of the system as a whole mainly concern protecting the organism, conserving energy, promoting digestion and absorption, and strengthening excretion and reproductive functions. An increase in parasympathetic activity can cause different organs to change state under different circumstances. For example, in a quiet situation it can inhibit cardiac activity, thereby reducing the organism’s energy consumption. After a meal, it can strengthen digestive function, promote the absorption of nutrients, and provide the organism with a full replenishment of matter and energy. Likewise, when the eyes are exposed to strong light, parasympathetic activity constricts the pupils, preventing strong light from injuring the eyes. These examples all demonstrate the protective effect of the parasympathetic system on the organism.
During qigong practice, increased secretion of fluid in the mouth, moistening of the eyes, slight sweating, and accelerated gastrointestinal peristalsis are generally considered normal and beneficial phenomena. This indicates that, in the ordinary qigong state, the parasympathetic nervous system is in the dominant position. Some experiments have also shown that qigong training may strengthen the speed and capacity with which the sympathetic nervous system responds to environmental changes.
The activities of both the sympathetic and parasympathetic systems are controlled by nerve centers at all levels. The sympathetic nerves and part of the parasympathetic nerves originate in the spinal cord. Therefore, the spinal cord is the primary center for visceral reflexes. In animals whose spinal cords have been transected below the fifth thoracic segment, after the shock period has passed, blood pressure can rise to a certain level, and the blood vessels can maintain a certain tone, keeping peripheral vascular resistance at a certain value. In patients with high spinal-cord transection, after the shock has passed, recovery of the vascular-tone reflex, sweating reflex, urination reflex, and defecation reflex has likewise been observed. These conditions indicate that the spinal cord can complete the basic activities of these reflexes. However, this reflex regulation is elementary and cannot adapt to relatively rapid changes in circumstances. For example, when a patient changes from a supine position to a standing position, the patient feels dizzy because the ability of the postural blood-pressure reflex is relatively poor.
The medulla oblongata is an important center of the autonomic nervous system. The autonomic nerve fibers arising from it innervate all the glands of the head, as well as the bronchi, heart, larynx, esophagus, stomach, pancreas, liver, and small intestine. In the reticular formation of the brainstem there are many neurons related to visceral activity, and they can regulate the autonomic functions transmitted from the spinal cord. At the level of the medulla, the regulatory control of several vital activities (such as circulation and respiration) can already be completed. The anterior-lateral and posterior reticular formations of the medulla constitute the cardiovascular centers. The inspiratory center is located in the ventromedial reticular formation of the medulla, while the expiratory center is located in its dorsomedial reticular formation.
During qigong, changes in skin potential or resistance can be observed. Sympathetic activity also causes a galvanic skin response; the galvanic skin response generally refers to reflexive changes in skin resistance or potential. It is usually believed that this change is closely related to the activity of the sweat glands, but its essential nature is not yet completely clear. In humans, the galvanic skin response is manifested mainly in the palms of the hands and feet, and its efferent nerves are sympathetic nerves. Thus, the galvanic skin response is a sensitive indicator of sympathetic activity. However, emotional reactions, as well as any stimulus capable of eliciting sympathetic activity, can cause a galvanic skin response. The reticular formation of the midbrain mainly strengthens the activity of sympathetic neurons in the spinal cord, thereby strengthening the galvanic skin response; the reticular formation of the medulla can both strengthen and inhibit the activity of spinal sympathetic neurons, and therefore can both strengthen and inhibit the galvanic skin response.
The hypothalamus is a higher-level center for regulating visceral activity. It has close structural and functional connections with the reticular formation of the brainstem. It coordinates visceral activity with other physiological activities, regulating physiological processes related to the activity of the organism as a whole, including body temperature, nutrient intake, and water balance. Taking thermoregulation as an example, many visceral organs must act in coordination for it to be completed. When the environmental temperature rises, for example, increased heat-dissipation measures are required, and therefore activities such as faster breathing, dilation of the cutaneous blood vessels, and sweat-gland secretion are needed. These activities are completed under the control of the hypothalamus. There is a heat-dissipation center in the anterior part of the hypothalamus and heat-production and heat-conservation centers in the posterior part. There may be reciprocal inhibition between the two. They work together to ensure the relative stability of body temperature.
The limbic system regulates autonomic reactions, but its influence is very complex. For example, stimulating different parts of the limbic forebrain can cause blood pressure to rise or fall, respiration to accelerate or be inhibited, gastrointestinal activity to strengthen or weaken, and the pupils to constrict or
…enlargement, and so on. These circumstances indicate that the functions of the limbic system and the primary centers are different. The functions of the primary centers are relatively limited, and their responses relatively simple. The limbic system, which regulates many primary centers, mainly promotes or inhibits the various primary centers. Its activity therefore manifests relatively complex responses. Some researchers believe that the limbic system can be divided into two functional categories. The first consists of responses that maintain the survival of the individual; the second consists of responses that maintain the survival of the species. The former is mainly associated with the amygdala and its related structures. The latter is mainly a function of the septal area and its related structures.
The autonomic nervous system is generally regarded as being outside conscious control. However, the cerebral cortex has a clear regulatory effect on visceral activity. The cerebral cortex has an inhibitory regulatory effect on the activity of the hypothalamus. For example, when an animal is transected at the level of the diencephalon, it often exhibits a series of phenomena involving excessive excitation of the sympathetic nervous system, together with baring its teeth and clawing about; this is therefore called sham rage. This shows that, under normal circumstances, hypothalamic activity is inhibited by the cerebral cortex, preventing sham rage from appearing. In animal experiments, electrical stimulation of certain regions of the neocortex can also elicit changes in visceral activity. Stimulating a particular site in area 4 on the lateral surface of the cerebral cortex produces changes in respiration and vasomotor activity; stimulating a particular site in area 4 on the medial surface produces changes in movement of the rectum and bladder; and stimulating the base of area 4 produces changes in movement of the digestive tract and salivary secretion. Stimulation of areas 8 and 19, among others, can produce pupillary responses. Stimulating a particular site in area 6 can produce piloerection and sweating, and can cause vasoconstrictor responses in the blood vessels of the upper and lower limbs. Moreover, the regions that produce vascular responses in the upper or lower limbs exactly correspond to the somatic motor representation areas of the upper or lower limbs. This shows that the cerebral cortex can control visceral activity, and that its regional distribution has certain correspondences with the distribution of the body’s motor representation areas.
In addition, the frontal lobe of the cerebral cortex is the most recently developed part of the brain, accounting for approximately one quarter of the volume of the human cerebral hemispheres. It plays an important role in regulating complex bodily activities. It also has highly developed efferent fibers and extensive connections with the brainstem, hypothalamus, thalamus, limbic system, and other regions of the cerebral cortex. Consequently, a person’s conscious activity can also act on the visceral organs through the frontal lobe, and then through the hypothalamus, limbic system, and the cerebral-cortex regions described above. Some experiments suggest that the frontal lobe of the cerebral cortex may play an important role during qigong practice.
IV. Processing of Sensory Information
Human beings understand the objective world through sensory organs such as the eyes, ears, tongue, and body. The nervous system is the material basis of sensory functions. Different sensations transmit different kinds of information about the external environment to the brain through different sensory systems; sensations and perceptions are produced in the cerebral cortex, and the brain then analyzes them to understand the world. The main sensory categories of the human body are vision, hearing, smell, taste, and somatic sensation. Vision is the most refined of the human sensory systems. The principles and process of human sensory-information processing will be explained below using the processing of visual information as an example.
Each kind of sensation has specialized receptors that respond to particular stimuli. They convert the corresponding stimuli into neural electrical impulses, which are transmitted to the central nervous system through nerve fibers. The frequency of the pulses elicited by a stimulus generally has a logarithmic relationship with stimulus intensity; that is, stimulus intensity is encoded by the inverse logarithm of frequency. Normally, when a receptor receives continuous stimulation of unchanged intensity, the neural pulses it elicits gradually become fewer. This phenomenon is called adaptation. It differs from fatigue: once the stimulation stops, the receptor soon recovers its original state. The speed of adaptation also differs among sensations. Touch adapts very quickly, for example, whereas receptors for deep sensation adapt very slowly. Different types of sensation are transmitted through different nerve fibers; in other words, different sensory modalities are encoded by fibers at different locations. This is spatial coding.
The receptor organ of the visual system is the retina. The retina is a membranous structure 0.1 to 0.5 millimeters thick, composed of more than 100 million cells. It converts incoming light signals into neural electrical signals and then transmits them to the central nervous system. The retina itself has a complex structure, which will not be described in detail here. Its first layer, which directly interacts with light, consists of two types of visual cells. The photosensitive layer of ordinary photographic film is uniformly distributed, whereas the retina is different: its cells are distributed very unevenly. The 110 to 125 million rod cells are mainly distributed around the periphery of the retina. There are approximately 6.5 million cone cells, concentrated in the central part of the retina. Rod cells are highly sensitive to light and function in weak light. Cone cells are less sensitive to light, but some are sensitive to different colors; it is the cone cells that enable us to perceive the richly colored world. In the center of the retina there is a depressed and thinner region with an external diameter of approximately 1.5 millimeters, called the fovea or macula. The macula is the region of the retina with the highest resolution.
Under ordinary circumstances, movements of the eyeball cause the image to be projected onto the macula. The retinal neural signals are transmitted upward through retinal ganglion cells and the optic nerve to the lateral geniculate body of the thalamus. Each neuron has a particular receptive field. A receptive field is the particular region of the retina in which light stimulation causes a cell to respond. Ganglion-cell receptive fields are generally circular. There are two types: on-center and off-center receptive fields. In an on-center receptive field, light stimulation of the center excites the corresponding ganglion cell, whereas stimulation of the surrounding ring inhibits it. An off-center receptive field is the opposite: stimulation of its center inhibits the cell, while stimulation of the surrounding ring excites the ganglion cell. This shows that the cells of the retina interact with one another during information transmission and processing rather than functioning in isolation.
The nerve impulses of the ganglion cells are transmitted by approximately one million optic-nerve fibers to the lateral geniculate body, and then reach area 17 of the cerebral cortex, after which they pass to areas 18 and 19 for further processing. Cells of the lateral geniculate body and the cerebral cortex also have corresponding receptive fields. The receptive fields of cells in the lateral geniculate body are likewise concentric, with an antagonistic relationship between the center and the surrounding area. Those of the cerebral cortex, however, have complex shapes. Adjacent cells in the ganglion-cell and lateral-geniculate layers exhibit mutual inhibition: excitation of one cell can reduce the excitation of surrounding cells through its axon. This is called the lateral-inhibition effect. It emphasizes the borders of an image. The fact that people are more sensitive to the edges of objects is due to this effect.
It has now been discovered that, in the occipital lobe of the cerebral cortex, some cells become excited only when an object reflects light at a particular location on the retina. Some respond only when a corner appears at a particular retinal location, while others respond only to an object moving in a particular direction. These cells can therefore be divided into simple cells, complex cells, and hypercomplex cells. In other words, each cell in the occipital region of the cerebral cortex reflects information about only one aspect of an objective thing and can be regarded as a feature-extraction device.
Thus, just as people obtain nourishment by first digesting and breaking food down into simple substances such as amino acids and then combining them into the substances needed by the human body, the brain breaks down the original information from the external world into a number of features and then synthesizes those features into an understanding of the objective world. The multilevel structure of information transmission and processing in the visual system is shown in Figure 2-6.
Other sensory modalities also process information in a similar way. There is clear interaction among the various senses. When you concentrate on listening quietly, you may be unable to distinguish shapes. Different sensory modalities constrain one another and thereby compress secondary information. It is generally estimated that the information entering the human system from all the receptors reaches approximately 10⁹ bits per second, whereas the human capacity for “conscious information processing” is only about 10² bits per second; the difference between the two is enormous. There may be many methods of information compression. The mutual inhibition of different sensory modalities through centrifugal feedback control may be one of the most important.
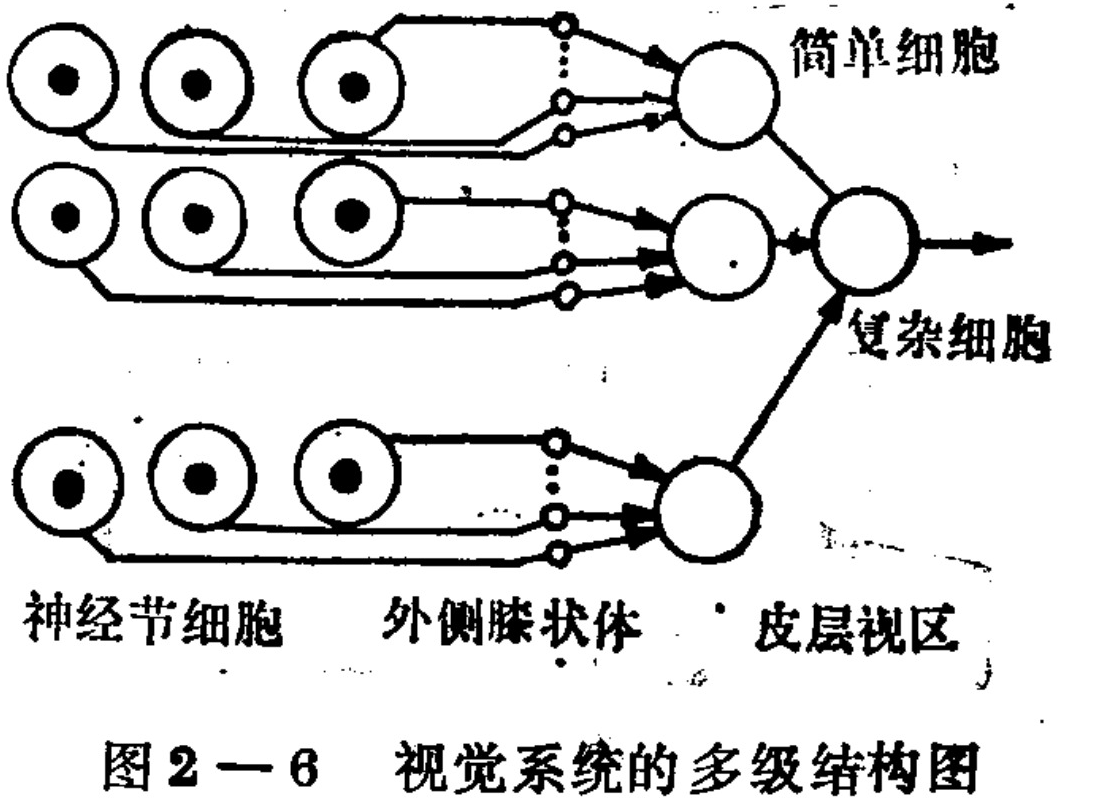
Figure 2-6: Multilevel structure diagram of the visual system.
Translated labels: Ganglion Cells; Lateral Geniculate Body; Cortical Visual Area; Simple Cell; Complex Cell
In neurophysiological research, it has been found that stimulating the centrifugal fibers of the cochlea can reduce auditory-nerve activity, and that stimulating the medial geniculate body can reduce the response of the contralateral cochlear nucleus. Moreover, visual attention can eliminate the response of the cochlear nucleus to sound. Prolonged sound stimulation causes adaptation and can also reduce the activity of the cochlear nucleus (cochlear-nucleus cells correspond to hearing as ganglion cells correspond to vision). Other sensory modalities show similar conditions.
This inhibition produced through centrifugal fibers—nerve fibers extending from the central nervous system to lower levels or the periphery—is called centrifugal control. The interaction among different modalities may be achieved through descending inhibition via the centrifugal pathways, thereby reducing the flow of information entering the central nervous system. The reticular formation of the brainstem may play an important role in this centrifugal control. Sensory centrifugal control can be represented as shown in Figure 2-7. The figure assumes that three different sensory modalities, 1, 2, and 3, simultaneously transmit information from their receptors. After the information reaches higher centers and undergoes analysis and synthesis, modality 1 is determined to be the most important
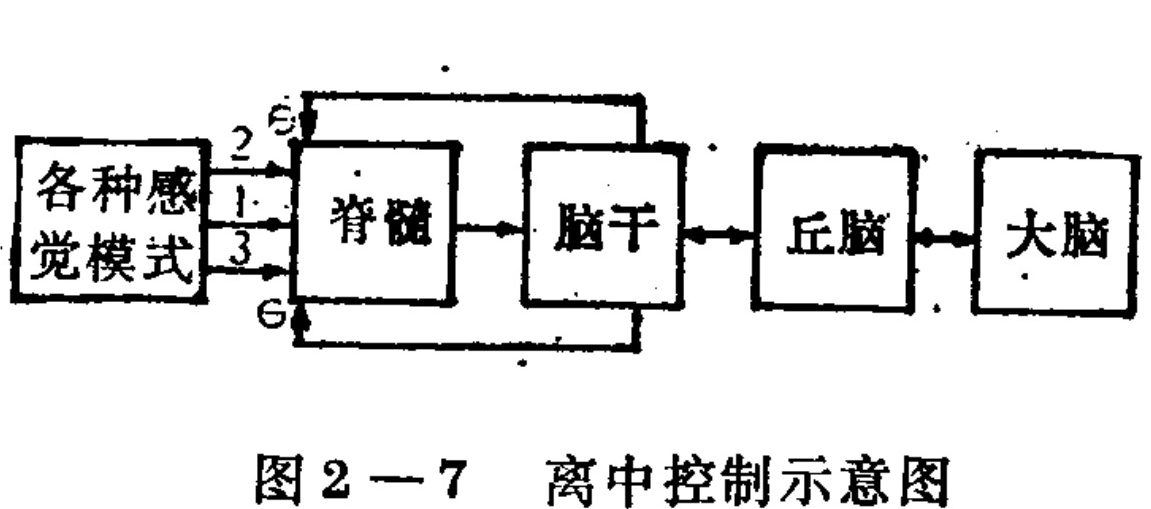
Figure 2-7 Schematic diagram of decentralized control
Translated labels: Various sensory patterns; Spinal cord; Brainstem; Thalamus; Cerebral cortex
information. Thus, the descending inhibitory fibers issuing from the brainstem can produce a negative-feedback effect, weakening or even blocking the transmission of the information from Patterns 2 and 3 upward, so that very little information entering through Pathways 2 and 3—or none at all—can reach the higher centers. This reduces the flow of information entering the pain center, and the total excitation of the neural centers is also reduced, with a corresponding reduction in energy consumption. The brain perceives only the existence of Pattern 1.
Judging from the practice of qigong, during qigong practice the sensations that are ordinarily relatively sensitive—such as vision, hearing, and touch—may, under normal circumstances, be in a relatively low state of excitation, while sensations that are usually difficult to detect, such as deep sensation and visceral sensation, are in a relatively sensitive state. During practice, sensations such as heat and numbness, which are normally difficult to notice, may arise in the deeper parts of the body, and sensations may also migrate or travel through the body. Unfortunately, current neurophysiology
and anatomy generally focus on the processing of information from vision, hearing, touch, and other senses, while very little is known about the structures and processes involved in processing deep and visceral sensory information. Here we can only make some conjectures based on general principles of sensory-information processing. It may be supposed that there is a mutual inhibitory relationship between surface and deep bodily sensation, and that there is also mutual inhibition between fine visual and auditory sensation and relatively vague visceral sensation. When fine and surface sensations are inhibited, deep and visceral sensations are in a sensitive state. The qigong process requires quiet and reduces the inflow of ordinary sensory information, which benefits the perception of visceral and other such sensations. In addition, we know that the postcentral gyrus of the cerebral cortex contains representative areas for surface sensation, while the precentral gyrus contains representative areas for somatic movement, as shown in Figure 2-8. The parts with especially sensitive sensation, such as the fingers and face, occupy relatively large volumes. It may be supposed that the deep tissues and viscera likewise have corresponding sensory and motor representation areas in the cerebral cortex, although they occupy a smaller volume. Under ordinary conditions, because the senses inhibit one another, these sensations often cannot be perceived. In the qigong state, ordinary sensation is inhibited while deep and visceral sensation and movement become prominent. Deep and visceral sensations are consistently related to their movements. The neurons governing sensation and movement in the deep tissues and visceral organs become sensitive, facilitating the influence of subjective consciousness on visceral function and helping adjust disordered or abnormal organ function for the prevention and treatment of disease. The deep warmth, distension, and numbness experienced during practice may help establish connections among the deep tissues, the viscera, and the cerebral cortex, thereby improving the condition of the viscera and deep tissues.
—Primary motor area: contralateral upper and lower limbs
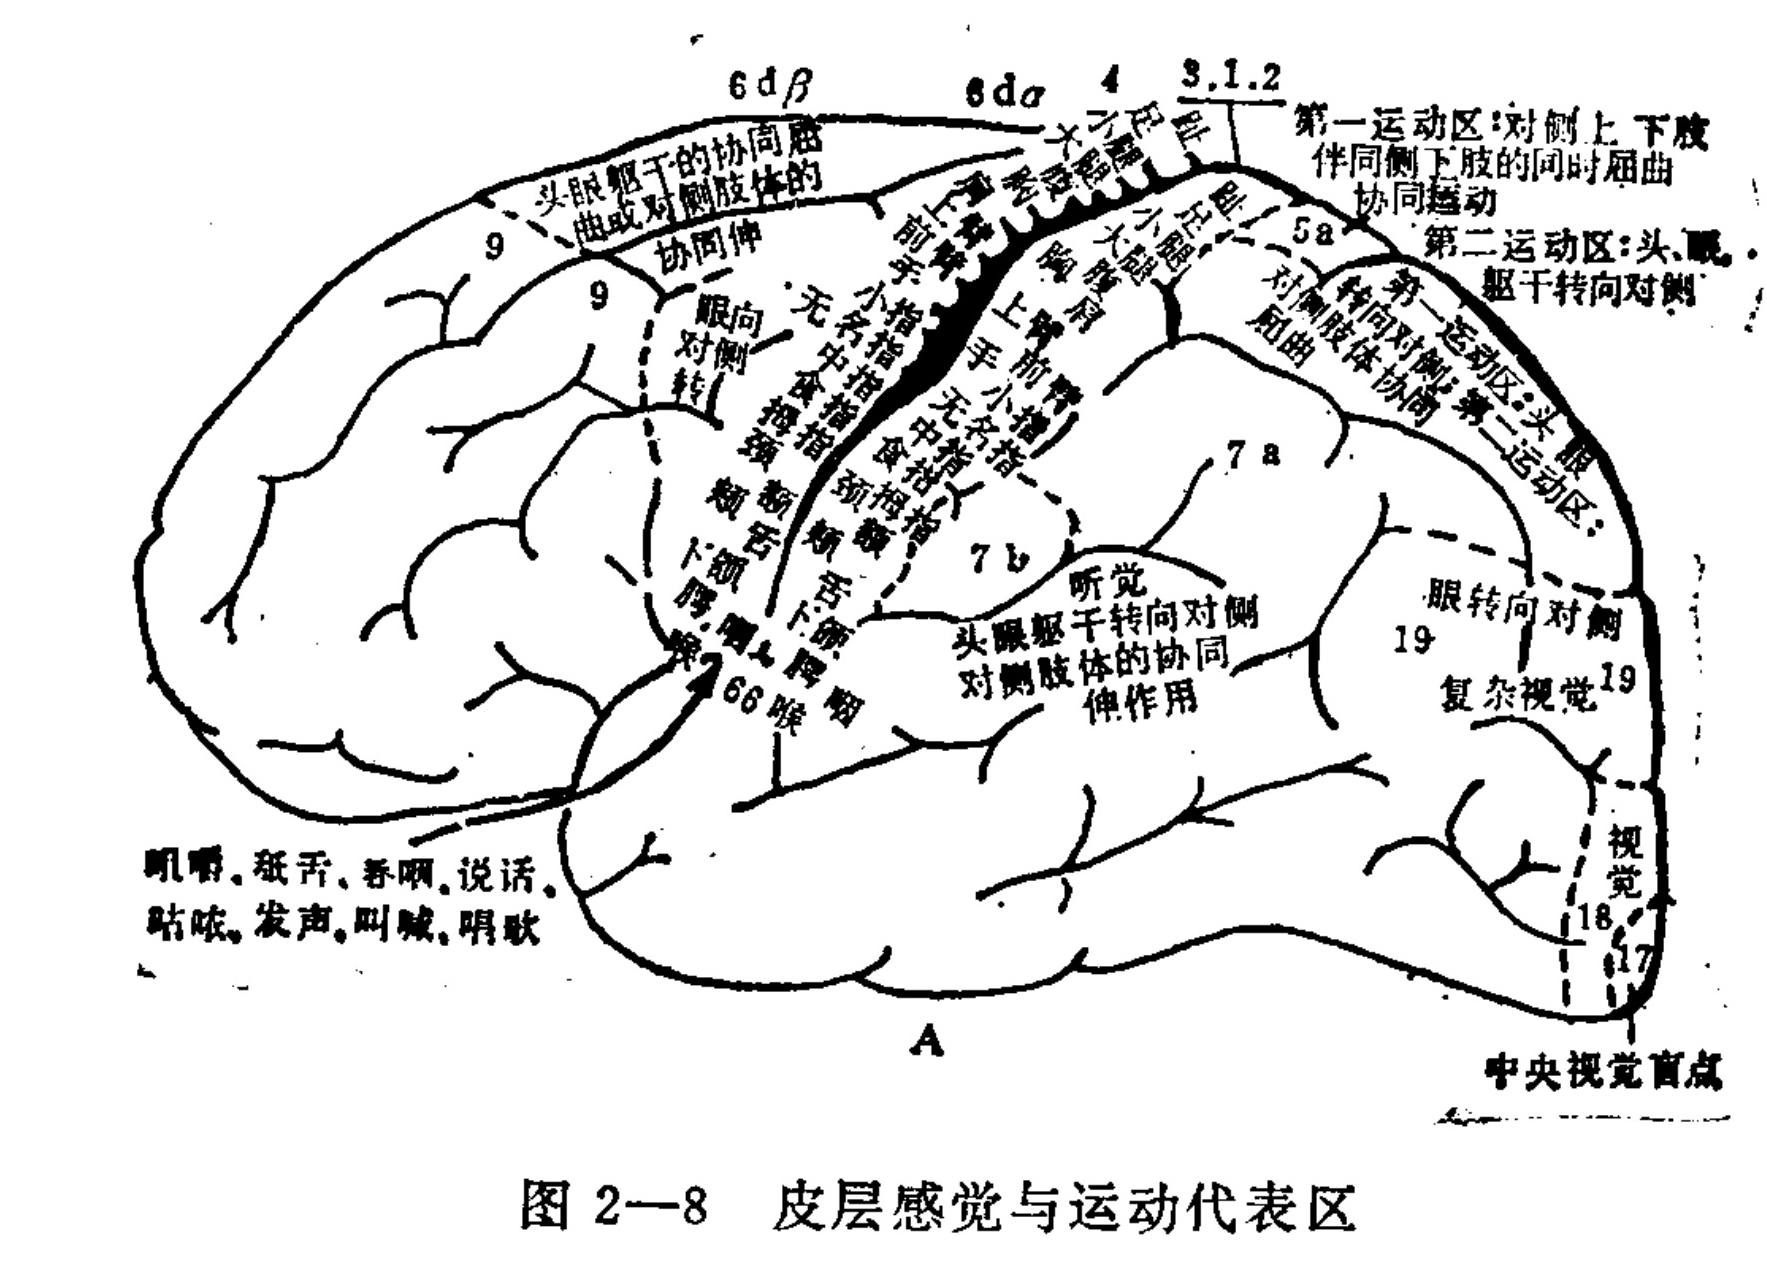
Figure 2-8 Representative sensory and motor areas of the cortexntly no definitive conclusion concerning the physiological mechanisms of emotion. Several different theories have been proposed, such as the thalamic theory of emotion, which emphasizes the release of thalamic inhibition as the mechanism producing emotion; the activation theory of emotion, which emphasizes the role of ascending reticular activation in the occurrence of emotion; and the limbic-system theory of emotion, which emphasizes the roles of structures such as the hypothalamus, cingulate gyrus, and hippocampus in emotion, and so on. This situation reflects the complexity of the physiological mechanisms of emotion. At present, it is generally believed that the coordinated activity of the cerebral cortex and subcortical structures forms the neurophysiological basis of emotion, with the limbic system occupying a particularly important position. The cerebral cortex
Translated labels: Primary motor area: contralateral upper and lower limbs; Secondary motor area: head, eyes, trunk turning to contralateral side; Auditory; Head, eyes, trunk turning to contralateral side; synergistic extension of contralateral limbs; Eye turns to contralateral side; Complex vision; Vision; Central visual blind spot; Mastication, protruding tongue, swallowing, speaking, coughing, vocalizing, shouting, singing
plays a regulatory and modulatory role. As a result of activity in the higher centers of the nervous system, different emotions produce a series of physiological responses, including various visceral responses. The physiological responses caused by emotion are closely related to activity in the autonomic nervous system, especially the activity of the sympathetic nervous system. Emotional tension drives blood from the viscera and skin into the muscles, thereby making the muscles more effective; the increase in blood sugar ensures the energy supply needed by the brain and body, putting the organism in a state of full readiness to cope with an emergency. The pleasant emotion caused by food stimulation can increase the secretion of digestive juices and strengthen gastrointestinal movement. Thus, emotion may be an integrated regulatory process formed by the organism during evolution for adaptation to the environment. However, this regulatory process does not necessarily always operate correctly. Excessive emotional reactions and unstable emotional fluctuations often have harmful effects on the organism. People differ in their emotional activity and in the strength of their emotional reactions, and these reactions can be modulated by the cerebral cortex. The qigong process can affect emotional reactions through the cerebral cortex and subcortical structures. Some of qigong’s effects in strengthening the body and treating disease may result from its stabilizing emotional activity.
Animal experiments have found that electrical stimulation of certain parts of the central nervous system can cause animals to produce “pleasant” or “unpleasant” reactions. The sites whose electrical stimulation produces a “pleasant” reaction are called “pleasure centers.” Excitation of the pleasure centers generally has beneficial effects on the organism. In operant-conditioning experiments with animals, when the stimulating electrode is placed in the septal area or medial forebrain, a rat may press a lever at a rate of about 2,000 times per hour, while a monkey may press it at a rate of about 8,000 times per hour. In experiments with white rats, a rat may continue pressing the lever in a highly excited state until it collapses from exhaustion, yet immediately after awakening it goes back to pressing the lever. An animal may even ignore the end containing food while in a severely abnormal or semi-starved state, preferring to choose self-stimulation by pressing the lever. In operant-conditioning experiments involving the viscera, electrical stimulation and brain structures that stimulate the pleasure center can also be used as a reward, with successful results. These phenomena indicate that excitation of certain sites in the brain makes animals feel comfortable. When conditions permit, they do their utmost to excite these structures in order to obtain pleasure. It has been found that the brain structures in which electrical stimulation can make animals feel pleasure are extremely widespread, accounting for approximately one-third of the entire brain. Sites at which electrical stimulation causes unpleasantness account for approximately five percent. The use of electrical stimulation of the central nervous system to relieve patients’ suffering has entered clinical practice. In patients with psychiatric illness who require surgery, experiments involving intracranial electrical stimulation in patients with epilepsy, tumors, or Parkinson’s syndrome have found that stimulation of the ventromedial frontal region, the hypothalamus, parts of the parietal lobe, the temporal lobe, and the upper midbrain can all produce emotional reactions. Patients feel relaxed, at ease, well, or somewhat sleepy. Some patients smile and experience mild euphoria, while some even laugh aloud. Other stimulation, however, can produce the opposite emotions, causing uneasiness, anxiety, tension, sadness or even anger, fear, or crying. At a distance of 0.5 to 1 centimeter from a stimulation point that produces pleasant emotion, electrical stimulation can sometimes elicit the opposite emotional reaction. Therefore, it is not easy to control. Intracranial electrical stimulation has also been tried in the treatment of certain diseases. For example, when patients with advanced cancer suffer severe pain, electrical stimulation of the pleasure center can be used to reduce their pain. It can also be used to treat patients with mental depression.
During qigong exercise, it is generally considered a sign of success if, after completing the exercise, one feels comfortable throughout the body, full of energy, and clear-headed. Qigong may stimulate certain pleasure centers or increase the excitability of some pleasure centers. The pleasure centers not only make people feel good, but may also improve the condition of the organism as a whole.
People live in a particular environment, where various stimuli constantly act upon the organism. To adapt to changes in the environment, the organism produces corresponding responses to these stimuli. In human life, one encounters various unexpected stimuli, such as dangerous situations, heavy pressure at work, or misfortune affecting relatives and friends. Such stimuli can cause a state of tension in the organism, also called a stress response. The stress response includes changes in emotion, changes in visceral activity, and other reactions. In the autonomic nervous system, stress is mainly manifested as a relative predominance of sympathetic activity. Generally speaking, stress originally serves to place the organism in an emergency state and mobilize various factors within the body, helping it cope with an adverse environment. However, excessively intense stimuli can produce emotional tension, anxiety, or dejection, depression, and anger. The tense state of stress causes the heart rate to accelerate, blood pressure to rise, sweating, suppression of gastrointestinal activity, dilation of the pupils, contraction of the spleen with an increase in red blood cells in the blood, elevation of blood glucose, acceleration of respiration, and increased secretion by the adrenal medulla and adrenal cortex. A state of tension can cause rats to develop hypertension, arthritis, arteriosclerosis, and ulcers. Excessively strong stress is harmful to the health of the organism. This may be due to stress-induced dysfunction of adrenal-cortex hormones, while glucocorticoids can inhibit antibody formation. The formation of antibodies slows the regeneration of the tissues around a wound. Increasing evidence indicates that a tense state can cause suppression of immune mechanisms. Emotional repression and distress can promote the development of cancer, while the occurrence of cancer is also related to the condition of the organism’s immune mechanisms. Thus, tension can also lead to an increase in the incidence of cancer.
Experiments have shown that receiving some stressful stimulation early in life can give an individual a greater capacity to adapt to stressful stimulation in adulthood, reducing the psychological and physiological reactions caused by stress. Qigong exercise can also relieve the stress response. In observations comparing qigong practitioners with people who did not practice qigong while they performed a stressful task, the practitioners’ respiration, pulse, and catecholamines increased during the task, with no significant difference from those of the non-practitioners. After the stressful task, however, catecholamines returned to normal more quickly in the practitioners, indicating that qigong practice helps the organism recover from a state of stress.
VI. Conditioned Reflexes
People’s ability to use intention to bring themselves into a qigong state is not innate; it is gradually acquired through learning after birth. Therefore, understanding how the nervous system acquires new abilities through learning is important both to the theory and practice of qigong. In this section we will first discuss the formation of classical conditioned reflexes, which do not require conscious participation, and then discuss operant conditioned reflexes, which involve conscious activity. Conditioned reflexes enable people to acquire some new temporary abilities.
We begin at the level of animal behavior, observing changes in acquired behavior resulting from practice. Human beings possess some innate reflexes from birth. For example, immediately after birth an infant will suck the nipple; this occurs because the stimulus (the nipple) directly stimulates a receptor and elicits a reflex. This kind of reflex is called an unconditioned reflex. At the beginning of this century, Pavlov discovered that when a stimulus is close in time to an unconditioned stimulus and the two are repeatedly presented together, a conditioned reflex is formed. In other words, when only this stimulus appears, it can also elicit the reflex elicited by the unconditioned stimulus. The stimulus originally could not elicit the corresponding reflex; it is therefore also called a conditioned stimulus. Pavlov first used food as the unconditioned stimulus. It could elicit a salivary-secretion reflex. Dogs were used as experimental animals, with light or a bell serving as a neutral (conditioned) stimulus. When these neutral stimuli acted alone, they could not elicit salivation. But when food and the neutral stimulus were presented simultaneously, with the two stimuli acting together for 10 to 20 seconds, a large amount of saliva was elicited. After a bell (or light) and food had appeared together repeatedly, the bell (or light) alone could also elicit salivation, showing that a new reflex—the bell–salivation reflex—had been established. A conditioned reflex had thus been formed. The neutral stimulus thereby became the conditioned stimulus. However, when the conditioned stimulus (the bell or light) acts alone repeatedly and is no longer reinforced by food (the unconditioned stimulus), salivation decreases until it stops completely. This shows that a conditioned reflex is a temporary connection. Pavlov systematically investigated the laws governing conditioned-reflex activity. A conditioned reflex is formed on the basis of an unconditioned reflex, with the participation of the cerebral cortex. Conditioned reflexes also occur frequently in everyday human life. Events that occur simultaneously or close together in time are often also related to one another, enabling people, through practice, to respond rapidly when a beneficial or harmful stimulus appears—or even before it appears. In this way, conditioned reflexes are formed that benefit survival. Conditioned reflexes therefore improve human beings’ ability to adapt to the environment. In addition to responding to concrete external stimuli (such as food, odors, sounds, and light) and forming conditioned reflexes, human beings can also respond to abstract stimuli such as written language and speech and form conditioned reflexes. Conditioned reflexes are one of the basic forms of activity in the higher regions of the central nervous system. They are established through temporary connections in these higher regions. When a stimulus with a clearly defined and fixed response serves as the unconditioned stimulus, and a stimulus unrelated to that response serves as the conditioned stimulus, the conditioned reflex formed by the two stimuli appearing simultaneously or close together in time is called a classical conditioned reflex.
The American psychologist B. F. Skinner proposed another type of conditioned reflex, called an operant conditioned reflex. This kind of conditioned reflex is acquired through the consequences of the animal’s own activity (or operation), by which it learns to change its own response. It may be closer to learning in everyday life. To form an operant conditioned reflex, certain experimental conditions must be prepared for the animal. The experiment is usually conducted in the famous Skinner box.
A white rat is used as the experimental animal, and its operation is pressing a lever. A small steel rod serves as the lever; even slight pressure moves the lever downward and pushes the food hopper, causing a small pellet of food to fall into the food dish. The movement of the lever can be recorded by a pen point or stylus connected to it.
At the beginning of the experiment, the animal presses the lever by chance. But if one operation earns it food (that is, a reward), it increases the number of times it presses the lever. In classical conditioning, the timing of reinforcement (that is, the delivery of the reward or unconditioned stimulus) should coincide with or be close to the stimulus, whereas in operant conditioning reinforcement can be delivered at intervals. For example, food may be given only after the lever has been pressed several times. This method of reinforcement is closer to daily life, because encouragement does not necessarily need to occur every time. A reward received only a few times can also have a major effect. For example, in order to gain public recognition once, a scientist or artist may work doggedly for many years. The shorter the reinforcement interval, the more rapidly the established lever-pressing frequency increases—that is, the response speed increases. When the interval is very long, however, the response speed drops sharply. But once the reflex has been established, its extinction curve (that is, the curve showing the decline in lever-pressing frequency after the reward is removed) is flatter when it was established by interval reinforcement than when it was established by continuous reinforcement. In addition to rats, Skinner carried out similar experiments on other animals, such as pigeons, and even on human beings, obtaining similar results.
Operant conditioned reflexes are related to voluntary activity. They connect voluntary operations with obtaining rewards, enabling these actions to be completed purposefully. Similar classical or operant conditioned reflexes may also occur in human life from time to time. These reflexes generally benefit the organism’s adaptation to the environment and improve the function of the nervous system. But things are complex, and conditioned reflexes that are unfavorable to survival can sometimes also be formed. For example, after repeatedly failing or being injured while learning a skill, or after seeing someone else fail, a person may develop a fear response toward that skill: attempting the action immediately produces fear, making it impossible to learn the skill. Conditioned reflexes can also be established during qigong practice. Some are beneficial, such as becoming accustomed to entering a state of mental quiet in a particular environment. But unfavorable forms of reflex can also occur. For example, after some people experience a deviation during practice, a reflex may be formed that causes the deviation to recur. Because conditioned reflexes can undergo extinction, the reflex caused by such a deviation can also be
It was mentioned earlier that the autonomic nervous system is generally considered not to be under conscious control. In the late 1960s, the American psychologist Neal E. Miller, after studying the common laws of classical and operant conditioned reflexes, proposed that the two types of conditioned reflex were the same phenomenon expressed under different conditions. He showed that the methods used to establish operant conditioned reflexes could be used to make animals produce visceral responses that had previously been obtainable only through classical conditioned reflexes. Through experiments, he found that the responses of viscera and glands controlled by the autonomic nervous system could also be consciously changed by means of rewards. Some subtle, difficult-to-detect skeletal-muscle movements can change visceral activity as well. For example, a yoga disciple can control the activity of the thoracic diaphragm, increasing the pressure inside the chest and thereby greatly reducing venous return. To eliminate changes in visceral responses caused by somatic movement, Miller paralyzed the animals’ skeletal muscles with curare during the experiments. The animals remained conscious, and their visceral organs could still function normally. Because curare-paralyzed animals cannot breathe on their own, they had to breathe with a mechanical respirator. In these curarized animals, electrical stimulation of the brain’s “pleasure center” was used as a reward to train them to change their heart rate—that is, electrical stimulation was delivered when the heart rate increased or decreased. The results showed that within 90 minutes the animals’ heart rates could be increased or decreased by 20 percent, as shown in Figure 2-9.
The experiments described above also proved that the same reward method could elicit changes in visceral activity in the opposite direction.
500 450 Heart rate 400 350 Decrease experiment 300 0 30 60 90 (min) Training time
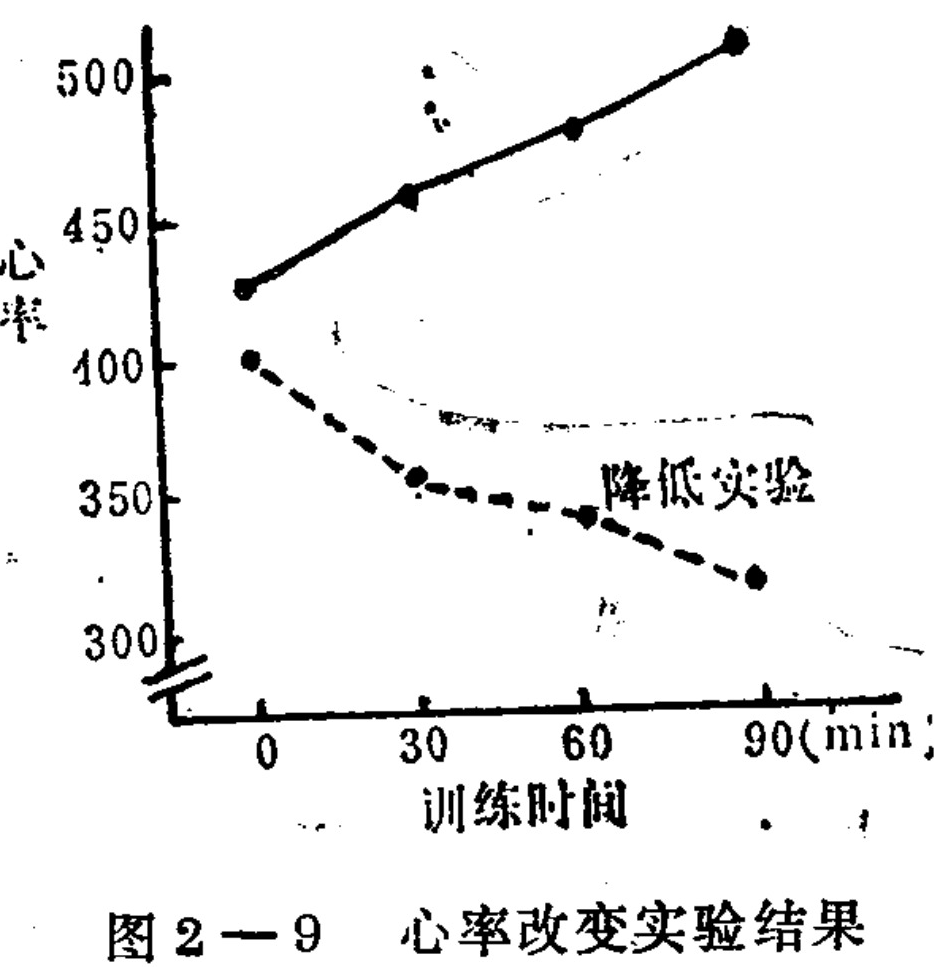
Figure 2-9 Results of the heart-rate change experiment
Translated labels: Heart Rate; Training Time; min; Lowering experiment
In addition to heart rate, Miller carried out other experiments involving changes in visceral responses. For example, through training he caused the blood vessels in one of a rat’s ears to dilate more obviously than those in the other ear. He also changed the rate of urine production in the kidneys, and so forth. In recent years, some experiments have shown that not only visceral activity but also higher nervous activity can be changed through operant conditioning. For example, the components of brain waves (EEG) can be changed.
Experiments have also shown that animals not subjected to curarization can form operant conditioned reflexes involving visceral activity. However, the speed and efficiency of formation are lower than in curarized animals. This may be because skeletal-muscle activity acts like noise; once it is eliminated, the animal can concentrate its attention on the subtle changes produced by the autonomic nervous system, making visceral activity more readily subject to conscious control. Human beings can also learn, through practice, to control their own
This activity is dirty, but its effect is often worse than the results achieved by animals. The regularity of visceral reflex activity revealed by operant conditioning demonstrates the rationality of requiring relaxation and stillness in qigong training: relaxation reduces the influence of skeletal-muscle activity and helps establish a connection between consciousness and the internal organs.
The fact that operant conditioning can alter visceral activity proves that the former view—that the autonomic nervous system is unaffected by consciousness—is incomplete. Through training or practice, people can learn to control their own internal organs.
7. Neural Network Models
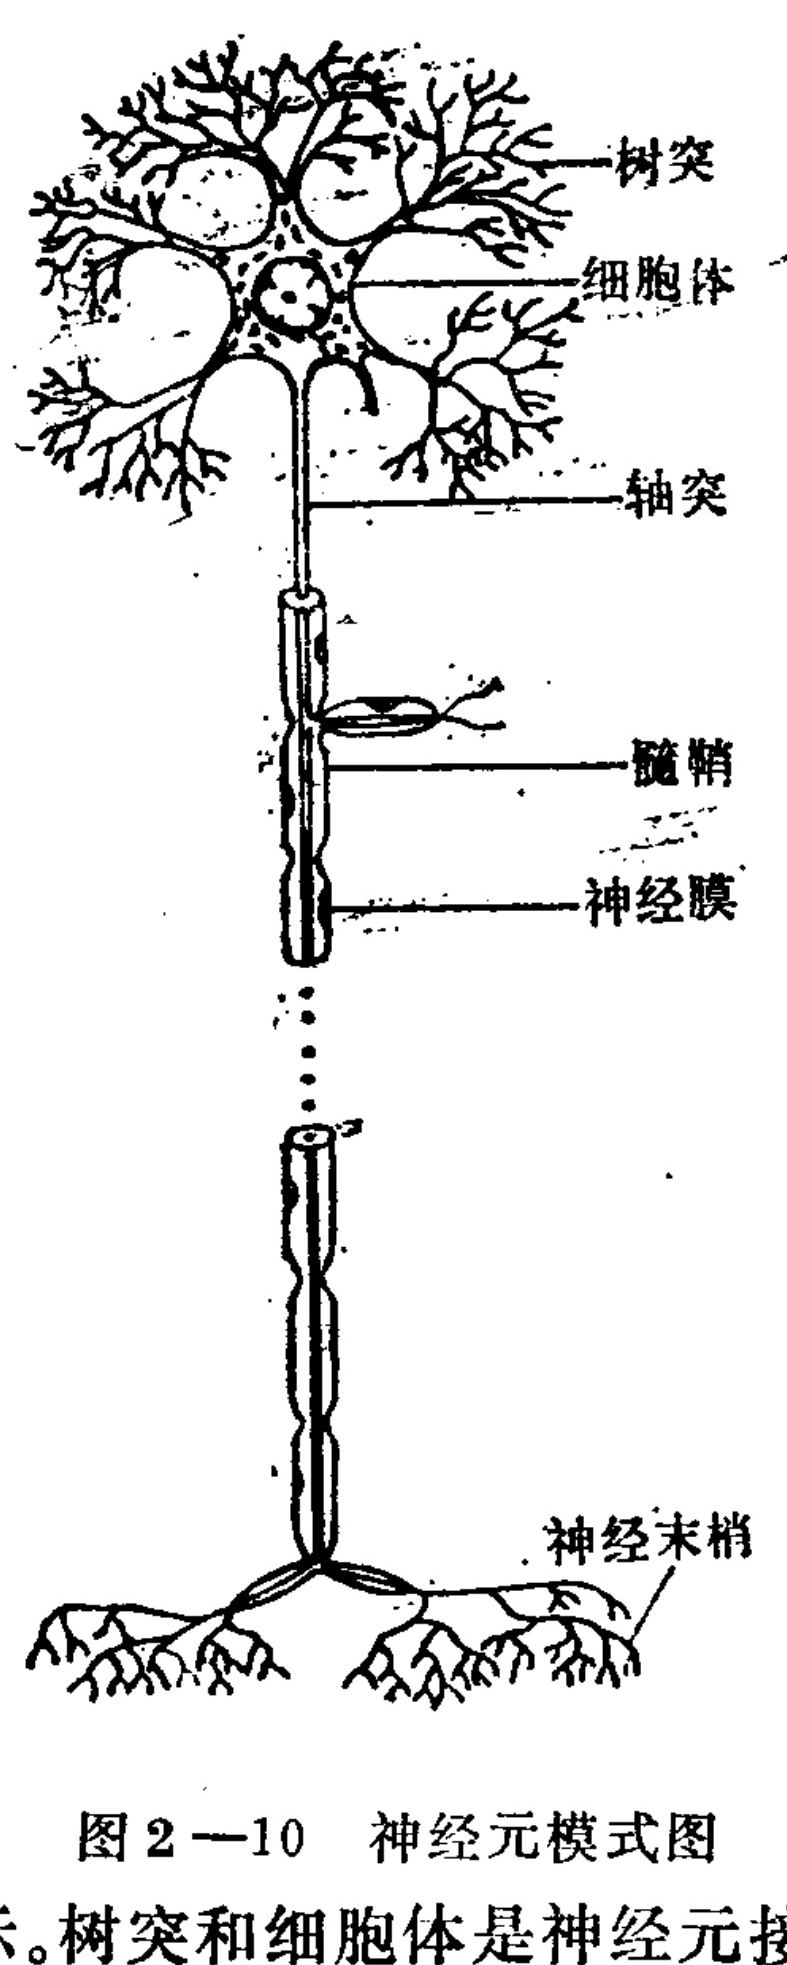
Figure 2–10. Neuron model
Translated labels: Dendrite; Cell body; Axon; Myelin sheath; Nerve membrane; Nerve ending
A typical neuron can be represented as shown in Figure 2–10. Dendrites and the cell body are the sites at which a neuron receives information, while the axon is the route by which information is transmitted outward.
42
To study the information-processing functions of the nervous system, cybernetics uses methods for constructing brain models. A brain model is a model— including mathematical and electronic models—that is constructed according to the principles of information processing in neurophysiology and neural science, has a structure similar to that of the brain, and can perform the brain’s information-processing functions. After a neural-network model has been established, the functions of the various parts of the nervous system in realizing brain functions can be investigated through analysis of the model, electronic-computer simulation, and other methods; the principles of information processing within the brain can be revealed; and, further, the brain model can serve as a prototype for designing new information-processing machines.
The basic structural and functional unit of the nervous system is the neuron (nerve cell). A neuron consists of a cell body, dendrites, and an axon.
Usually, each neuron can receive information transmitted by many other neurons, and can in turn send its output through branches of its axon to other neurons. A neuron has two basic states: excitation or rest (inhibition), the so-called “all-or-none” principle. Thus, mathematically, 0 or 1 can be used to represent the two basic states of a neuron. Information is transmitted along the axon in the form of electrical pulses; only pulsed electrical changes can propagate along the axon (which forms a nerve fiber).
The points at which neurons connect to one another are called synapses. When a nerve impulse reaches a synapse, it causes the nerve terminal to release a neurotransmitter. This biochemical substance changes the permeability of the postsynaptic cell membrane to ions and thereby changes the membrane potential. When the membrane potential reaches a certain value (the threshold), the cell suddenly becomes excited and produces a pulsed change in potential, transmitting the pulse through its axon to the next neuron. Thus, a neuron is an information-processing machine.
When information passes from one neuron to another, it undergoes a conversion from a digital quantity to a continuous quantity (the membrane potential), and is then integrated as a continuous quantity before being converted back into a digital quantity (the pulse); it also undergoes a nonlinear transformation at the threshold. Synapses from different sources can all contribute to the membrane potential and to the production of a pulse, but their contributions differ in magnitude. In general, the size of the contribution is represented by synaptic conductance. Therefore, a neuron can be said to perform temporal and spatial summation of its various inputs. A neuron is an information-processing unit with many inputs and one output (although that output can be transmitted to many places).
The nervous system is a network composed of neurons. The neural network within the brain has a definite structure, although its detailed structure is not yet sufficiently understood. Brain-model research is generally based on neurons and the networks formed by them.
In 1943, McCulloch and Pitts proposed a neuron model based on the characteristics of neurons. This marked the beginning of neural-model research. Their model, also called a formal neuron, is shown in Figure 2–11. It is a multiple-input, single-output component that can reflect the all-or-none property and the spatial-summation property of neurons. Inputs are of two types, excitatory and inhibitory, represented respectively by 0 and 1. When the numerical value of the excitatory inputs exceeds that of the inhibitory inputs by the threshold amount, the output is y = 1 (the neuron is excited); otherwise, y = 0 (it is not excited).
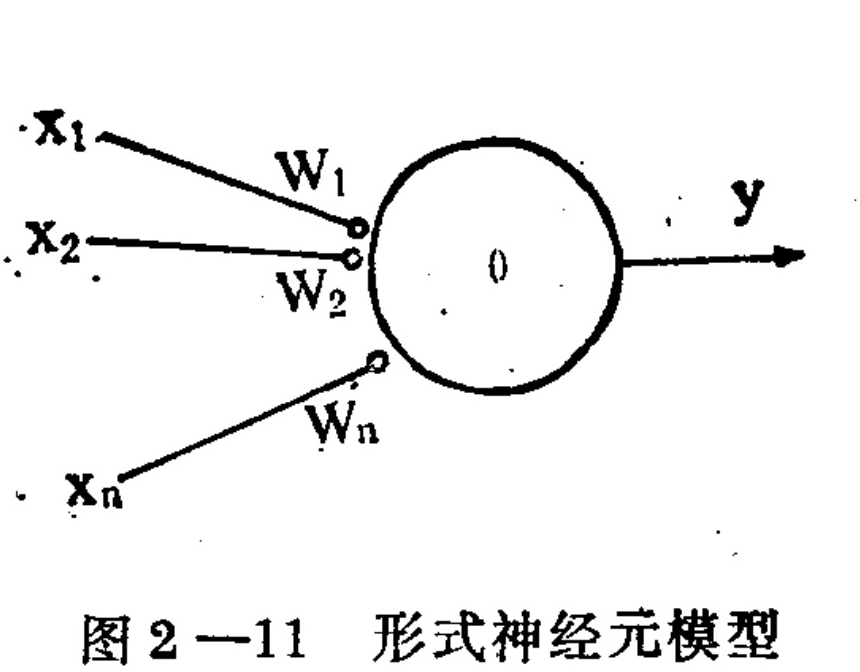
Figure 2–11. Formal neuron model
Translated labels: x1; x2; xn; w1; w2; wn; y; θ
To understand the brain’s information-processing functions, one must first clarify which quantities in neural activity contain information. From research on sensory-information processing, we know that the frequency of neuronal excitation is related to the intensity of sensation. In other words, the firing frequency of a neuron is the carrier of information. Since the brain is highly reliable and is a low-speed component (with a response below 1,000 Hz) yet can perform high-speed information processing (it is much faster than an electronic computer at image analysis), we can infer that parallel information transmission and processing occur within the brain. One item of information is transmitted through many parallel nerve fibers and may be represented by the excitation of multiple neurons. A hypothesis has now been proposed that the simultaneous excitation of a group of neurons constitutes the encoding of information in the brain; this hypothesis has been adopted by many brain-model studies.
The brain is also a system with the capacity for self-organization. In other words, through the input of sensory information, and under the impetus of that information, the brain changes its organizational connections, establishing within itself connections among sets of neurons corresponding to connections among objective things. In this way it reflects the objective world.
How the brain accomplishes such change or self-organization is not yet sufficiently clear, and various hypotheses have been proposed. Among them, the hypothesis that this occurs through synaptic plasticity—that synaptic conductance can change through use—is comparatively reasonable. There is already some neurophysiological and morphological evidence for synaptic plasticity. Studies of the nervous systems of invertebrates and of the brainstem and cerebellum of mammals have revealed changes in synaptic plasticity. However, the laws governing synaptic plasticity—under what conditions what kinds of changes occur—remain unresolved. Yet these laws are necessary for constructing a self-organizing brain model.
Some hypotheses with a certain factual basis have already been proposed. For example, Shimbel hypothesized that when the postsynaptic nerve cell is excited, its synaptic conductance increases. Eccles hypothesized that when the presynaptic nerve cell is excited, its synaptic conductance increases. The hypothesis most widely adopted is Hebb’s: when the presynaptic and postsynaptic nerve cells are excited simultaneously, synaptic conductance increases. These hypotheses, however, have not yet been directly proved experimentally. They can also be combined with one another to form different kinds of synaptic-plasticity models. Brindley divided them into three major categories comprising ten different forms of plasticity.
A network composed of formal neurons with variable synapses of the Shimbel type can implement classical conditioning, as shown in Figure 2–12. Each neuron in the figure is a formal neuron, and the number inside a circle indicates its threshold. When excitatory input exceeds the threshold, the neuron becomes excited. A small circle represents an unchanging synapse; a small triangle represents a Shimbel-type variable synapse. That is, after the postsynaptic cell becomes excited, the conductance of this synapse increases.
At the beginning, when only the neutral stimulus C is applied, the intermediate neuron I receives input below threshold 1 and is not excited, while the output of the output neuron is zero. But when the unconditioned input U is applied, it can directly cause the output neuron to fire. The intermediate neuron I still has no output. When the two input stimuli U and C appear simultaneously, in addition to directly exciting the output neuron, two excitatory synapses to intermediate neuron I are active and excite it. Consequently, the conductance of the variable synapse increases. After the two stimuli have appeared together many times, the variable synapse from C reaches full conductance. Thereafter, C excites neuron I, which in turn excites the output neuron, and classical conditioning is formed.
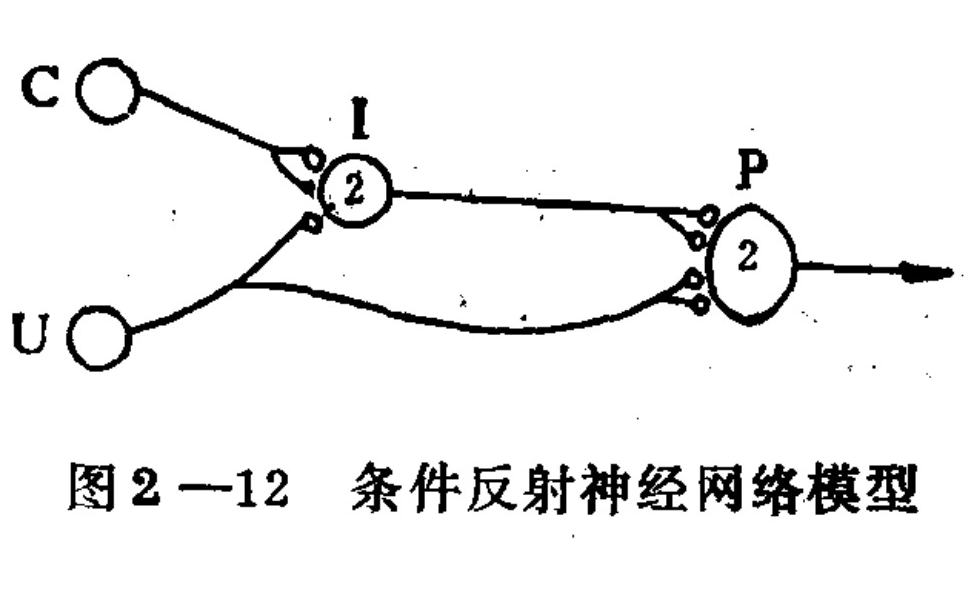
Figure 2–12. Classical-conditioning neural-network model
Translated labels: C; U; I; P
Thus, synaptic plasticity can be used to explain the formation of a simple conditioned reflex. However, the network in Figure 2–12 cannot represent extinction of a conditioned reflex—that is, when U is no longer added, a person will gradually lose the ability to produce the conditioned response. A somewhat more complex network can be used to realize a classical conditioned reflex with extinction. Figure 2–13 is a neural network that realizes this function.
In addition to the neurons already present in Figure 2–12, an inhibitory neuron J and another neuron K are added. The notation used is the same as in Figure 2–12. Between neurons K and P, besides the ordinary excitatory synapse, there is another synapse J′, representing a type of plastic synapse. When the presynaptic and postsynaptic cells (that is, neurons J and K) are excited, the conductance of this synapse decreases.
When C acts alone, J is not excited, and neither are K or P. When U is input alone, it can directly excite neuron P, while the inhibitory effect of J prevents K from becoming excited. When C and U act simultaneously, neuron J gradually becomes excitable, but K remains unexcited. After this, when C is applied alone, neuron J becomes excited; its inhibition is removed, causing K to become excited and in turn exciting P. The classical conditioned reflex has thus been formed. However, if U is not continuously reinforced, then K and P are excited multiple times simultaneously, making the plastic syn
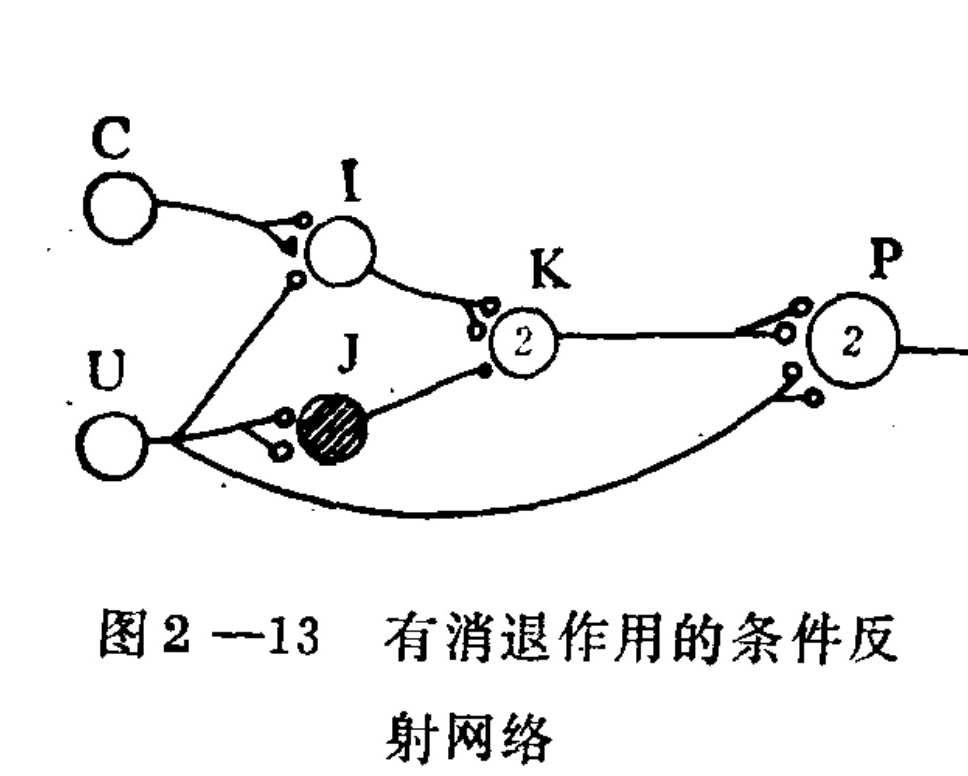
Figure 2-13: Conditioned-reflex network with extinction
Translated labels: C; U; I; J; K; P; 2
apse weaken, so that C no longer causes P to become excited; that is, the conditioned reflex has become extinguished. Therefore, to construct a model closer to actual conditions, a more complex network is often needed. By a similar method, a neural-network model capable of carrying out an operant conditioned reflex can also be constructed.
Using neuron models, neural networks of various forms can be assembled. For example, 36 × 36 neurons have been randomly interconnected, with the average number of excited neurons used as a variable, and an electronic computer has been used to simulate and study the dynamic process of this network. The waveform of the average excitation resembles the α waves in human brain waves and has been used to explain the mechanism by which brain waves are generated. However, the nervous system is not connected purely at random; it has a definite structure. As stated above, a multilevel hierarchical structure is an important characteristic of the nervous system. There are extremely extensive and reversible connections among neurons, and each neuron has an average of 10,000 synapses. The nervous system also contains many feedback connections and control mechanisms. To establish a brain model that reflects actual conditions more faithfully, these structural characteristics should be fully considered in the model. In fact, the history of brain-model research is a process in which these structural characteristics were gradually incorporated into models, from few to many, thereby producing models increasingly close to the functions of the human brain.
In brain-model research, the perceptron proposed by Rosenblatt in the late 1950s was an important milestone. The perceptron is a brain model that imitates the structure of the visual system. It is divided into three layers: a perceptual layer (corresponding to the retina), an association layer, and a decision layer. The units in each layer are neuron models, as shown in Figure 2-14. The perceptual and association layers are randomly connected, whereas the synaptic connections between the association and decision layers are plastic. The perceptron learns under the guidance of a “teacher.” It can learn to recognize different patterns input through the perceptual layer. When a pattern, such as a letter or number, is input through the perceptual layer, some neurons in the association layer become excited; the neurons in the decision layer then become excited or remain unexcited according to the synaptic-conduction conditions. If they become excited, this indicates recognition of the letter. At the beginning, however, the letter may not be recognized, in which case the decision-layer neurons do not become excited.
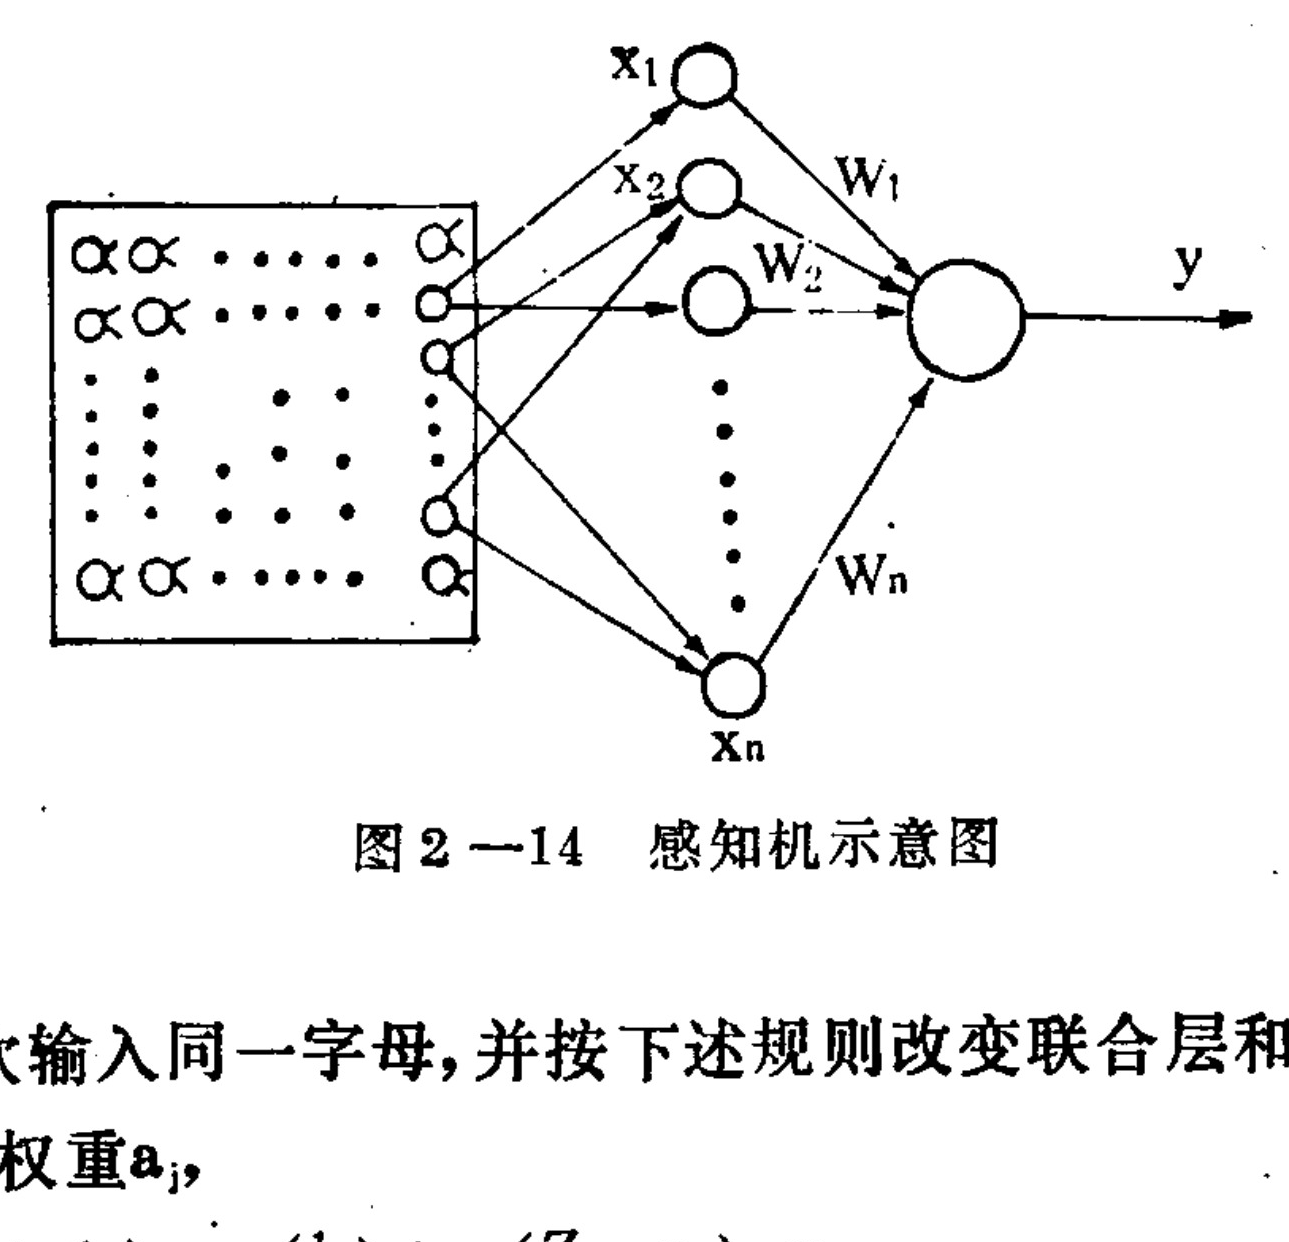
Figure 2-14 Schematic diagram of the perceptron
Translated labels: x1; x2; xn; W1; W2; Wn; y
If the same letter is input repeatedly, the synaptic-connection weight a_i between the association and decision layers is changed according to the following rule:
a_i(k+1) = a_i(k) + c_i(Z − x_i)x_i
Here, Z is the teacher signal. When the output decision is correct, Z takes the value 1, telling the machine that its decision is correct. Ultimately, the perceptron recognizes the letter: whenever that letter is input, the decision layer produces an output, y = 1. It has been theoretically proved that, as long as the two patterns are linearly separable, the perceptron will certainly learn according to the above equation. After taking into account part of the nervous system’s structure and plasticity, the perceptron realized the brain’s function of learning to recognize patterns. This result caused a sensation at the time, and many companies invested in this kind of research. Later, however, it was found that the perceptron’s capabilities were relatively limited, and interest in it gradually declined. Nevertheless, the appearance of the perceptron advanced brain-model research toward consideration of brain structure and promoted the development of pattern-recognition research. It is worth mentioning that, after perceptron research entered a low period in the late 1960s, researchers discovered that the cerebellar cortex might itself be a special kind of perceptron. After many years of research, this hypothesis has been endorsed by some renowned physiologists. If the theory that the cerebellum is a perceptron is indeed correct, it would indicate that brain models are an important tool for studying the functions of the nervous system.
The perceptron requires guidance from a “teacher,” whereas the cerebral cortex can learn without a teacher. Some self-organizing neural-network models that do not require a teacher have already been developed. Examples include neural networks in which feature cells of the visual cortex form automatically, and neural networks that automatically learn pattern recognition—the cognitive machine, and so on. These will not be discussed further here.
A person’s memory and thought have associative properties. Constructing models with associative-memory capacity using neural networks may become an important way to gain a deeper understanding of the functions of the human brain. Figure 2-15 is a schematic diagram of an associative-memory neural network. The associative-memory brain model consists of two groups of neurons. There are synaptic connections between the two groups, and all the synapses are plastic. Among the plasticity rules that have been proposed, the most widely used is Hebb’s hypothesis: when two neurons become excited simultaneously, the synaptic-conduction capacity between them increases.
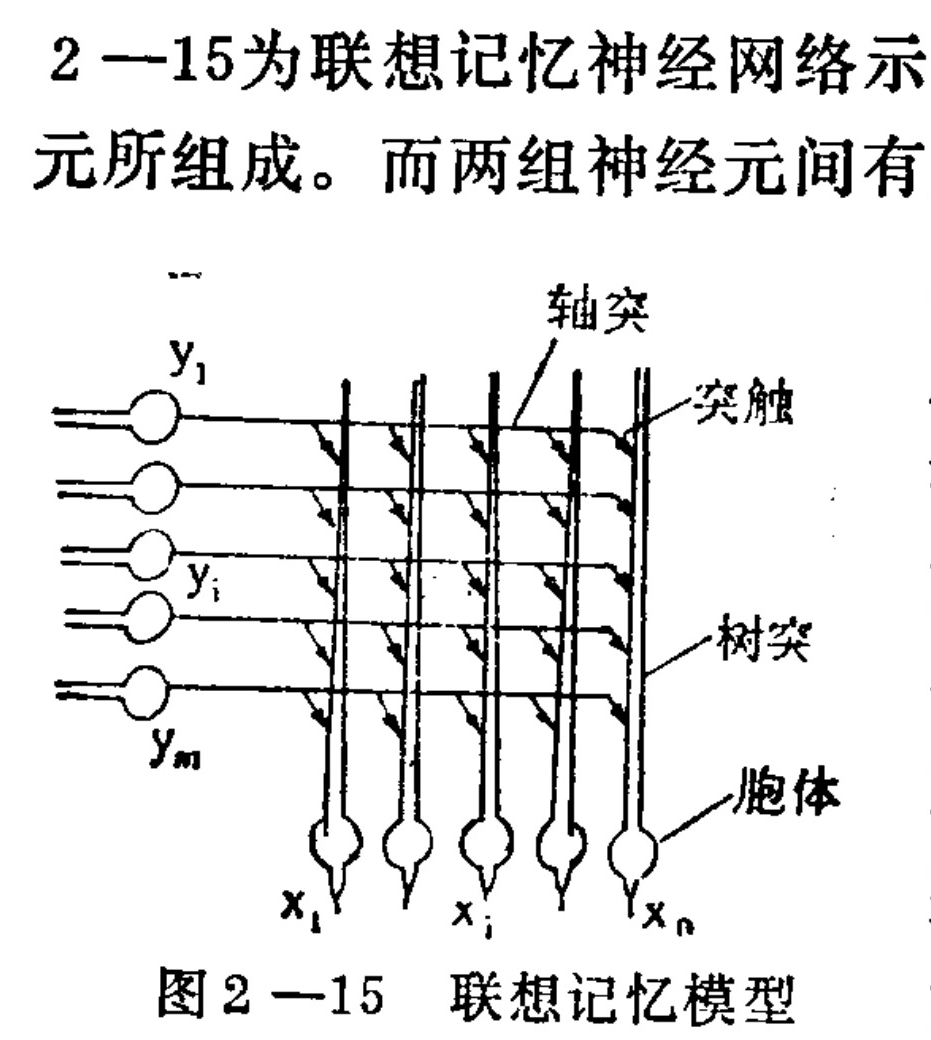
Figure 2–15. Associative-memory model
Translated labels: Axon; Synapse; Dendrite; Cell body
Normally, the events input into the model are encoded by sets of neurons; that is, an event corresponds to the simultaneous excitation of several neurons. When the two events to be associated in memory are input simultaneously into the model, the connections between the events are stored in all the synapses. When a series of events is input repeatedly, the synapses continuously change, storing the information that links these events to one another in the model. This storage has a holographic character. If one event is then input into one group of neurons, some neurons in the other group become excited; this pattern of excitation is precisely the encoding of the corresponding other event. In other words, the associated event is retrieved. This is associative retrieval. If the pair of events consists of the same event, it is called auto-association.
Associative retrieval is also divided into linear and nonlinear types, corresponding to different algorithms. Nonlinear associative retrieval is closer to the characteristics of neurons. The characteristics of this kind of associative storage are as follows: the storage and retrieval of information do not depend on an address, but on content. What is stored is not the events themselves, but the connections among them. Information is stored in a distributed manner across many components, and every storage component (synapse) is related to all the events stored. Therefore, the loss of an individual component or part of the information does not affect the operation of the memory; the information may still be retrieved correctly (or nearly correctly). In other words, it has resistance to interference and fault tolerance. Information is stored and retrieved through many parallel pathways, so relatively slow components can be used to obtain a relatively high computational speed. However, the capacity of an associative memory is related to the encoding of the events. It has been demonstrated that, in the case of linear associative retrieval, if the encoding vectors of the associated items are mutually unrelated, all the input information can be retrieved correctly.
The smaller the correlations among the encodings, the higher the model’s correct-retrieval rate. There are mechanisms in the nervous system, such as lateral inhibition and feedback inhibition, that can reduce the correlations among signals. When correlations are present, nonlinear associative retrieval may also correctly retrieve the stored information. However, the relationship between storage capacity and encoding in associative memory remains a problem that requires further investigation.
Because an associative memory is a time-varying nonlinear system, it is difficult to obtain the fundamental performance of this model by analytical methods. Someone constructed a hardware electronic device for an associative-memory model with 25 neurons and 325 synapses. Because plastic components are difficult to implement physically, most research on the performance of these models currently uses electronic-computer simulations, such as studies of error-correction and fault-tolerance capabilities.
Take a linear auto-associative model as an example. It consists of 54 × 56 neurons, with each neuron representing one pixel. The input event is a person’s head portrait, and each pixel has 8 gray levels. White noise was added to each pixel, with an average amplitude 1.6 times that of the original image. After 100 images had been stored, they were retrieved using the auto-associative method. The resulting output image was much clearer than the noisy image that had been stored.
Various computer-simulation experiments have also been conducted on nonlinear associative-memory models with different functions. For example, a nonlinear associative-memory model with 180 neurons was simulated on an electronic computer. In an associative-memory test, six objects consisting of three colors and three shapes (corresponding to a wooden box, apple, banana, brick, etc.) were used. The name, shape, and color of each object were each randomly encoded by 40 neurons. These items of information were input into the model, establishing connections among each object’s name, shape, and color. The corresponding shape and color could then be retrieved from the name by association, with a correct rate of 100%; however, when the name was retrieved in reverse from the color and shape, the correct rate was between 75% and 88%. This was because objects with the same color or shape had relatively high correlations, thereby causing “crosstalk.”
Two-Level Associative-Memory Brain Model (TLAM): Human thought is based on concepts. It may be inferred that the brain should be able to store concepts of different degrees of abstraction, as well as the relationships among them. The brain has a multilevel hierarchical structure and can therefore store concepts of different degrees of abstraction. Accordingly, on the basis of the general associative-memory model, we proposed a two-level associative-memory model for storing concepts, as shown in Figure 2-16. In this model,
The first level has two storage areas, storing respectively the concepts of concrete objects and the concepts of their attributes—for example, concrete objects such as apples and pears, together with corresponding attributes such as their shapes and colors. The second level stores abstract concepts of classes of things, such as fruits and beans.
Through learning, the model receives the objects and their attributes as input, and stores these concepts and the relationships among them. Normally, an abstract concept is gradually formed through repeated contact with concrete objects. Therefore, during the model’s learning stage, the objects and their attributes are input many times, and the model automatically forms abstract concepts in the second-level storage area.
All units in the model’s three storage areas are neurons. We assume that every neuron is connected to the others and that all their synapses are plastic. The synapses between areas A and B, and between areas A and C, change according to Hebb’s law. Thus, the two areas of the first level form a general associative-memory model. The synapses between areas B and C change according to two principles: presynaptic growth and postsynaptic competition. Under the first principle, as long as the presynaptic cell is excited, the synapse’s conducting capacity increases. The second assumes that the total conducting capacity of the synapses between each neuron and the neurons in the other area is fixed; when one synapse increases according to Hebb’s law, the conducting capacity of the remaining synapses decreases. This causes the synapses that are used most often to develop while the others degenerate. With these assumptions, abstract concepts can form automatically.
Like an ordinary associative memory, the storage capacity of TLAM is related to the coding of the information stored in it. The exact relationship is not yet clear. However, from theoretical distributions and computer simulations, we have obtained several conditions that the coding must satisfy. Preliminary analysis and simulations show that the nervous system may automatically produce codes satisfying these conditions with high probability.
We carried out computer simulations of a TLAM model with 53 neurons. When the input consisted of 3 categories and 11 kinds of objects, the model functioned correctly. The objects corresponded to fruits (apples, pears, bananas, and plums), beans (adzuki beans, green beans, and kidney beans), and melons (cucumbers, watermelons, and pumpkins). Their attributes included three colors (red, yellow, and green) and two shapes (long and round).
After the concrete objects and their attributes had been input repeatedly, information could be retrieved by using a concrete object to obtain the content of its concept. For example, when an apple was used as input, the model’s output was red, round, and fruit. The model could also be given an abstract concept as input and output the associated concrete objects. For example, with fruit as input, the output was plum, banana, pear, and apple. This retrieval order was related to the number and order of times the objects had been presented during learning. In the above result, the objects had repeatedly been input in the order apple, pear, plum, banana, plum; plum was retrieved first because it had been presented more often. Among objects presented the same number of times, the one presented later was retrieved first. This resembles a property of human memory.
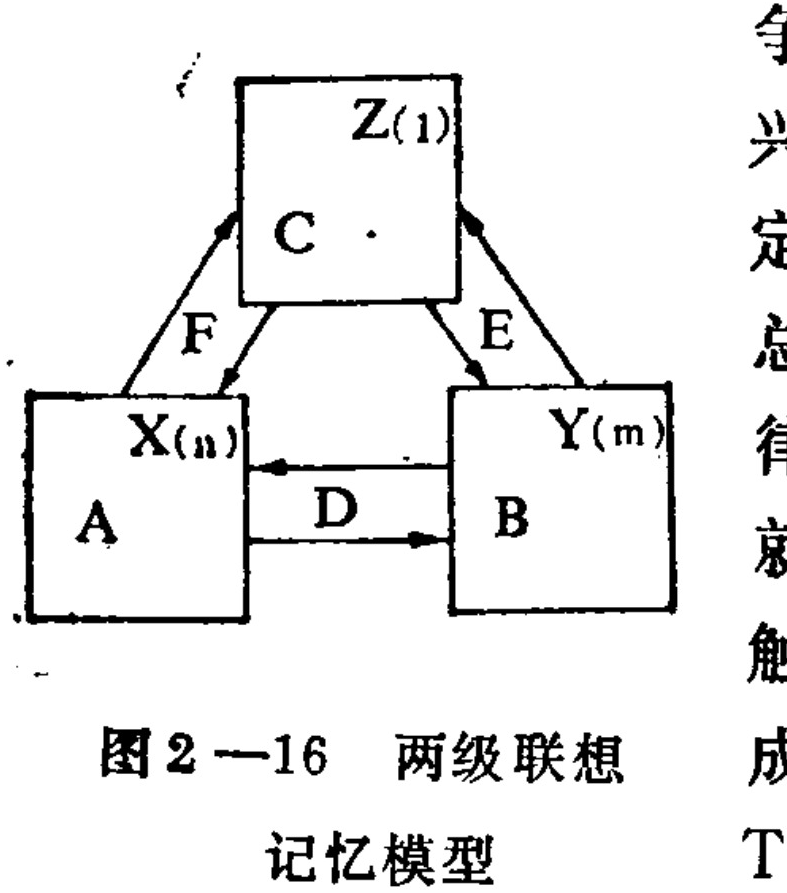
Figure 2-16: Two-level associative memory model
Translated labels: Z(1); C; F; X(n); A; D; Y(m); B; E
In the simulation, we also observed the role of postsynaptic competition in the correct formation of abstract concepts in TLAM, suggesting that information processing in the brain requires multiple rules of synaptic change. In addition, based on the TLAM model, we carried out a simple computer simulation of the thinking process. The model could perform syllogistic reasoning and simple inductive logical reasoning. Since the content and extension of concepts had already been stored in TLAM, syllogistic reasoning was easy to implement. Of course, to implement thinking processes in the model, it was necessary not only to add a storage area Sp, but also to add some new mechanisms. For example, syllogistic reasoning requires the addition of temporary synaptic changes and threshold-control mechanisms. Through research and experimentation, we believe that the associative-memory brain model can become a basis for further study of thinking processes.
Beginning in the 1980s, research on neural networks achieved new breakthroughs. Building on research into associative-memory models, researchers discovered that neural networks could perform optimization calculations. Neural-network models have been used to solve combinatorial optimization problems that are very difficult to solve by other means, such as the traveling-salesman problem. In addition, very-large-scale integrated circuits have been used to manufacture a distributed-processing model with 256 neural processors, which can be used to solve many complex information-processing problems, including pattern recognition and robot control.
A new upsurge in neural-network research has now taken shape. In 1987, the Institute of Electrical and Electronics Engineers in the United States held an international academic conference on neural-network research. More than 2,000 people attended. After the conference, the International Neural Network Society was established, and plans were made to publish a neural-network journal. This marked the arrival of the upsurge.
VIII. The Nervous System and Qigong
In the preceding sections, we have discussed how many structures and functions of the brain are related to the qigong state.
The nervous system plays a key role during qigong practice. In this section, we will further explore the changes that occur in the nervous system in the qigong state.
During qigong practice, although different methods may vary greatly, they generally all first require relaxation, stillness, and naturalness. Relaxing the limbs reduces the afferent input from skeletal muscles and their receptors. Stillness reduces sensory input on the one hand, and on the other hand also requires a reduction in the brain’s own spontaneous activity. In short, this frees the nervous system from the disturbances of everyday life.
On the one hand, this allows the neural structures responsible for these activities to rest and recover. More importantly, it causes the higher regions of the brain to shift their main attention toward the stability of the internal environment and immune regulation—areas in which they normally intervene less often. One of the principles governing activity in the cerebral cortex is that the various parts mutually constrain one another: excitation in one part inhibits another, while a decrease in excitation in one part can make another part more readily excitable. Human consciousness and higher cortical activity, moreover, can focus on only one aspect at a time.
The relaxed, still, and natural state brings about major changes in the nervous system. Areas that are normally highly excitable become less excited, while areas that are normally inhibited become more excitable. The brain’s active capacity also shifts from higher regions toward parts that are normally neglected. This creates the necessary conditions for the cerebral cortex to accomplish tasks that are normally difficult to complete, to establish connections between consciousness and the internal organs, and to realize certain special functions about which we still know very little.
To clarify the changes in the nervous system during the qigong state, it would be best to observe directly the activity of neurons in each part of the nervous system before and after qigong practice. In neuroelectrophysiology, microelectrodes are often inserted into the brain to observe the electrical activity of neurons. However, this method can usually observe only a few neurons simultaneously, which is far from sufficient for understanding a complex system containing more than one hundred billion neurons. Moreover, the technique is invasive and generally cannot be used to observe the human brain.
At present, the more practicable methods for observing changes in the nervous system may be the electroencephalogram (EEG) and maps of the distribution of metabolism in the brain. The latter requires a fairly complex apparatus. Consequently, only EEG observation has so far been used in research on the qigong state.
An EEG is the electrical signal obtained by placing electrodes on the scalp. Usually, many electrodes record simultaneously. The amplitude of an EEG obtained from the scalp is between 50 and 200 microvolts. The actual EEG record often contains several different frequencies and amplitudes; an electronic computer can accurately analyze the frequencies it contains and their relative strengths. The frequency range is between 1 and 30 cycles per second.
According to their different frequencies, EEGs are usually divided into four bands: components at 1–3 cycles per second are called delta waves; those at 4–7 cycles per second are called theta waves; those at 8–13 cycles per second are called alpha waves; and those at 14–30 cycles per second are called beta waves.
Generally speaking, the lower-frequency components also have larger amplitudes. There are different hypotheses about the mechanism that produces brain waves. The usual view is that they result from the summation of changes in the membrane potentials of the apical dendrites of large numbers of cortical pyramidal cells. Neuronal impulses involve rapid changes in potential, whereas brain waves are slow potential changes. The membrane potentials of the cell bodies and dendrites are consistent, and the pyramidal cells can be seen to be arranged very regularly: their apical dendrites all extend toward the cortical surface.
In general, the lower-frequency brain-wave components have larger amplitudes. Theta waves are usually about 20–200 microvolts, alpha waves about 10–100 microvolts, and beta waves about 5–20 microvolts. In an awake normal person, delta waves generally cannot be recorded; they are associated with the brain’s nonspecific thalamic afferent system. Theta waves are especially marked in psychiatric patients, and delta waves also appear during sleep.
In normal people, alpha waves are most prominent in the occipital lobe. With the eyes closed and the person at rest, alpha waves are most pronounced; when the eyes are opened or the person thinks, the alpha waves disappear and are replaced by beta waves. This is called “alpha blocking.” Thus, alpha waves are the EEG manifestation of a cerebral cortex in a quiet state. Alpha waves also undergo marked changes during the formation of a conditioned reflex. After the conditioned reflex has been established, alpha waves reappear. Therefore, people believe that alpha waves are related to internal inhibition. Theta waves are most likely to appear in the frontal lobe; they are related to mental tension and emotional excitement.
Both in China and abroad, observations have been made of the effects of qigong practice on the EEG. They have found that during qigong (or yoga) practice, the amplitudes of different EEG bands and their distributions across brain regions both change. The results also differ among observers and among different methods of practice. A relatively consistent result is that the EEG in the qigong state differs from that in the awake, sleeping, and hypnotic states, indicating that the nervous system in qigong is in a new and special state.
During practice, alpha waves become stronger, and alpha dominance gradually shifts from the occipital lobe toward the frontal lobe; the alpha-wave frequency also tends to decrease. These changes become stronger as the practice deepens. They are more pronounced in qigong practitioners with deeper skill. As described in the preceding sections, the frontal lobe is the most recently developed and one of the largest structures of the cerebral cortex, and it plays an important role in the higher functions of the cerebral cortex. The appearance and establishment of frontal-lobe alpha-wave dominance may place the frontal lobe in a state of readiness for establishing new connections. This creates conditions for establishing new connections in the cerebral cortex during the qigong state and producing new higher functions. Because qigong is a special state, observation of the electroencephalogram and other changes within the brain under these conditions is not yet sufficiently advanced. The changes in the nervous system during the qigong state, as well as the new abilities that may arise, remain subjects for further investigation.
As human society has progressed, the pace of social life has accelerated. The stimuli people encounter in daily life have, for some people’s nervous systems, exceeded the load they can bear. Consequently, the cerebral cortex remains in an excessively tense state and, through the autonomic nervous system, causes disturbances in the endocrine system, immune mechanisms, and so forth, resulting in bodily disease. Such illnesses are called psychosomatic diseases and are not easily treated with medication. The qigong state places the parts of the nervous system that process and respond to ordinary daily stimuli in a state of reduced sensitivity, freeing them from the disturbance of everyday stimuli and reducing the harm caused by unfavorable stimulation of the cerebral cortex. At the same time, it may enhance the ability to withstand stimulation.
Throughout life, sleep and wakefulness continually alternate. Sleep also has a relaxing and calming effect to a certain extent, and adequate sleep benefits health. Sleep therapy, in which conditions conducive to sleep are artificially created, is also effective in treating certain diseases. However, sleep differs from the qigong state, and the difference can also be reflected in the electroencephalogram. In light sleep, the alpha waves disappear; as sleep deepens, the recordings consist entirely of theta waves, accompanied by 12–16 spindle waves per second. During rapid-eye-movement sleep, there are low-amplitude beta waves. The sleep state cannot be controlled, and unconscious disturbances such as nightmares often occur, producing stress responses. In addition, some evidence indicates that sleep may involve other information-processing tasks: the brain organizes the information collected during the day. Therefore, during sleep, the cerebral cortex cannot be deliberately mobilized to establish new connections or create new functions.
During the qigong state, changes in the nervous system necessarily cause corresponding changes in the condition of the various parts of the organism under its control. Observing these two kinds of change simultaneously will lead to a better understanding of qigong’s effects.
Chapter Three: Basic Concepts and Methods of Cybernetics
In the first chapter, we discussed the history and certain characteristics of the development of cybernetics, as well as some applications of cybernetics in biomedicine. Although cybernetics can play an important role in solving problems related to qigong, at present there has been little work applying cybernetics to the theoretical and practical problems of qigong. To promote the application of cybernetics to qigong, this chapter will further introduce the basic concepts and methods of cybernetics, enabling readers to master its basic ideas and methods and apply them to improving qigong exercises, explaining qigong principles, and addressing related problems. Because cybernetics, as an interdisciplinary field, is still continually expanding and developing, different authors do not have entirely identical understandings of the scope of cybernetic research. Therefore, this chapter does not attempt a comprehensive discussion of cybernetics, but only discusses the parts that the author considers more useful for qigong research. We will first explain several cybernetic concepts, including systems, control systems, dynamic systems, stability, and information. We will then introduce the principal methods used in cybernetics: mathematical modeling, computer simulation, system identification, optimal control, and adaptive control.
I. Systems
In his classic work Cybernetics, Wiener used “control and communication in the animal and the machine” as the book’s subtitle. This shows that cybernetic research began with the problems of regulatory control and information processing in living organisms and automatic machines. Living organisms and automatic machines are both relatively complex systems. In such systems, the problems of control and communication are of the greatest importance. As cybernetic research and applications developed, people discovered that most of the systems in which we are interested—such as economic, social, and ecological systems
…and so forth, all have common problems of control and communication. They therefore possess common laws and can be studied using cybernetics. The broad applicability of cybernetics has made it a cross-disciplinary field capable of studying problems in different areas, while its basic concepts and methods have methodological significance.
The object of cybernetic research is the system. Here, a system means a whole composed of many units that interact with and are connected to one another. There are many different concrete systems before us. Any whole composed of multiple interconnected parts can be regarded as a system. A person, a tree, or a cell can all be regarded as systems; the entire universe is also a gigantic system, and the terrestrial biosphere in which we live is likewise a system. This is because all of them are composed of many units (or parts), and these units have stronger or weaker interconnections. Everything in the universe is interconnected. For theoretical and practical research on a system, we usually separate the object being studied—a particular concrete system—from the things around it. The things around it are regarded as the environment of that system. The more closely the units within a system are connected and the more rigorous its internal organization, the less it is influenced by its environment. Such systems therefore possess relative independence. The systems studied by cybernetics are mainly relatively independent systems (called relatively isolated systems in some literature). The division of systems is also relative. When studying physiological and psychological processes in the human body, the entire body is regarded as a relatively independent system; but when studying the human cardiovascular system, only the relevant cardiovascular structures belong to that system, while the other parts of the body are regarded as its environment.
Systems and units are also relative. For the human body as a whole, its various physiological systems can be regarded as its constituent units (or components), while each physiological system is itself a relatively independent system. Every system in turn has many units. For example, in the blood-pressure regulation system, the heart, blood vessels, and pressure receptors are all constituent units. Thus, in practice, the system and its corresponding units are often determined according to the problem that must be solved.
As a whole, a system’s principal behavior or performance is related not only to the characteristics of its units; more importantly, it is determined by the connections among its components. The popular formulation in systems theory is that “the whole is greater than the sum of its parts.” That is, the characteristics of the whole (the system) cannot be explained by the characteristics of mutually isolated units. For example, the same semiconductor components, resistors, capacitors, and other parts can be connected in different ways to form electronic devices with many different functions: they may be amplifiers, filters, radios, and so on.
Therefore, when studying a system, the important question is how its individual constituent units are interconnected to form the new characteristics of the system as a whole. During qigong training, the body’s individual components may not undergo any obvious changes; yet merely by forming new connections among the components, the entire body can be brought into an entirely new state.
Because the components of a system influence and connect with one another, when observing changes in a system, one should not regard the behavior and changes observed in a particular unit as being related only to that unit. Often, a change in one unit is the result of the combined influence of all the units in the system, or is simply caused by changes in other units of the system. For example, the systemic fluctuations in blood pressure caused by a brain tumor, mentioned in Chapter One, should not be explained by looking for the cause in the blood vessels or heart. Only by examining the interactions among all the components of the system can a reasonable explanation be found. We should also bear this in mind when studying the principles of qigong, because the human body is an extremely complex system whose interconnections are intricate and complicated. The changes in the organism caused by qigong training should not be studied only through the various concrete changes that can be readily measured at the body surface. These changes should instead serve as clues for tracing the roots of the changes through the relationships among the different parts of the organism; only in this way can the mysteries of qigong gradually be uncovered.
To reveal the laws governing the interconnections among systems, cybernetics focuses on the functional relationships among components while disregarding differences in their concrete structures. In this way, many different kinds of concrete systems can be analyzed within the same framework. Moreover, the results of research on one concrete system can illuminate our understanding of systems with similar functional structures. Systems theory can therefore be applied broadly in different fields. The study of functional relationships also allows us to use unified mathematical models to conduct quantitative research on various processes in different concrete systems.
Various functional relationships exist among the units (or links) of a system, including information-transmission functions, information-transformation and information-processing functions, and control functions. If we apply cybernetics to study the body’s temperature-regulation system, for example, we would not conduct an in-depth analysis of the specific anatomical structures of the cold and warm receptors on the body’s surface and inside the body. Nor would we investigate in detail how a temperature stimulus is converted into
The discussion does not concern the specific physical processes by which nerve impulses are generated. Instead, they are regarded as information-transformation units, considering only the quantitative relationship between the stimulating temperature and the nerve impulses produced. In this way, the functions of a temperature receptor and of a temperature sensor or thermocouple in a constant-temperature chamber are the same: both convert temperature information into corresponding signals and transmit them to the control center. The thermoregulatory system and the other units of a constant-temperature chamber likewise have corresponding relationships. These correspondences make it possible to compare the two systems and their behavior and to analyze and study them by the same method.
The interactions among the units within a system are continuous. Interaction between the system and its external environment also occurs constantly. As a result of these interactions, the system produces motion—that is, the state of the entire system changes over time. Control theory places particular emphasis on studying this kind of dynamic process. Changes in the units within the system and in their connections, as well as changes in the external environment, can all give rise to dynamic processes in the system.
System performance is one of the important ways of determining whether a system is good or poor. For example, individuals with different constitutions may display similar specific characteristics when they are calm and undisturbed; all may be healthy individuals, and their relative strength cannot be distinguished. But when bacteria or viruses invade, or when the environment changes suddenly, this can produce an obvious dynamic process in the organism. An individual with a weak constitution may enter a pathological state, whereas an individual with a strong constitution may either remain unaffected or quickly recover to normal. Similarly, exercise electrocardiography is already used clinically to detect latent cardiac lesions. By adding an exercise load and thereby inducing dynamic processes such as an increased heartbeat, then observing the changes in the electrocardiogram, it may be possible to discover signs of disease that were not detected in the electrocardiogram at rest.
For a dynamic system—that is, a system capable of undergoing dynamic change; in fact, all systems are dynamic systems, although some change so little or so slowly that they may be regarded as unchanging static systems—the most fundamental property is stability. In ordinary terms, stability refers to the ability of a system to resist external disturbances. Under the action of an external disturbance, a system will generally change and undergo motion. If, after the disturbance is removed, the system can return to its original state, then the system is stable. The stronger and faster its ability to recover, the higher its stability. The issue of system stability will be discussed further in Section 8 below.
.58
II. Control and Control Systems
A control system is the basic form of system studied by cybernetics. A control system is characterized by the existence of control action. Under the action of control, a system can change its state and motion and enter various different states. Control action is produced by some dominant units (or links) within the system. The result of control causes the system to move toward a certain goal. Therefore, realizing a given goal is often the principal function of a control system.
The control discussed here is control in the broad sense. A driver turning a steering wheel is one kind of control: it can cause a car (which is also a system) to travel at a certain speed toward a certain goal. It can also change the car’s speed and direction and change the goal of its motion. The instructions and orders issued by a factory director are also a kind of control. They can change a factory’s production tasks and enable the factory to complete a certain production task according to a predetermined plan. Government plans, policies, and laws are likewise forms of control. They can change a country’s political and economic development and enable the country’s political and economic life to advance along a predetermined course.
In a control system, the control action adopted by the dominant unit (or link) can be selected; without a choice, there can be no talk of control. Different choices produce different results. In general, the dominant link has many possible choices, so its control action does not necessarily produce the anticipated result. Only the correct choice and appropriate control can produce the desired effect. Whether the predetermined goal can be achieved is related to the controller’s (or decision-maker’s) ability to control (or choose).
A skilled driver can make a car travel along a rugged, winding road toward its intended destination, whereas a novice driver may drive the car into a ditch. An astute and capable factory director, broadly experienced and knowledgeable, can manage a factory in good order and make production prosper; an incompetent director can plunge production into chaos and even cause the factory to go bankrupt. However, regardless of whether control action achieves the predetermined goal, it will affect the system’s state and motion. In the examples above, the dominant link is a person with active agency.
There are also control systems in which no person participates; these are automatic control systems. In an automatic control system, the dominant link is called the controller. The controller takes the place of the person who played the dominant role above. For example, in an unmanned aircraft, an autopilot becomes the dominant link and can make the aircraft reach its predetermined destination. In a missile, the guidance system is the dominant link—the controller of the missile as a whole—and plays a decisive role in guiding the missile toward its predetermined target. In a constant-temperature chamber, the temperature regulator is its dominant link. It determines the chamber’s ability to maintain a stable temperature and its ability to regulate temperature. All of these can produce control action and direct the system toward a predetermined goal. Every well-designed automatic control system should enable the system to achieve its own goal.
In addition to the dominant link that produces control action (hereafter, the dominant link will be called the controller), a control system also has the controlled unit (or part), called the controlled object. The cars, factories, aircraft, and missiles in the examples above are all controlled objects. A controlled object is sometimes also called a controlled link or controlled system.
To achieve its own goal, a control system must have close connections among its component units. In other words, a control system is an organized system. However, it is difficult to give an exact definition of the concept of organization. Nevertheless, people can intuitively sense whether something is organized. A system in a state of “thermal equilibrium” is clearly unorganized. By contrast, a living organism that can maintain its own existence and reproduce its offspring is highly organized. Of course, not all organized systems are control systems; in a control system, however, organization is achieved mainly through informational connections. Information therefore plays an important role in a control system.
To give readers a further understanding of control systems, we will begin with relatively simple, concrete control systems. In addition to the controller and controlled object already mentioned, the most basic control system requires the controller to obtain information about the results of control in order to achieve a predetermined goal. The process of sending this information back to the controller is called feedback, and this task is completed by feedback elements (or sensing elements). Thus, a simple, typical control system consists of a controller, a controlled object, and feedback elements.
The blood-pressure regulation control system provides an example. The relative stability of blood pressure is the primary goal of this control system. The cardiovascular center in the medulla oblongata can be regarded as the controller of this control system; the heart and blood vessels are the controlled object; and the pressure receptors in places such as the carotid sinus and aortic arch are the feedback elements (links). The relationships among the units of this control system can be represented by Figure 3–1.
This is a block diagram, often used in the study of control systems. Each block represents one unit (link), the connecting lines between the blocks represent the functional connections among the units, and the arrows indicate the direction of action. The diagram contains only one closed loop; a system of this kind is called a single-loop system.
Input +
Controller (cardiovascular center)
Controlled object (heart and blood vessels)
Output (blood pressure)
Feedback element (pressure receptors)
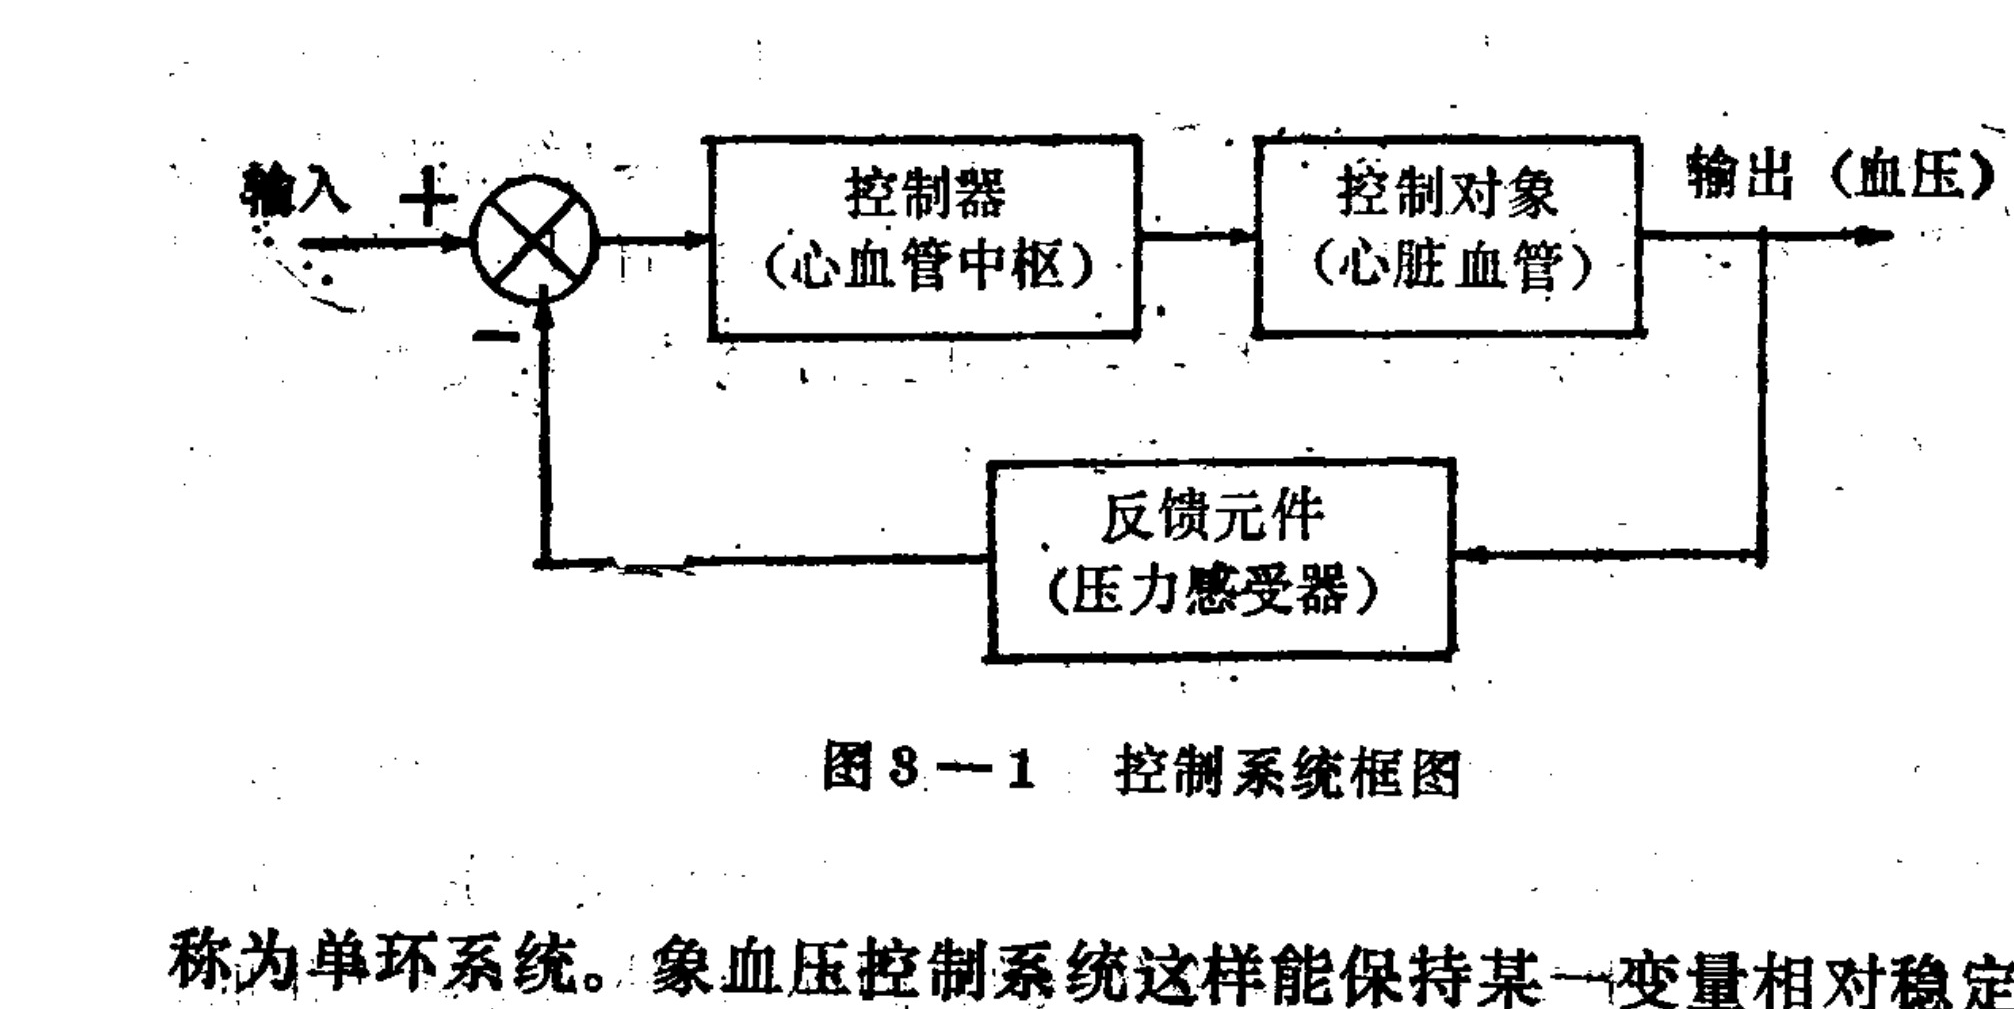
Figure 3–1. Block diagram of a control system
Translated labels: Input; Controller (Cardiovascular Center); Control Object (Heart and Blood Vessels); Output (Blood Pressure); Feedback Element (Pressure Receptor)
A control system such as the blood-pressure control system, which can maintain a certain variable at relative stability, is also often called a regulation system. Therefore, the system represented in Figure 3–1 may also be called a blood-pressure regulation system.
In a regulation system, in order to achieve stability of the regulated variable, the actual value of the regulated variable is generally fed back to the controller and compared with the predetermined value. When the feedback signal is higher than the predetermined (or set) value, the controller produces control action, and the result of that control action lowers the variable. When the variable is too low, the feedback signal is lower than the predetermined value, so the controller’s control action raises the variable. In other words, the control action regulates the variable in the direction opposite to its deviation, and is therefore called negative feedback. Negative feedback is the basic form of regulatory control.
Not only do various industrial regulators and gun-tracking systems rely on negative feedback to achieve their predetermined purposes, but the internal environment of the human body—including blood pressure, respiration, body temperature, and the blood concentrations of various electrolytes and hormones—is also maintained in relative stability by negative feedback. General regulation systems use negative feedback.
Negative feedback is also an important method for achieving goal tracking. Systems of this type are called servo systems. In a servo system, the controlled variable is not constant; instead, it is required to follow a predetermined changing target. For example, a gun-tracking system tracks a target, as does a control system in which the eyeballs follow the movement of a target. In this system, the retina is the feedback element. When the visual image on the retina
When the position deviates from the center (the fovea), a feedback signal is sent into the nerve center, producing a controlling effect that causes the eyeball, and even the head, to move. When the target moves, the eyeball follows it, ensuring that the visual image of the target always falls near the fovea. The eye muscles are the controlled object of this control system. These control systems, which achieve their objectives through negative feedback, are also called feedback control systems, or simply feedback systems. In some other systems, the feedback signal can cause the controller to act in the same direction as the change in the feedback signal, causing the variable to continue changing in one direction. Such a system is called a positive-feedback system. Positive-feedback systems are generally unstable. Positive feedback also exists in the organism; for example, in certain processes of growth and development, positive feedback is an important factor promoting development.
Feedback control is an important form of control system, but it is not the only form. In a feedback system, information continually circulates through the loop: the controller acts on the controlled object, the result produces a feedback signal, and that signal is sent back to the controller. It is therefore also called a closed-loop control system. In a closed-loop system, information is continually transmitted within the system. Consequently, when an external disturbance acts on it, the system can detect the deviation it causes and correct it. It therefore has the ability to resist disturbances and changes in its internal components. In contrast, there is a relatively simple form of control called open-loop control. In an open-loop control system, the controller issues control commands according to a predetermined program and controls the movement of the controlled object; the result of the control is not fed back to the controller. A numerically controlled machine tool is an example of this type of control system. A computer can determine the machine’s movement program according to the processing requirements and issue control commands that make the machine move according to the specified commands. When external disturbances are present, open-loop control produces control errors that cannot be corrected. Figure 3-2 is a schematic diagram of an open-loop control system. If a disturbance is known in advance or can be measured, a compensation element can be added in parallel with the control command, before the controlled object, so that the effect of the disturbance is compensated. Because the compensation element is on the forward path before the controlled object, it is also called a feedforward element. A system with feedforward action is called a feedforward control system; Figure 3-3 is a schematic diagram of a feedforward control system. Feedforward action can also be added to a feedback system, forming a feedforward-feedback control system.
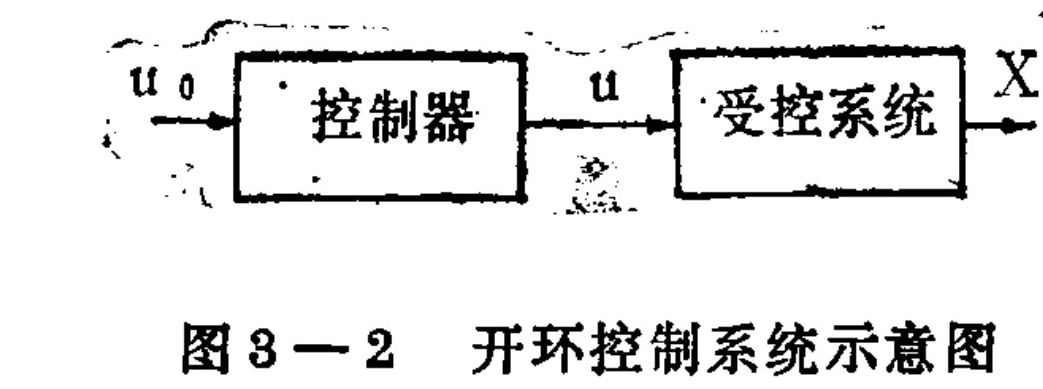
Figure 3-2. Schematic diagram of an open-loop control system.
Translated labels: u0; Controller; u; Controlled System; X
62
Diagram labels: Controller; controlled system.
Feedforward-feedback control system.
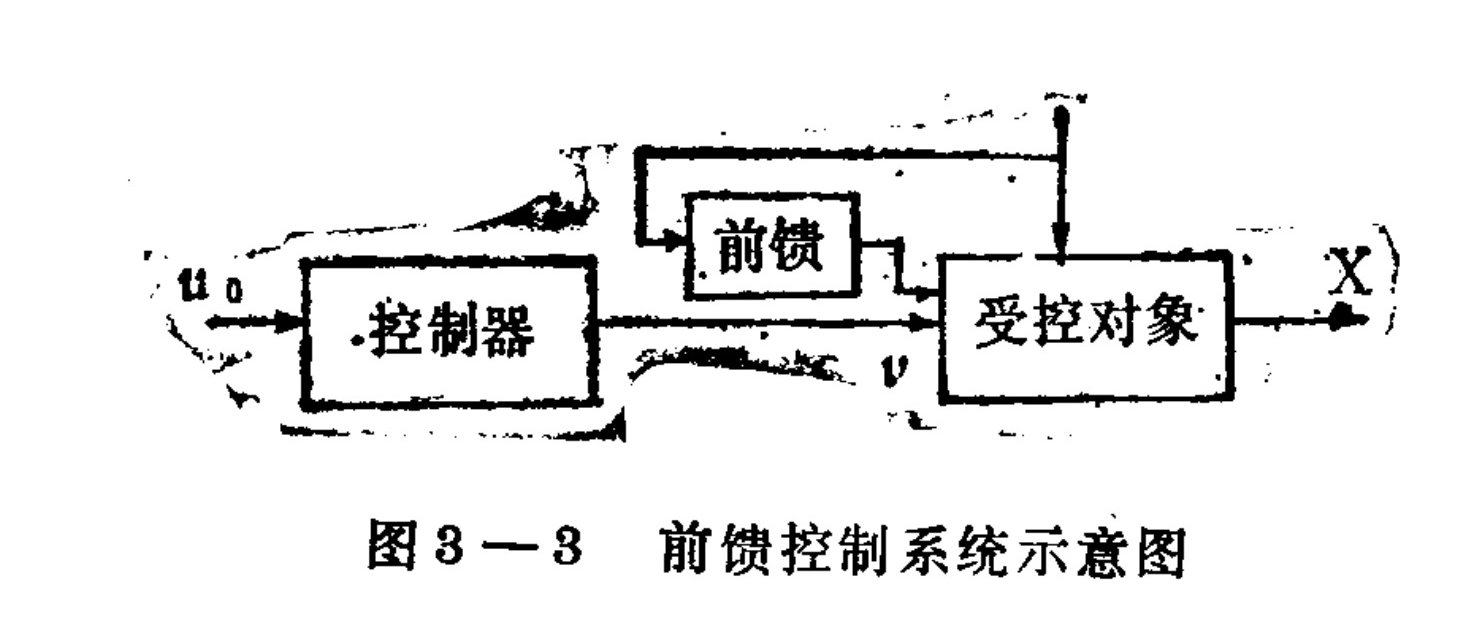
Figure 3-3. Schematic diagram of a feedforward control system.
Translated labels: u0; Controller; Feedforward; Controlled Object; X
The control systems discussed above are the simplest kind. Actual control systems are often much more complex. Their structures are more complicated and their functions more complete. For example, an actual blood-pressure regulation system contains multiple feedback elements. In short-term regulation, there are at least three feedback loops: the pressure receptors, the chemoreceptors, and the cerebral-ischemia receptors. Such a system is called a multiloop control system. In addition, a control system may sometimes have several simultaneously controlled variables. For example, a respiratory control system has three variables: the partial pressure of carbon dioxide, the partial pressure of oxygen, and pH. A system with only one controlled variable is called a single-variable control system, while a system with multiple variables is called a multivariable control system. The more advanced the functions of a control system, the more complex its structure. For example, there are adaptive control systems that can automatically change their control structure according to changes in the environment and the controlled object, and learning control systems that can improve their own control capabilities through practice. These will not be listed one by one here.
3. Information and Amount of Information
Information is extremely important to control systems. Today, the term “information” is widely used, but in different contexts people do not always mean exactly the same thing by it. In daily life, we need to obtain information about the surrounding world through our various sensory organs. For example, when walking, we use our eyes to obtain information about the road and whether there are obstacles, enabling us to follow the road, go around obstacles, and reach the predetermined goal. Within a biological organism, in order to survive in good health, the nervous system obtains information about body temperature, blood pressure, the concentrations of various blood components, and so forth through various receptors, so that it can control the body and maintain the stability of the internal environment.
A doctor examining a patient first collects information about the patient’s condition. The various clinical examinations, such as laboratory tests, X-ray fluoroscopy, and electrocardiography, are all methods of obtaining this information. Put more colloquially, information means news, intelligence, knowledge, and so on. In cybernetics, information is the third basic element, alongside matter and energy. In a system, the function of information is to establish the mutual connections among its various units.
Information is different from matter, but information must be carried by matter. The same information can use different kinds of matter as its carrier. For example, when we travel away from home, we may need to tell our family that we have arrived safely. This information can be conveyed by letter, telegram, or by asking a friend to deliver it orally; all can produce the same result. Clearly, without writing paper, telegraph paper, or sound waves, we cannot obtain this news. Yet what we want to obtain is not the paper or the sound waves, but the news itself. Therefore, in all communication, the essential thing transmitted is the content—that is, the information—not the matter and energy serving as its carrier. Usually, an information carrier carries the content of the information through changes in the carrier. For example, when sound waves serve as the information carrier, changes in the amplitude and frequency of the sound waves reflect the content of the information they transmit. Thus, the law governing changes in the information carrier is determined by the content of the information it carries. The amount of information carried by an information carrier generally does not depend on the size of the carrier’s matter or energy. As long as the carrier’s matter or energy is sufficient to meet the receiver’s minimum requirements for receiving the signal, simply increasing the matter or energy does not increase the amount of information received. For example, when listening to a broadcast, it is enough for the radio’s volume to be loud enough for the ears to hear clearly; increasing the volume does not make us hear more news.
Within a biological organism, the importance of informational connections is even greater. The more advanced the organism, the more complete its internal communication system. The human nervous system is primarily responsible for transmitting and processing information. The information within the organism consists mainly of messages about the conditions of the organism’s external and internal environments. The nervous system collects this information and produces responses beneficial to the organism’s survival. Information transmitted in the nervous system is generally carried by nerve impulses. Although nerve impulses transmit information in the same form in different nerves, the meanings of the information they carry are completely different. In the sinus nerve, nerve impulses transmit information about the level of blood pressure: when the nerve impulses increase, this reflects an increase in blood pressure. In the optic nerve, nerve impulses transmit the visual information received by the eyes. Changes in these nerve impulses indicate changes in the shape, color, and brightness of the objects seen.
The information carried in matter exists objectively, but the use of information is related to the receiver; therefore, it can be said to contain a certain “subjective” factor. A radio station continuously broadcasts information about domestic and international affairs every day, but this information can be received only through a radio, and only human beings can receive this information from the sound waves emitted by the radio. For other animals, sound waves can obviously also enter their ears, but this is only “sound”; they will not respond to the information in it. Information generally does not have the universal effect possessed by matter and energy. Only a specific receiver or recipient has the ability to receive information. This selectivity and specificity of information transmission make connections established through information more effective. Specificity in information reception also plays an important role within living organisms. For example, hormones transmit information within the body. Although hormones reach the entire body through the blood, a hormone is accepted only by the target cells with the corresponding receptors, allowing it to perform its function; it has no effect at all on other cells. The specificity and selectivity of information reception make mutual connections more precise and closer. Therefore, it can be said that information is the advanced form of connection among things (or among the various units within a system).
Next, we will discuss the quantitative problem of information. At present, the quantitative problem of information has been solved relatively well only in the field of information theory or within the scope of communications. Information theory is the science that studies the sending, transmission, and reception of information quantitatively. It has effectively solved two important basic problems in communication systems: efficiency and reliability. Communication efficiency refers to how to transmit the largest amount of information by the most economical method; communication reliability refers to how, in the presence of disturbances, to make the received message agree with the original message as much as possible. To solve these problems, information theory precisely defines the concept of amount of information.
To introduce the concept of amount of information, let us first examine the general process of information transmission. The apparatus that realizes this process is a communication system, which generally consists of five parts, as shown in Figure 3-4. The information source is the source of the information. For example, a passage of text in a telegram and a sequence of sounds of varying intensity in a telephone call are both information sources. The information from the source is changed by the transmitter into signals that can be transmitted through the channel. In a telegraph, these signals are a sequence of dots and dashes.
and
                       Signal
Source  →  Transmitter  →  Channel  →  Receiver  →  Destination
                                      ↑
                                 Noise source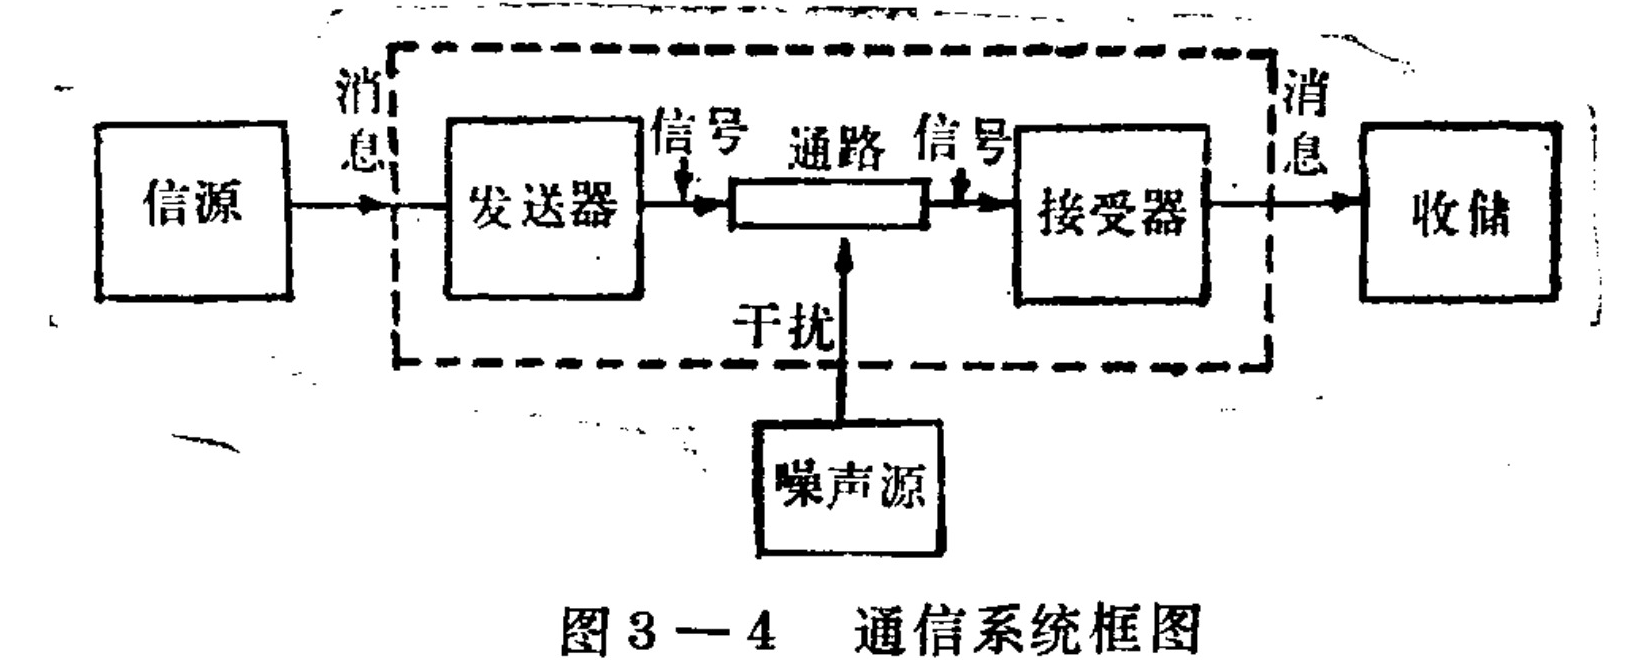
Figure 3-4. Block diagram of a communication system
Translated labels: Source; Message; Transmitter; Signal; Channel; Receiver; Sink; Noise Source; Interference
In telegraphy, it is a sequence of electrical signals composed of dots and intervals; in telephony, it is an electric current of varying strength corresponding to the sound. The channel is the path through which the signal travels from the transmitter to the receiver; in a wired telephone, this is the telephone line. During signal transmission, interference often exists, such as crosstalk in telephones and alternating-current hum in radios. Interference affects the reception of the signal. Here, the interference is considered to be produced by a noise source. The receiver performs the reverse operation of the transmitter, converting the received signal back into a message; for example, a telephone receiver converts the electrical signal back into sound. Finally, there is the recipient, who in telegraphy and telephony is the person receiving the message. On the basis of this communication-system model, several related quantities can be introduced.
First, let us discuss how to measure the information transmitted through a channel—that is, introduce the basic concept of information quantity. Suppose there are two simple information sources, each consisting of two letters. Before the first source sends a letter, we have no idea which letter it will send, or the probabilities of sending the two letters are both 0.5. The other source has one letter—for example, letter A—with a high probability of being sent, 90%, while the other letter B has only a 10% probability. They can be represented by the following expressions:
Source 1: P(A) = 0.5, P(B) = 0.5
Source 2: P(A) = 0.9, P(B) = 0.1
Clearly, the uncertainty of the first source is greater than that of the second source. After the signal is received, the uncertainty disappears. Clearly, after receiving a letter from the first source, the information obtained is greater than that obtained from the second source. If H(X₁) and H(X₂) represent the information quantities of the two sources, then H(X₁) > H(X₂). That is, the first source contains more information than the second source.
The information quantity of a source is measured by its degree of uncertainty. We will now proceed from a concrete example and give the formula for expressing information quantity.
In communication, signals are usually received one after another. What is a reasonable way to measure the information quantity of the signals received? Suppose that two-digit numbers formed by selecting two digits from the three digits {1, 2, 3} are used as the units of transmission. There are nine different combinations in all. Assuming that each number has the same transmission probability, 9 can be taken as the quantity of its uncertainty. After receiving the two-digit number, there is no uncertainty left; thus, 9 can also be regarded as the information quantity of this source. From another perspective, we regard the two digits as a combination of the units digit and the tens digit. When the tens digit is received first, the information quantity, according to the preceding measure, should be 3; then, when the units digit is received, there are also only 3 possible choices, so the information received upon receiving the tens and units digits should be 3 + 3 = 6, rather than 9. The conclusions obtained by the two methods of observation therefore contradict each other. For this reason, instead of taking the number of possible choices as the unit of calculation, we take the logarithm of this number as the unit; then the results of the two calculations agree, because log 9 = log 3 + log 3.
If the transmitted signal is a string composed of n letters, and each letter has m possible values, then the string has a total of N = mⁿ possible forms. The information quantity after receiving a string is therefore
H = log N = log(mⁿ) = n log mThis is the formula for calculating information quantity when all letters have the same probability of occurrence. The formula can be extended to the case in which the letters have different transmission probabilities. For example, if Pᵢ denotes the probability that xᵢ occurs, then its information quantity is
H(P₁, P₂, …, Pₙ) = −Σ Pᵢ log PᵢFor the equal-probability case, one may regard the source as having n letters with equal probability; then
P₁ = P₂ = … = Pₙ = 1/nH = −Σ (1/n) log(1/n) = log nThus, we have obtained the general formula for calculating information quantity in information theory. When the base of the logarithm is 2, the unit of information quantity obtained is the bit.
The concept of information quantity can solve many problems in communication systems. Here, we will discuss its application to coding as an example. With suitable coding, the same channel can transmit more information. Suppose we want to send an English telegram, encoding the signals by switching a circuit on and off. English has 26 letters, and, including the space symbol used to separate English words, there are 27 different possible choices. If every letter has the same probability of occurrence, the information quantity of one letter is H = log 27 (the logarithm is generally taken to base 2); a code, however, has only two choices, so one code unit has log 2 of information. Therefore, to transmit one letter, the code length k must satisfy the following formula:
k log 2 ≥ log 27, therefore k ≥ 4.7This means that at least 5 code units must be received before one can know exactly which letter has been received. However, the probabilities with which English letters occur in English words are not the same. Some letters occur frequently, such as l, t, o, and a, while others occur much less often, such as j, q, and z. We can therefore use shorter codes to represent frequently occurring letters and longer codes for infrequently occurring letters, thereby reducing the average code length; in other words, reducing the transmission time. According to statistical data, the occurrence probabilities of English letters are approximately as shown in Table 3-1, which lists only the ten letters with the highest probabilities. From this, one can calculate that the average code length is
4.3 code units per letterThat is, an average of 4.3 code units can be used to transmit each letter of an English telegram. In this case, the code length is not the same for every letter; this is called nonuniform coding. Because of limited space, we will not list the many other successful applications of the concept of information quantity in communication here.
Table 3-1. Occurrence probabilities of English letters
| Rank | Symbol | Occurrence probability |
|---|---|---|
| 1 | Space symbol | 0.2 |
| 2 | e | 0.105 |
| 3 | t | 0.072 |
| 4 | o | 0.0654 |
| 5 | a | 0.063 |
| 6 | n | 0.059 |
| 7 | i | 0.055 |
| 8 | r | 0.054 |
| 9 | s | 0.052 |
| 10 | h | 0.047 |
The concept of information quantity has a strict definition in communication: it uses the uncertainty of a message as its criterion, and the formula above can calculate it accurately. This information-quantity formula has achieved great success in communication. People have attempted to extend this concept and formula for application to other fields, but often without success. For problems similar in nature to information transmission, applying the foregoing concept and formula may produce meaningful results. Some problems are not essentially communication problems; applying information-quantity calculations mechanically will produce incorrect results. For example, some people calculate information quantities from clinical biochemical-index data and use the results to distinguish between normal and pathological conditions. They assume that a large information quantity means an abnormal condition—in other words, that the greater the differences among these human-body indices (the smaller the information quantity), the more normal the condition is.
In reality, this is not necessarily so. Sometimes the selected indices may happen to agree with this assumption, but more likely they may contradict it. A particular index that is especially high is often an obvious sign of disease. Therefore, when extending the application of the formula, one should analyze the problem carefully. For problems such as disease diagnosis, one should consider the mechanisms of the organism itself and should not apply the formula indiscriminately.
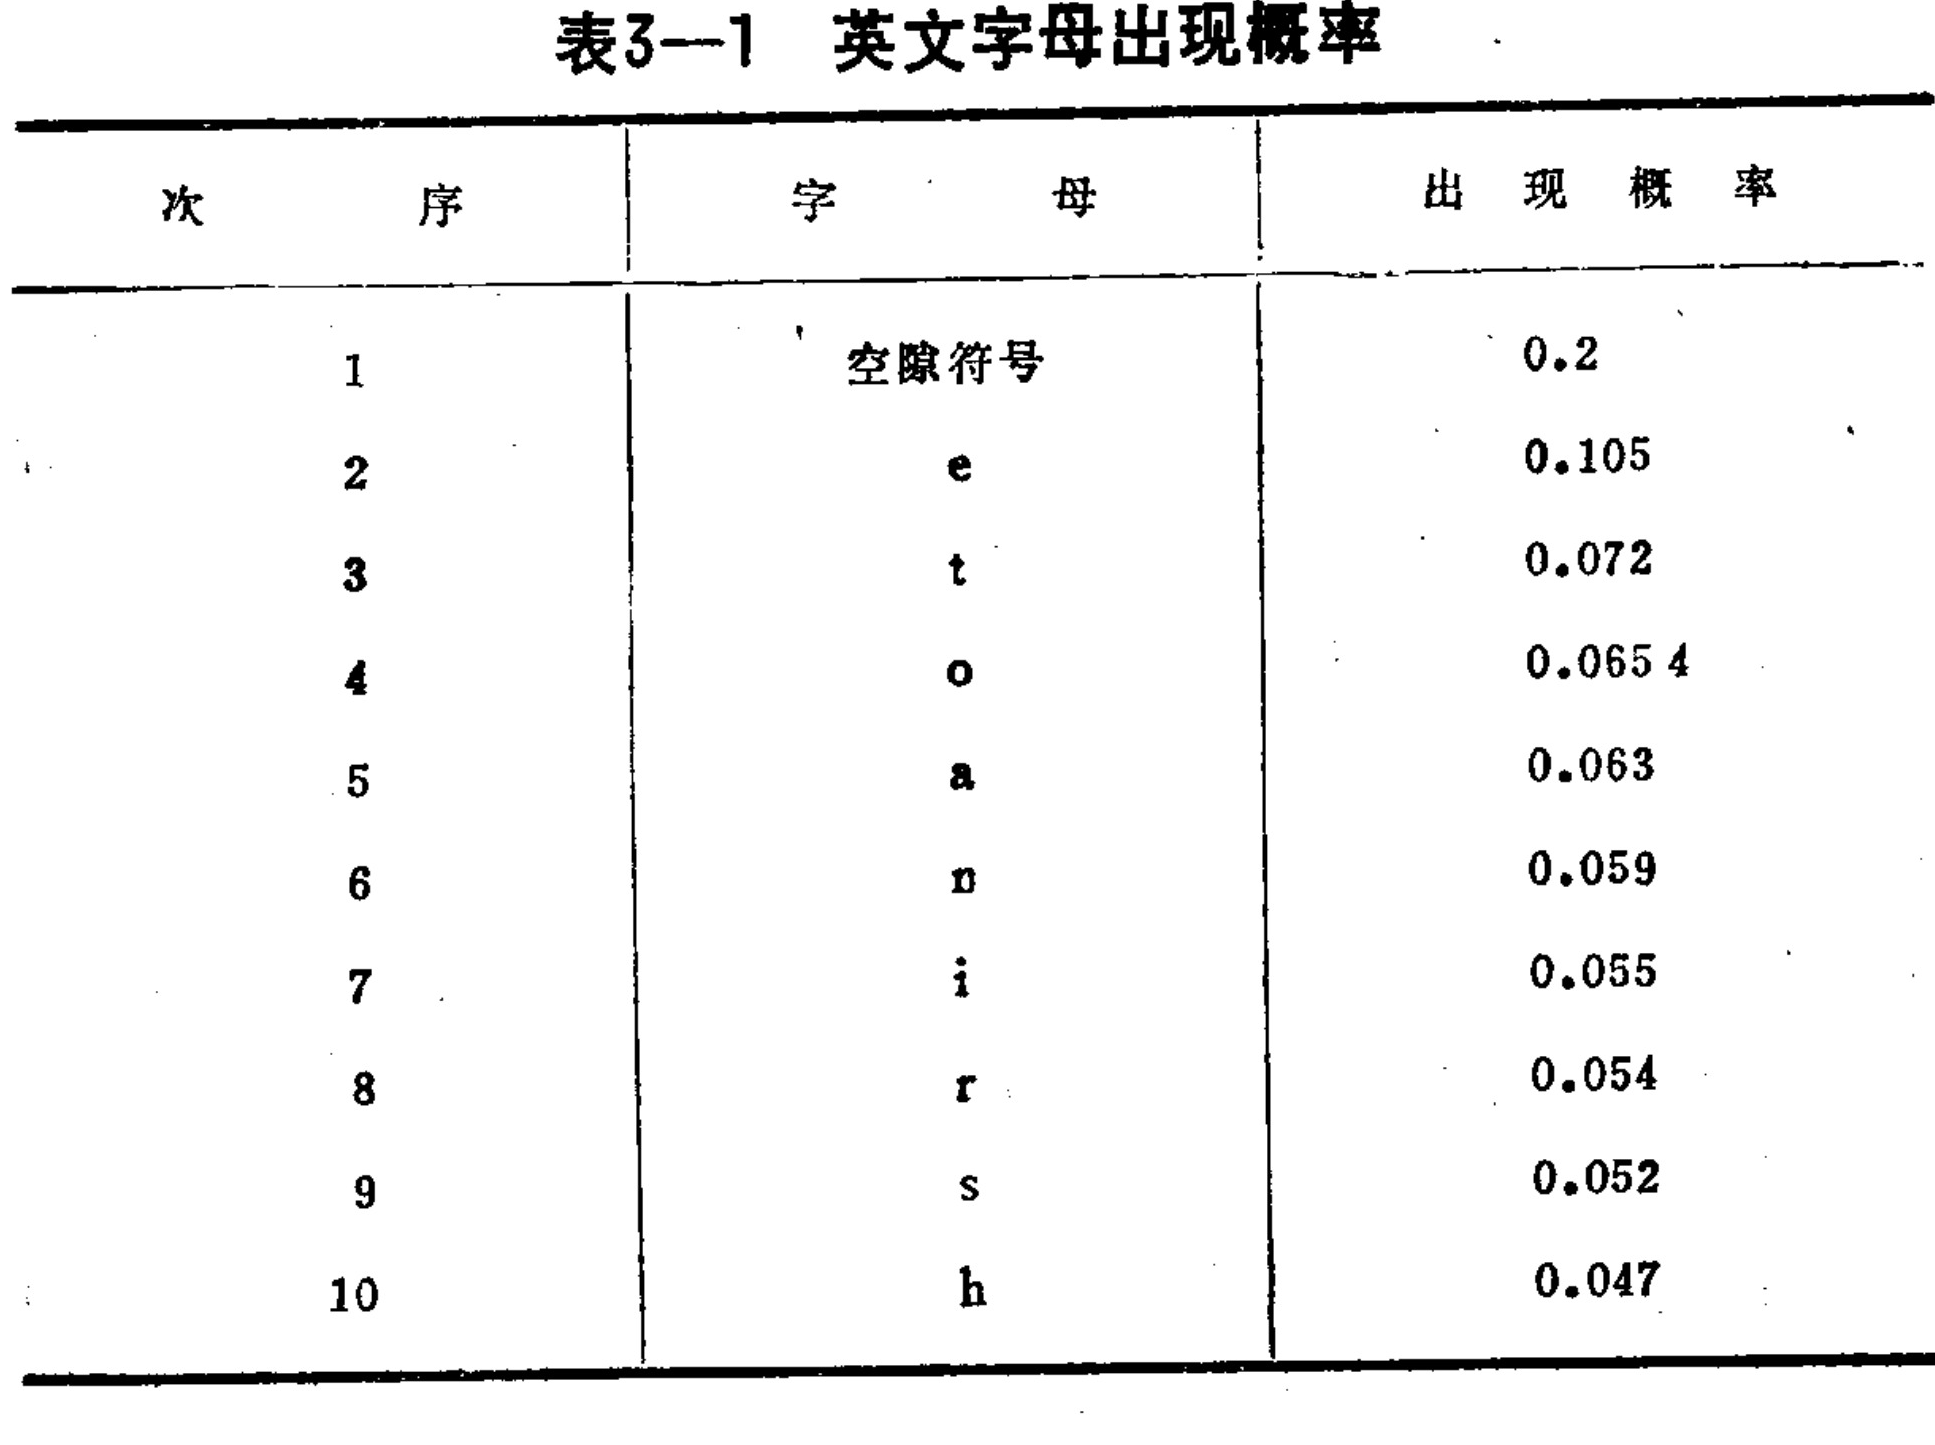
Table 3-1 Frequency of English Letters
Translated labels: Table 3-1 Frequency of English Letters; Order; Letter; Frequency; Space character; e; t; o; a; n; i; r; s; h
4. Black Boxes and Mathematical Models
In order to reveal the laws governing a system’s motion and the quantitative effects of the various units within the system, cybernetics generally uses the method of establishing a mathematical model that reflects the system’s motion. Generally speaking, a mathematical model is a mathematical description of the quantitative relationships among the variables in a system. Once a mathematical model has been obtained, we can solve it—that is, solve the corresponding equations—to obtain the dynamic processes of the variables in the system. The interactions among the units of a system can also be reflected in the mathematical model. For example, the strengths of these interactions may be represented by differences in the coefficients of the equations. Therefore, by changing the coefficients of the equations and solving the corresponding equations, we can obtain the effects of changes in the units and their connections on the various variables of the entire system.
The specific method used to establish a mathematical model is often related to the nature of the system being studied and the purpose of the study. For relatively simple systems, the mathematical equations can sometimes be written directly from the physical, chemical, and other principles governing the system’s motion. For example, when studying the motion of a simple pendulum or the laws governing the motion of a system composed of multiple particles, the equations of motion—and thus the mathematical models—can be obtained by applying principles of mechanics. For a physiological system, in addition to physical and chemical principles, physiological and biochemical laws must also be used to obtain the corresponding mathematical model. However, the objects studied by cybernetics include many extremely complex systems whose internal operating principles are often not yet clear. Under these circumstances, cybernetics developed the black-box principle to address the problem of establishing mathematical models for such systems. The human body, for example, is an extremely complex system; we still have very little understanding of the details of the functional connections among its various parts. Thus, black-box theory has also opened a way for the quantitative study of the human body system.
The so-called “black box” is an objective research object whose specific internal structure we do not know. In cybernetics, it may refer to a system, part of a system, or merely one unit within a system. Because we do not understand its internal structure, we can observe it only from the outside. However, the purpose of cybernetics is to investigate the function of the entire system and the role of each unit within it.
Therefore, we often need not consider the specific structure and function inside the object being studied (the black box); it is sufficient to focus on the external effects acting on it and the effects it exerts on the outside. For a unit, we need only obtain all the influences acting on it, as well as the range of its effects and the relationships among them. In other words, the focus is on establishing the quantitative relationship between its inputs and outputs. For example, if we want to study the effect of a unit on the entire system, once we know the quantitative relationship between its inputs and outputs, we can connect it with the mathematical models of the other parts of the system, obtain a mathematical model of the entire system, and thereby solve for its effect on the entire system. As long as its quantitative input-output relationship is the same, its effect on the entire system is always the same, regardless of whether its internal structure is complex or simple. Just as we cannot distinguish between two boxes of the same shape and size: when the objects they contain have the same weight, the problems encountered in loading, unloading, and transporting them are the same, regardless of whether the objects themselves are identical. Or, in ordinary terms, a black box is a box that cannot be—or has no way to be—opened. Therefore, for system analysis, mathematical models with the same input-output relationship are equivalent. The black-box method is a method of studying a system externally, through the relationship between its inputs and outputs.
The black-box method provides us with an effective means of quantitatively studying complex systems whose internal structures and functions are not yet clear. We generally determine the mathematical model of a black box experimentally. For any object under study, we should know what factors can affect its motion—in other words, what inputs (or input points) it has. In addition, we must know what effects it can produce, that is, what outputs it has. We can therefore apply a specific input quantity at the input points and observe its output, thereby determining the mathematical model that describes the relationship between the object’s outputs and inputs—the black-box model. The specific methods will be discussed below.
Human understanding of things is always deepening. In relation to any particular thing, we move from knowing very little, through gradually increasing knowledge, to a deeper understanding. Thus, at the beginning, a thing is always a black box: we have no understanding at all of its internal processes. Through research, we may come to understand one part of it. That is equivalent to opening part of the black box, while the parts we do not understand remain black boxes. The process by which humanity comes to understand nature and society is, in reality, a process of continually opening black boxes and then encountering black boxes at the next level. In this way, people continually deepen their understanding of nature and society.
This process of understanding nature and society will never be complete. Black-box theory allows us to conduct quantitative research on a system at our current level of understanding, rather than having to wait until its internal structure and functions have been revealed before analyzing its overall characteristics and its effects on surrounding things. This is important for the study of qigong. Qigong involves extremely complex regulatory and control processes in the human body, and at present we know very little about these processes. Therefore, on the basis of what is already understood, we can apply the black-box method to establish a corresponding model and begin quantitative analysis and research, obtaining valuable results. As our understanding of the human system deepens, we can further improve the model so that the new model more fully reflects the actual processes of qigong.
The black-box method also has some limitations. Because we establish the characteristics of the object under study only from the relationship between its outputs and inputs—that is, characterize the object from its external features—we overlook differences in its internal structure and function. Yet objects with the same external characteristics may have very different internal structures and functions. Therefore, we cannot expect the black-box method to provide an understanding of internal structure and function. And internal structure and function are often precisely what we want to know. Nevertheless, external characteristics are the outward expression of an object’s internal structure and function, so the results obtained through the black-box method may provide clues for gaining a deeper understanding of them.
For example, in research on the effect of acupuncture on the blood-pressure regulation system, we first used the black-box method and, through experiments, established that acupuncture indeed improved the dynamic characteristics of the blood-pressure regulation system. Although at that point we could not determine which specific structures of the system were affected by acupuncture, analysis of the improvement in its dynamic characteristics showed that the main effect was on the short-term regulatory process. This suggested that we should conduct further experiments on the pressure-feedback regulatory circuit. In this way, it was determined that at least part of acupuncture’s effect is achieved through the carotid-sinus feedback circuit. In open-loop experimental analysis of the pressure-feedback circuit, this suggested that the central nervous system might be the main site of action. Thus, by beginning with the black-box method, we can gradually deepen our understanding of this regulatory process.
The purpose of establishing a mathematical model is to solve problems in a system. The mathematical model established varies with the nature of the research problem, the goal of the study, and the practical conditions available. The same research object may have several different mathematical models. In cybernetics, mathematical models can be classified from different perspectives. According to whether it is necessary to understand the internal structure, they can be divided into nonparametric (black-box) models and parametric models. A nonparametric model reflects only the external characteristics of the object, whereas in a parametric model, some characteristics of the internal structure are reflected by the parameters of the mathematical model.
Models can also be classified according to their mathematical properties and degree of complexity. For example, they can be divided into linear and nonlinear models. If the variables in a system have linear relationships, a linear model can be used to represent them; otherwise, a nonlinear model should be used. Linear models can use the superposition principle, and are much easier to solve than nonlinear models. Models can also be divided into time-varying and time-invariant models; the parameters of a time-varying model change with time, while in a time-invariant model the parameters are constant. There is also a distinction between stochastic and deterministic models. In a stochastic model, random factors are present: the state of the system is not solved as a determinate value, but takes values according to a certain probability distribution. The classifications above can be combined with one another to form different subclasses. Clearly, a linear, time-invariant, deterministic model is the simplest. Algebraic equations, matrices, and other methods can be used to solve it, and it is easier to study than the other types of models. Other types of models often require relatively complex mathematical tools and are not easy to solve.
Nonparametric models are generally obtained through experiments. Usually, an input signal of a specific form is applied to the system under study, and the corresponding system output is then recorded, thereby determining (or calculating) the characteristics of the system. Common forms of input signal include impulse signals (short-duration, large-amplitude signals), the unit-step function, sine waves, white noise, and pseudorandom-code signals. The output produced by an impulse signal is called the impulse response, while the output produced by a unit-step input is called the unit-step response. Impulse and unit-step inputs are the easiest to generate. However, these signals can interfere with the system’s original operation. When the system exhibits adaptive behavior—as biological systems often do—correct results cannot be obtained. Sine-wave signals can avoid adaptation, but they require separate experimental inputs of sine waves at many different frequencies, which is time-consuming; they also cannot be used for systems that change rapidly over time. White-noise or pseudorandom-code signals can overcome the difficulties above to a certain extent. In cybernetics, nonparametric models are commonly represented by the impulse response or the transfer function. The calculation of the transfer function will be discussed in the next section.
Nonparametric models cannot express the characteristic features of a system’s internal structure or changes in that structure. But there are still many
To solve many problems, we need to clarify the internal structure and its changes. For example, in diagnosing a disease, it is not enough to know only that a patient’s physiological system is abnormal; we also want to understand the specific location of the lesion in order to treat it effectively. Therefore, it is necessary to establish a parameter model of the relevant system and, through system-identification methods, obtain the parameter data of that system. In this way, information about the system’s internal structure and its changes can be obtained. When establishing a parameter model, one can usually write the equations of motion corresponding to the various processes on the basis of known physiological and biochemical data, as well as the physical and chemical laws governing the processes. Considering the interrelationships among the processes yields the corresponding mathematical model. The actual process may be very complex and may include many nonlinear relationships. To make parameter identification and solution easier, linearization can be carried out near the operating point, producing a linear parameter model. Sometimes the analysis of linearized models at different operating points can be used to examine the nonlinear behavior of the system. A model derived from the actual process may include many variables and be a high-order differential (or difference) equation, but not all variables have equally important effects on the system. It is often possible to simplify the model by ignoring secondary factors or secondary variables, making the model easier to solve. Model reduction can use methods such as retaining the principal modes (dominant eigenvalues), projection, model degeneration, and perturbation. Order reduction seems preferable: it enables the simplified model to retain a certain isomorphic relationship with the actual system, with each parameter having a corresponding physical or physiological meaning. Of course, a simplified linear model is only a preliminary approximation of the actual system.For a dynamic system (or component), the situation is more complicated, but the above representation can be generalized: usually, the transfer function is defined as the ratio of the Laplace transform of the output signal to the Laplace transform of the input signal as a function of time, commonly denoted by W(S). The transfer function is suitable for studying linear systems; there is a corresponding relationship between the transfer function and the corresponding linear differential equation.ded as an impulse input, represented by A(δ). If blood pressure is represented by X, the system equation is:
ω²Ẍ + 2ξẊ + X = A(δ)
Here, Ẍ and Ẋ respectively denote the second- and first-order derivatives of X. ξ and ω are its parameters.
BP (mmHg) 130 120 110
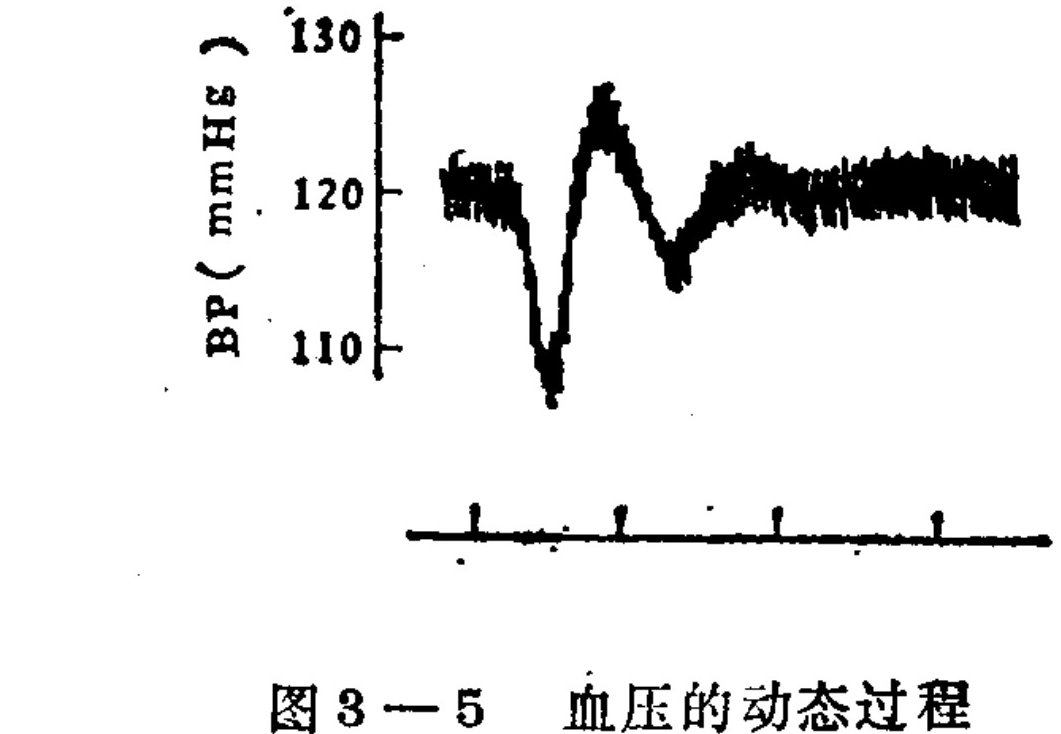
Figure 3-5. The dynamic process of blood pressure
Translated labels: BP (mmHg): Blood Pressure in mmHg; 110, 120, 130: Vertical axis scale values
The Laplace transform is a mathematical transformation, with the transformation formula:
H(s) = ∫₀^∞ h(t) · e^(−st) dt
That is, a function of t (which may be time) is transformed by the above formula into a function of s. A linear ordinary differential equation in t (the time domain), after the Laplace transform, becomes an algebraic equation in the s domain and is therefore easy to solve. After obtaining the result in the s domain, one can use the inverse Laplace transform to return to a function of t. The inverse Laplace-transform formula is:
f(t) = (1/2πi) ∫_{c−j∞}^{c+j∞} F(s) e^(st) ds
In practice, Laplace-transform tables are commonly used to convert between time functions and their corresponding Laplace transforms.
values determine the waveform of the blood-pressure dynamic process. Applying the Laplace transform to the equation gives:
ω²s²X(s) + 2ξsX(s) + X(s) = A(s)
The transfer function is the ratio of the output X(s) to the input A(s). Thus:
W(s) = X(s)/A(s) = 1/(ω²S² + 2ξω + 1)
This gives the transfer function from cessation of respiration to blood pressure.
A system can be decomposed into many components (or elements). The transfer function of each element can be found separately and then combined to form the system transfer function. A transfer function is a characteristic of the system (or element) itself and is independent of the form of the input. Moreover, after the Laplace transform, differential relationships become algebraic relationships, so the system transfer function can readily be obtained from the transfer functions of its elements by algebraic operations. The typical elements commonly found in control systems, together with their transfer functions and their output curves for a unit-step input, are listed below.
(1) Proportional element: the output is proportional to the input (Figure 3-6).
X = K·U
W(s) = X(s)/U(s) = K
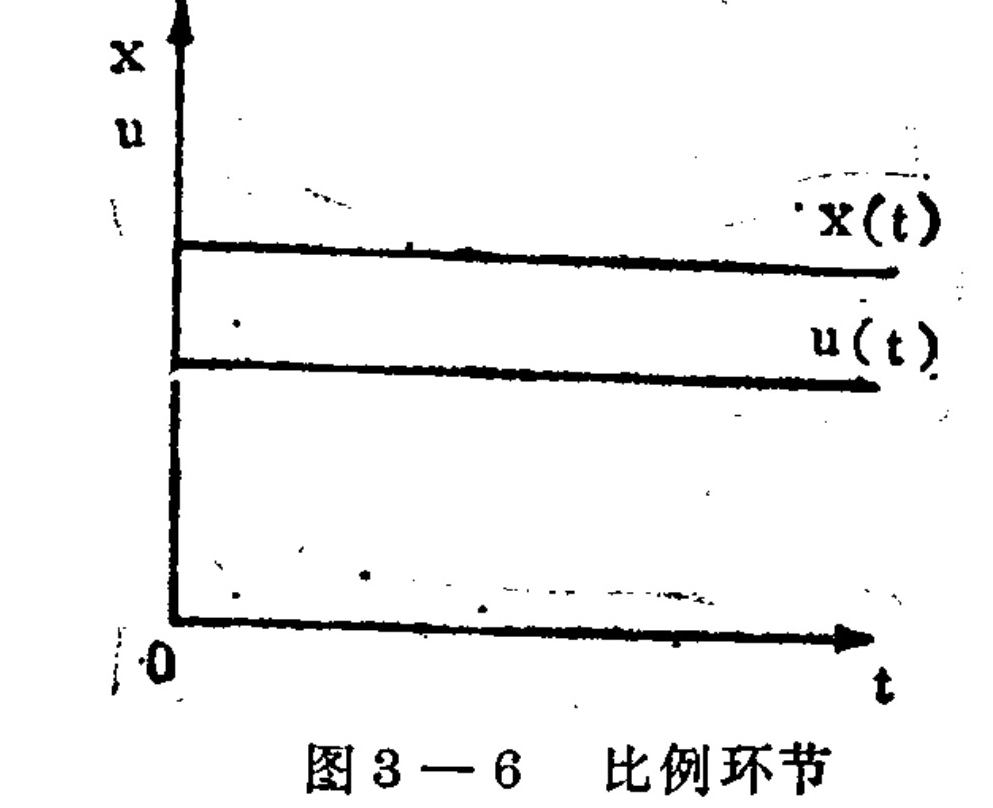
Figure 3-6. Proportional element. Graph labels: vertical axis x/u; horizontal axis t; output x(t); input u(t); origin 0.
Translated labels: x; u; t; 0; x(t); u(t); Proportional element
(2) Differentiating element: the output is the derivative of the input (Figure 3-7).
x = K·du/dt
W(s) = X(s)/U(s) = K·sU(s)/U(s) = K·s
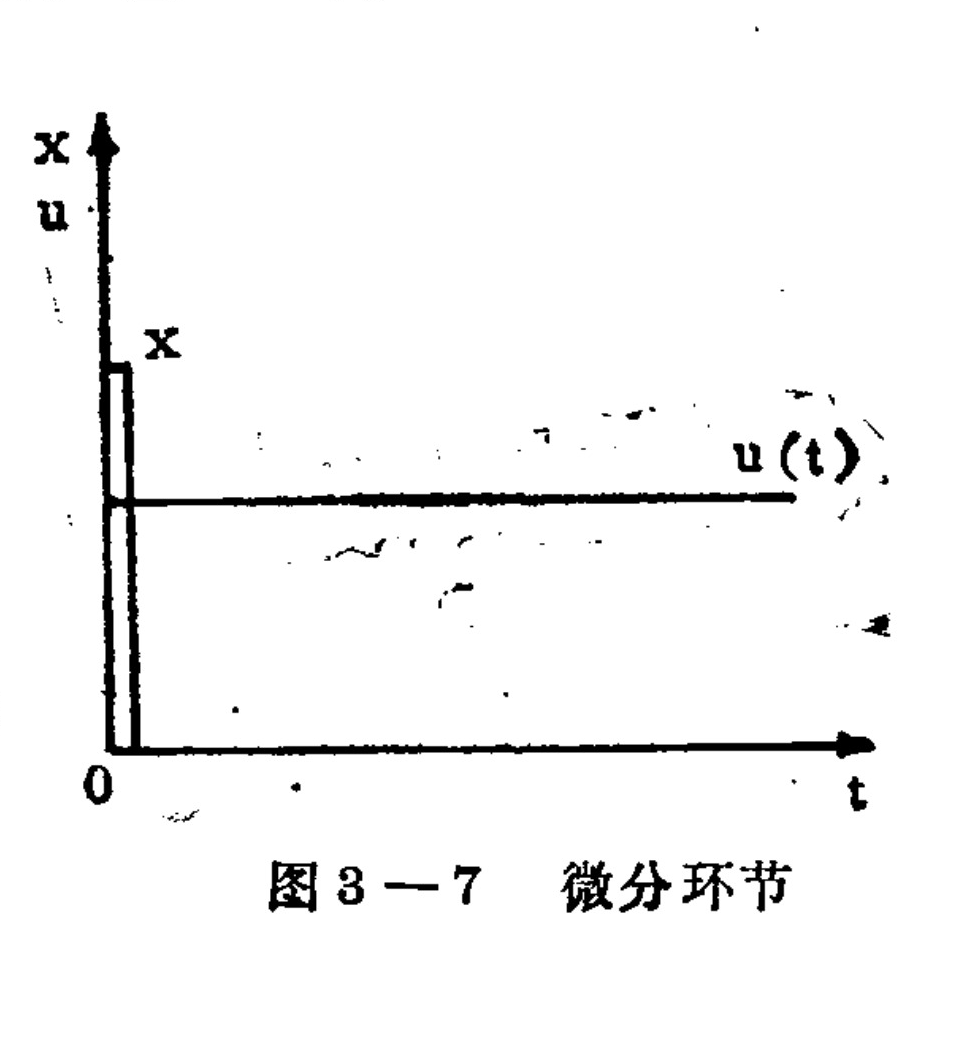
Figure 3-7. Differentiating element. Graph labels: vertical axis x/u; horizontal axis t; impulse output x at t = 0; step input u(t); origin 0.
Translated labels: x: vertical axis label; u(t): step input signal; t: horizontal axis label
(3) Integrating link: the output is the integral of the input (Figure 3-8).
[ x=\int u,dt ]
[ W(s)=\frac{X(s)}{U(s)}=\frac{X(s)}{sX(s)}=\frac{1}{s} ]
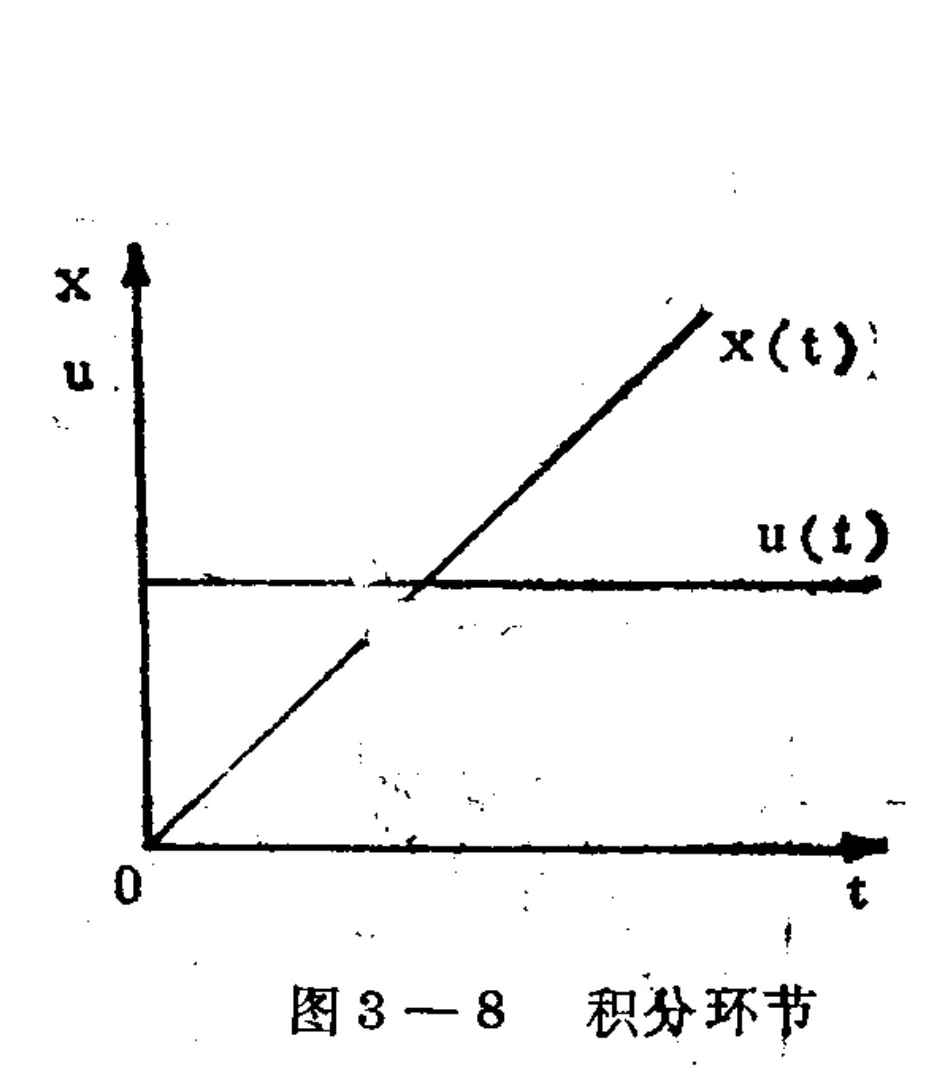
Figure 3-8. Integrating link
Translated labels: x, u; t; 0; x(t); u(t)
(4) Delay (lag) link: the output lags behind the input by a time T (Figure 3-9).
[ x(t)=u(t-T) ]
[ W(s)=\frac{X(s)}{U(s)}=\frac{U(s)e^{-Ts}}{U(s)}=e^{-Ts} ]
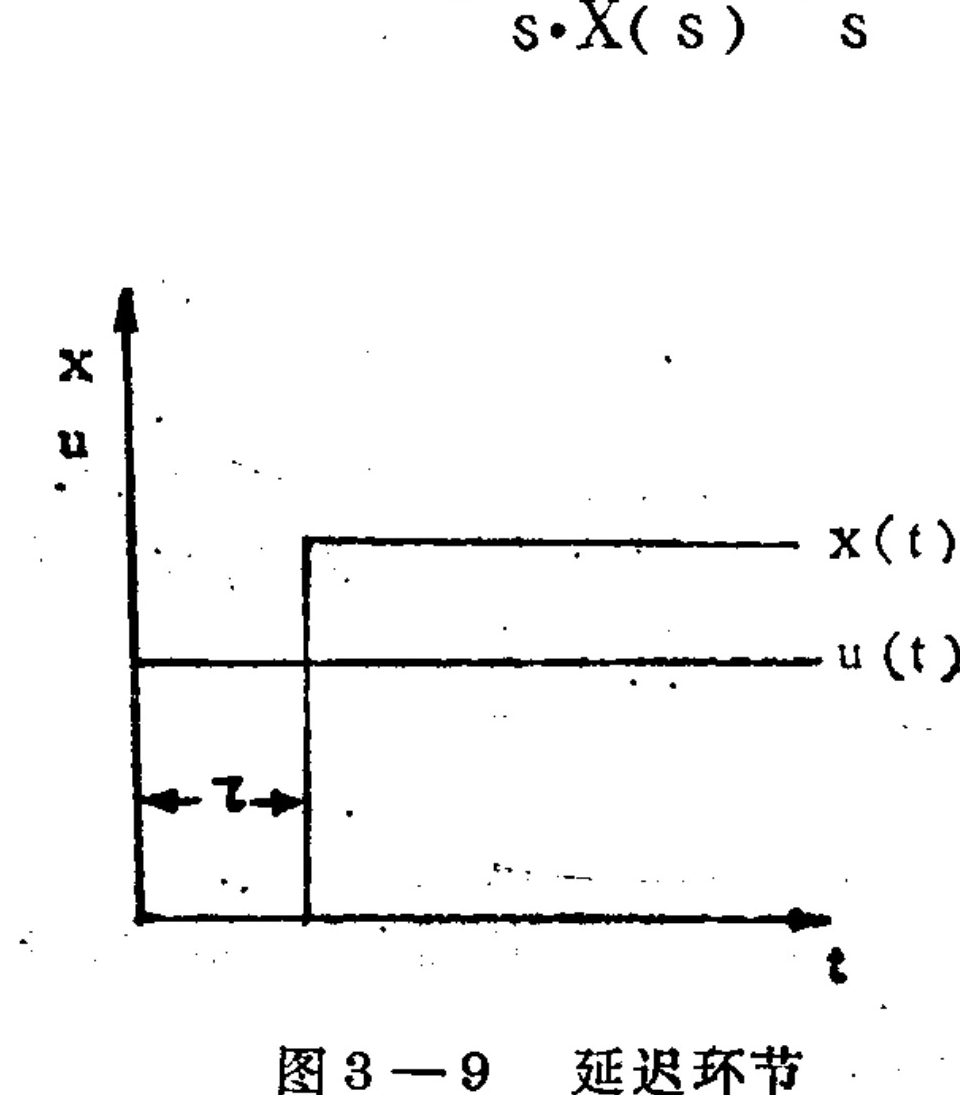
Figure 3-9.
Translated labels: x; u; t; x(t); u(t); tau
(5) Inertial link (Figure 3-10).
[ T\frac{dx}{dt}+x=Ku ]
[ W(s)=\frac{X(s)}{U(s)}=\frac{K}{Ts+1} ]
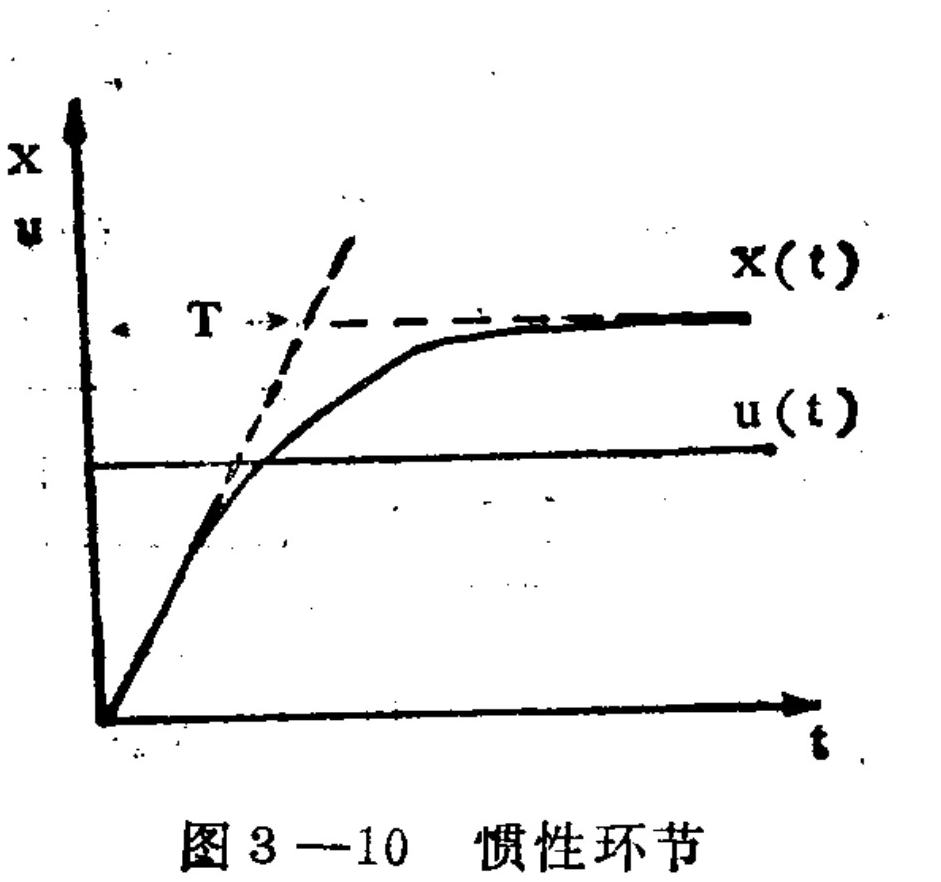
Figure 3-10. Inertial link
Translated labels: x; t; x(t); u(t); T
(6) Oscillatory (second-order) element (Figure 3-11).
T² dx/dt + 2ξT dx/dt + x = Ku
W(s) = K/(T²s² + 2ξTs + 1)
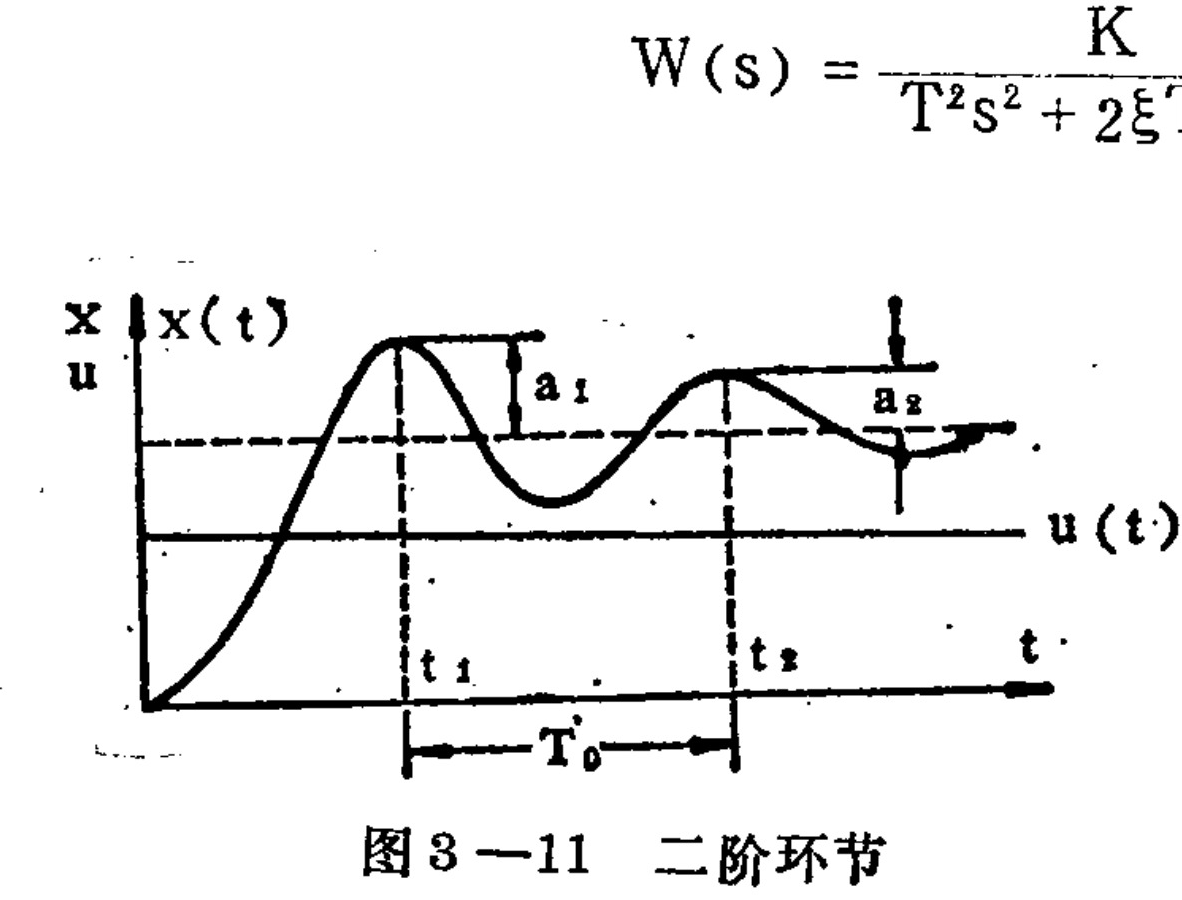
Figure 3-11. Second-order element. Graph labels: vertical axis x/u; horizontal axis t; response x(t); step input u(t); marked times t₁ and t₂; interval T₀; deviations a₁ and a₂.
Translated labels: W(s): Transfer function; x(t): Response curve; t: Time axis; a1, a2: Overshoot amplitudes; t1, t2: Peak times; T0: Oscillation period
When the elements are connected with one another in parallel or in series, the overall transfer function can readily be obtained by algebraic operations.
When two elements are connected in series, the input of the following element is the output of the preceding element. The overall transfer function is then the product of the two transfer functions:
W(s) = X₂(s)/U(s) = [X₂(s)/X₁(s)]·[X₁(s)/U(s)] = W₂(s)·W₁(s)
When two elements are connected in parallel, the two elements have the same input and their outputs are added (see Figure 3-12); the overall transfer function is the sum of the two transfer functions:
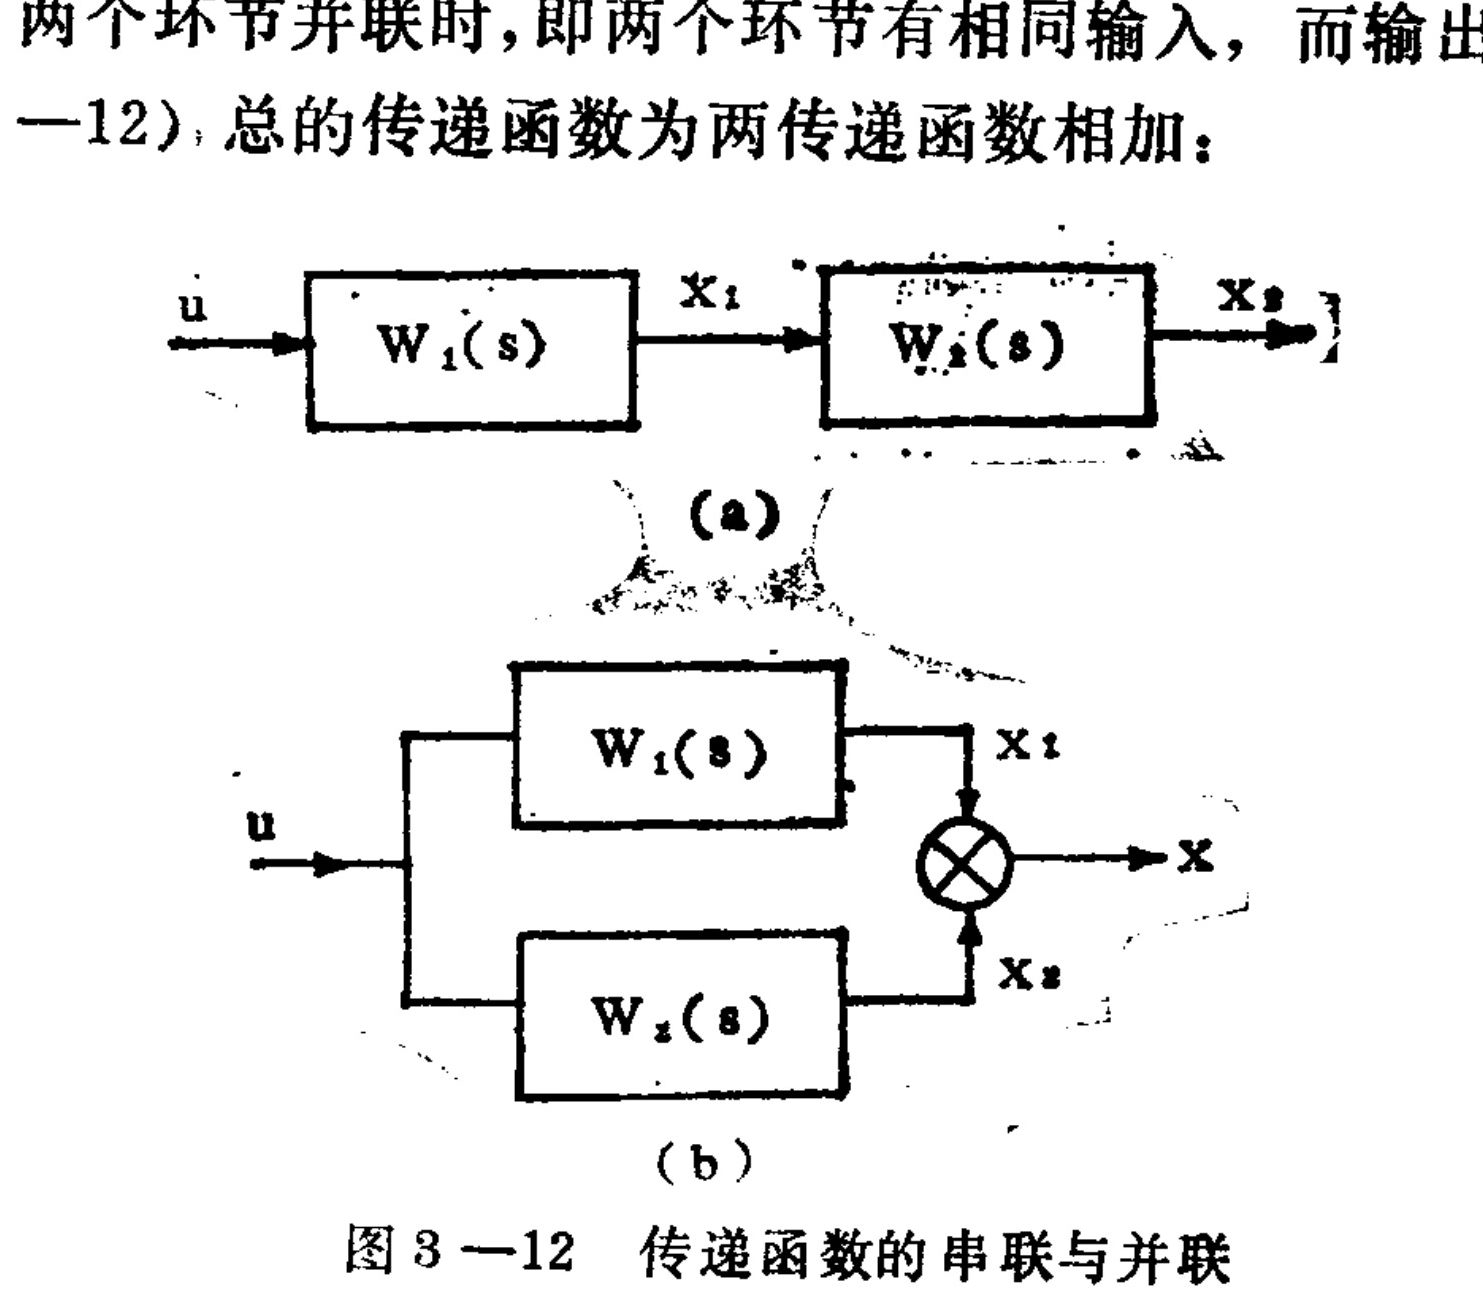
Figure 3-12. Series and parallel connections of transfer functions. (a) Series: u → W₁(s) → X₁ → W₂(s) → X₂. (b) Parallel: u branches to W₁(s) and W₂(s); their outputs X₁ and X₂ enter a summing junction, producing x.
Translated labels: (a); (b); W1(s); W2(s); x1; x2; x; u
[ W(s)=\frac{X(s)}{U(s)}=\frac{X_1(s)+X_2(s)}{U(s)}=W_1(s)+W_2(s) ]
For systems containing multiple parallel and series connections, the corresponding overall system transfer function can likewise be obtained by the same algebraic method.
The transfer function of a feedback system can also be obtained by a similar method. Figure 3–13 is a block diagram of a simple feedback system. If the transfer function of the controller is known to be (W_1(s)), the transfer function of the controlled object is (W_2(s)), and the transfer function of the feedback element is (W_3(s)), then:
[ E(s)=U(s)-W_3(s)X(s) ] [ X(s)=W_1(s)W_2(s)E(s) ]
After algebraic manipulation to eliminate the (E(s)) term, we obtain:
[ W(s)=\frac{X(s)}{U(s)}=\frac{W_1(s)W_2(s)}{1+W_1(s)W_2(s)W_3(s)} ]
For direct feedback, that is, when the transfer function of the feedback element is 1:
[ W(s)=\frac{W_1(s)W_2(s)}{1+W_1(s)W_2(s)}=\frac{W_G(s)}{1+W_G(s)} ]
(W_G(s)=W_1(s)W_2(s)) is the transfer function after feedback has been opened, called the open-loop transfer function. (W(s)) is the transfer function with feedback, called the closed-loop transfer function. The closed-loop transfer function can be obtained from the open-loop transfer function by the above formula.
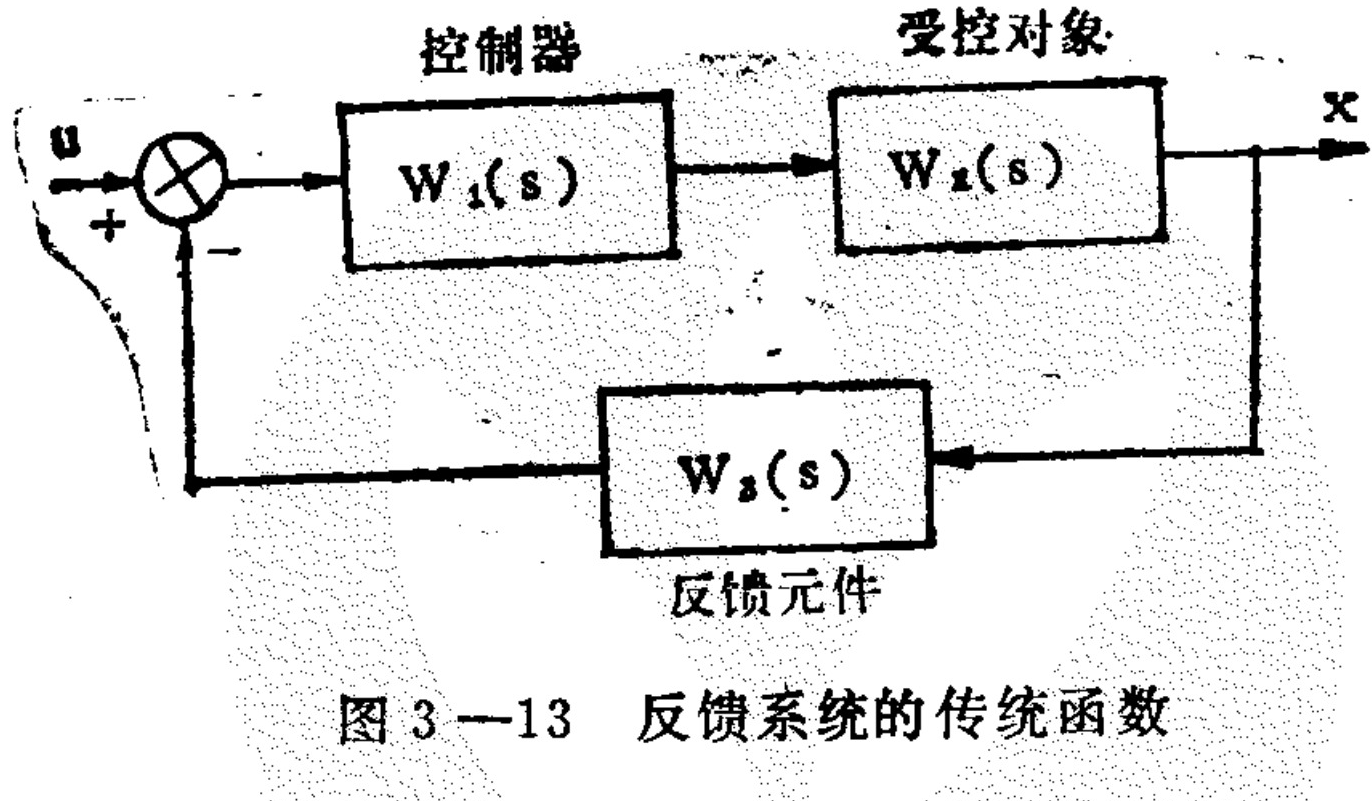
Figure 3–13. Feedback system
Translated labels: Controller; W1(s); Controlled Object; W2(s); x; W3(s); Feedback Element
In many cases—for example, most biological systems—the transfer function of an element or system cannot be obtained by analysis or theoretical derivation. In such cases, experimental methods can be used to determine it.
Control theory has established a method for obtaining a transfer function from an open-loop frequency-response experiment and then using it to determine the stability of the closed-loop system. The frequency response is the characteristic behavior of a system under sinusoidal input. Sinusoidal waves of different frequencies, with a specified amplitude, are used successively as inputs. At the output, the corresponding outputs of different frequencies can be recorded; their amplitudes and phases differ from those of the input. If the input amplitude remains unchanged, the amplitude and phase of the output sine wave vary with frequency. If the input amplitude is taken as 1 and the phase angle as 0, then, for each frequency, the resulting output amplitude and phase angle are listed as follows:
| Frequency ω | ω₁ | ω₂ | ω₃ | … | ωₙ |
|---|---|---|---|---|---|
| Amplitude A | A₁ | A₂ | A₃ | … | Aₙ |
| Phase ψ | ψ₁ | ψ₂ | ψ₃ | … | ψₙ |
The above data are plotted in polar coordinates and the points are joined into a curve, as shown in Fig. 3–14. This is called the frequency-response curve. If logarithmic scales are used to plot the relationships between amplitude, phase, and frequency, it is called a logarithmic frequency response. The frequency response of a linear system corresponds to its transfer function. One can be obtained from the other. Substituting (s=j\omega) into the transfer function gives (W(j\omega)), which is the analytic expression of the frequency response.
For an inertial element, (W(s)=\frac{K}{Ts+1}), its corresponding frequency response is (W(j\omega)=\frac{K}{j\omega T+1}=\frac{K}{\sqrt{1+\omega^2T^2}}e^{-j\omega}), with (\psi=\tan^{-1}\omega T). That is, when a sinusoidal input with angular frequency (\omega) is applied to the inertial element, the relationship between the output amplitude and frequency is (K/\sqrt{1+\omega^2T^2}), which decreases as the frequency increases. (\psi=\tan^{-1}\omega T) causes the phase lag to increase as the frequency increases.
Conversely, the corresponding transfer function can also be obtained from the frequency response.
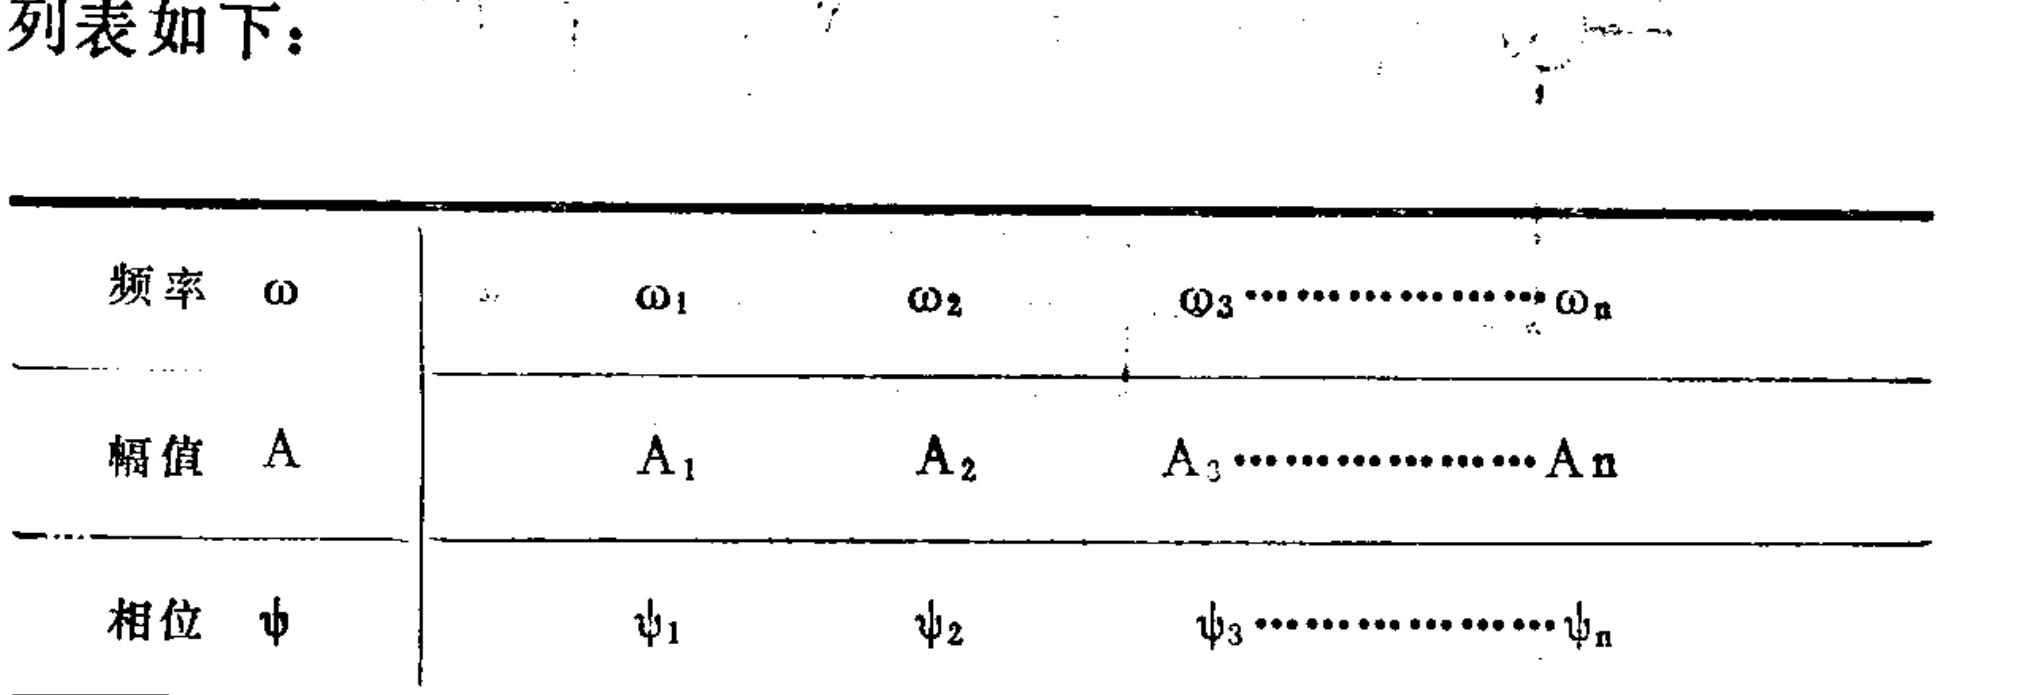
A table listing frequency components with their corresponding amplitudes and phases.
Translated labels: Frequency ω; ω₁, ω₂, ω₃…ωₙ; Amplitude A; A₁, A₂, A₃…Aₙ; Phase ψ; ψ₁, ψ₂, ψ₃…ψₙ
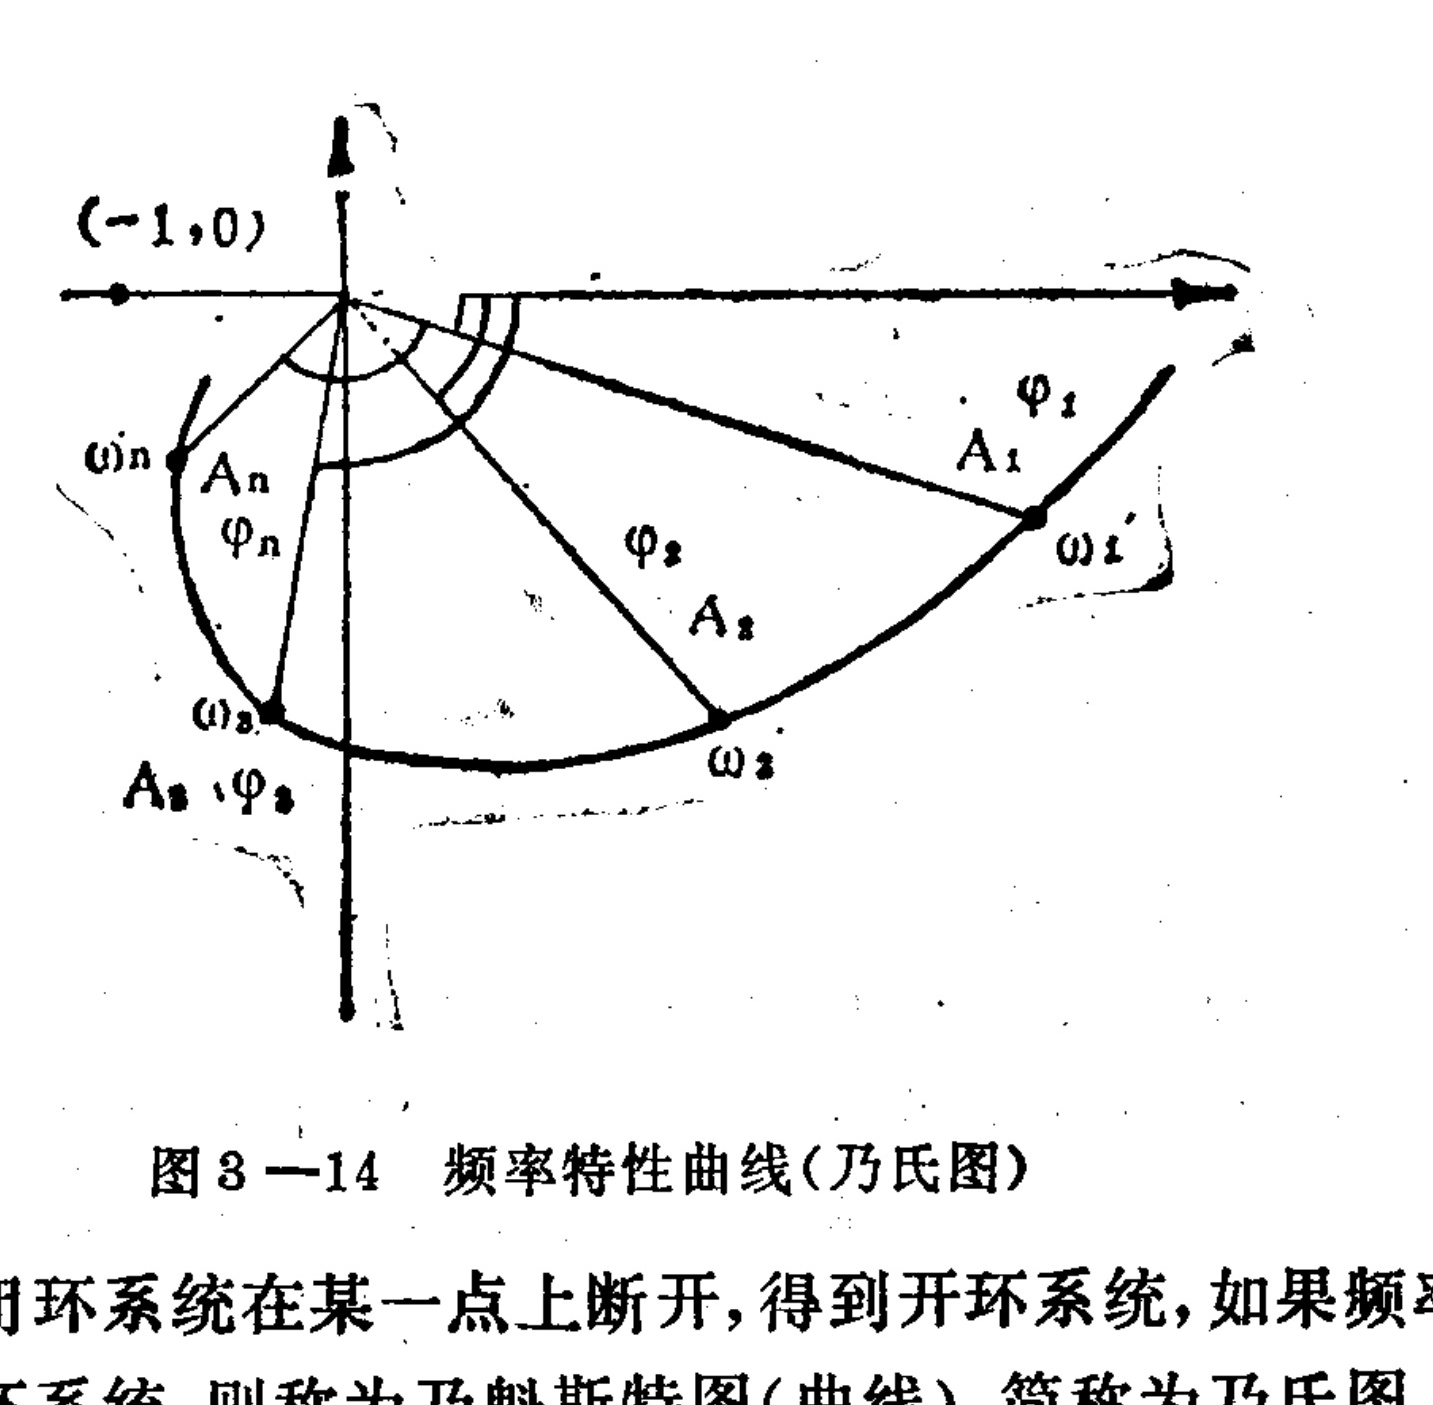
Figure 3–14. Frequency-response curve (Nyquist plot)
Translated labels: -1, 0; ; ; ; ; ; ; ; ; ; ; ;
If a closed-loop system is disconnected at one point, an open-loop system is obtained. When the frequency-response curve of this open-loop system is plotted, it is called a Nyquist diagram (or Nyquist curve), abbreviated as a Nyquist plot. It has been proved that, for a single-loop system, if the Nyquist plot does not enclose the point ((-1,j0)), the closed-loop system is stable. Conversely, if the Nyquist plot encloses the point ((-1,j0)), closing the loop will cause the system to become unstable. Open-loop frequency-response testing has been used not only to debug and correct industrial regulating systems, but also to study biological systems. Open-loop frequency-response tests have been conducted on the adrenal-cortical-hormone system, motor-control systems, blood-pressure-regulation systems, the respiratory system, the pupil-control system, and others. This method has been used to obtain transfer functions or analyze the stability of closed-loop systems.
The transfer-function and frequency-response methods are applicable only to the analysis and synthesis of linear systems; they generally cannot be applied to nonlinear systems.
VI. State Equations and Modern Control Theory
In the early stages of control-theory development, frequency responses and transfer functions were used primarily as tools for studying and solving the analysis and design problems of control systems. This method is now called classical control theory. Beginning in the 1960s, developed alongside electronic computers, missile technology, and space technology. It gave rise to a control theory that described systems by state equations and took optimal control as its goal; this was called modern control theory.
A state is the smallest set of variables that can completely describe the dynamics of a system. A state equation is the quantitative relationship among these states. Solving a system’s state equations is a description of the dynamic process of that system. It can generally be represented by a set of differential (or difference) equations. To make this easier to understand, we will start with a practical system. Taking the thyroid-hormone regulation system as an example, we can explain how state equations are used to describe a system. Clearly, a state equation is also a mathematical model of a system.
We consider only the principal factors in this regulatory system. Let the concentration of thyroid hormone be x₃, the concentration of thyroid-stimulating hormone be x₂, and the concentration of thyrotropin-releasing factor be x₁. Once these concentrations are known, the condition of the system is completely determined. Thus, these concentrations are the states of this system. To make the relationships among the variables in the system linear, each variable is taken as its deviation from its basal value. From knowledge of the physiological process, we obtain the following relationships among the variables; that is, the state equations are:
dx₁/dt = −K₁₁x₁ + 0 − K₁₃x₃ + S₁

dx₂/dt = K₂₁x₁ − K₂₂x₂ − K₂₃x₃ + S₂

dx₃/dt = 0 + K₃₂x₂ − K₃₃x₃ + S₃
The first equation indicates that when thyroid hormone x₃ and the releasing factor x₁ increase, the release rate of the releasing factor decreases. That is, x₃ has a negative feedback effect. The other two equations are similar. The quantities K₁₁, K₁₃, K₂₁…K₃₃ etc. are constants. The quantities S₁, S₂, and S₃ are respectively the basal secretion rates of the releasing factor, the stimulating hormone, and the hormone.
For simplicity of notation, state equations are often written in matrix form:
Ẋ = AX + BUwhere
        x₁             S₁
X =     x₂       U =   S₂
        x₃             S₃

        −K₁₁   0      −K₁₃       1 0 0
A =      K₂₁  −K₂₂    −K₂₃   B =  0 1 0
          0    K₃₂    −K₃₃       0 0 1
Ẋ represents the time derivative of X.
This form of the state equation can describe a large class of linear systems. Their differences are expressed only in the differences in A and B. In many cases, the state variables cannot be measured directly. The system output is the quantity that we can observe. In a linear system, the output Y may be a linear function of the state X and the input U:
Y = CX + DUThus, we obtain the standard state-equation form used in modern control theory:
Ẋ = AX + BU
Y  = CX + DU
Many practical processes can be described by these equations. For example, in describing a medical process, the state X can represent variables describing the functional condition of the organism, such as blood flow, core body temperature, total blood volume, and intracellular and extracellular fluid volumes. The output Y can consist of data about the organism’s condition that can be measured directly, such as urine volume, blood pressure, and heartbeat. The control input U consists of various drugs or other therapeutic measures. A, B, C, and D reflect the relationships among the variables; they are called the system’s parameters and matrices. For a linear system, the parameter matrices determine the properties of the system.
On the basis of these state equations, modern control theory has established a series of concepts and methods for studying control systems. For a control system, whether the control action applied to it can achieve the intended purpose is a fundamental question. Modern control theory developed the concept of controllability. Controllability means asking whether, for the system described by the state equations above, one can find (or select) a control U that enables the system to go from any initial state X
(t₀) = X₀ to any state X(t₁) = X₁ within a finite time. If such a U exists, the system is controllable.
Another important concept is observability. Observability means asking whether we can completely determine all the states of a system from the system output Y measured over a certain period. If we can, the system is observable; otherwise, it is unobservable.
These two basic concepts are also extremely important for medical processes. If a medical process is controllable, we may be able to find suitable drugs or treatment methods to restore the patient’s health. If a medical process is observable, we can completely determine the internal condition of the patient’s organism from the measurements Y already available; in other words, we can make a definite diagnosis. Unfortunately, the number of state variables determining the human body is very large, and many of their interrelationships are still unclear; the state equations cannot be written, the therapeutic means available for control are still limited, and the measurement methods for body parameters are still insufficient; the dimension of Y is far smaller than that of X. Therefore, even when the state equations can be written and the system is linear, it is difficult to satisfy the conditions of controllability and observability. In other words, under present conditions, diagnosis and treatment of disease cannot achieve one-hundred-percent success.
For linear constant-coefficient systems, the relationship among controllability, observability, and the parameter matrices has already been established. If a system has n states, that is, if X is an n-dimensional vector, then B is an n×m matrix, and:
rank [ B | AB | A²B | ··· | Aⁿ⁻¹B ] = nWhen the above condition is satisfied, the system is controllable.
rank [ Cᵀ | AᵀCᵀ | (Aᵀ)²Cᵀ | ··· | (Aᵀ)ⁿ⁻¹Cᵀ ] = nThe superscript T denotes the transpose of the matrix.
When this condition is satisfied, the system is observable. Therefore, in this case, it is easy to determine from the known A, B, and C whether the system is controllable and observable.
Modern control theory is, in principle, suitable for studying complex multivariable systems. Owing to the rapid development of electronic computers, complex multivariable state equations in the time domain can also be solved accurately by computer, thereby creating the conditions for solving complex problems. Modern control theory is likewise suitable for studying biological systems, and exploratory work has already been carried out from various perspectives.
VII. Feedback and Dynamic Systems
Control systems are all dynamic systems; that is, the variables reflecting the essential nature of a system all change with time. The mathematical models mentioned above, whether transfer functions or state equations, are descriptions of the dynamic processes of systems. In this section, we will discuss some characteristics of dynamic processes and the response of feedback to dynamic processes.
We take as an example the process caused by applying a unit-step-function input to a second-order system. A unit-step function is a time function whose value is 0 when t < 0 and whose value is 1 when t ≥ 0; it is represented by 1(t). If the transfer function of the system is
W(s) = X(s)/U(s) = K/(T²s² + 2ξTs + 1)then the corresponding differential equation is
T²ẍ + 2ξTẋ + x = KuIt can also be written in state-equation form. Let x₁ = x and x₂ = ẋ = ẋ. Then:
ẋ₁ = x₂
T²ẋ₂ = −x₁ − 2ξT x₂ + Ku
or, in matrix form,
[ẋ₁]   [  0      1   ] [x₁]   [  0   ]
[ẋ₂] = [ −1/T²  −2ξ/T ] [x₂] + [ K/T² ] u
The solution of this system of equations depends on T and ξ. Under zero initial conditions, namely x₁(0) = 0 and x₂(0) = 0 (or x(0) = 0 and ẋ(0) = 0), the output of the unit-step input is:
X = K·[1 − (1/√(1−ξ²))·e^(−(ξ/T)t)·sin((√(1−ξ²)/T)t + φ)]φ = tan⁻¹(√(1−ξ²)/ξ)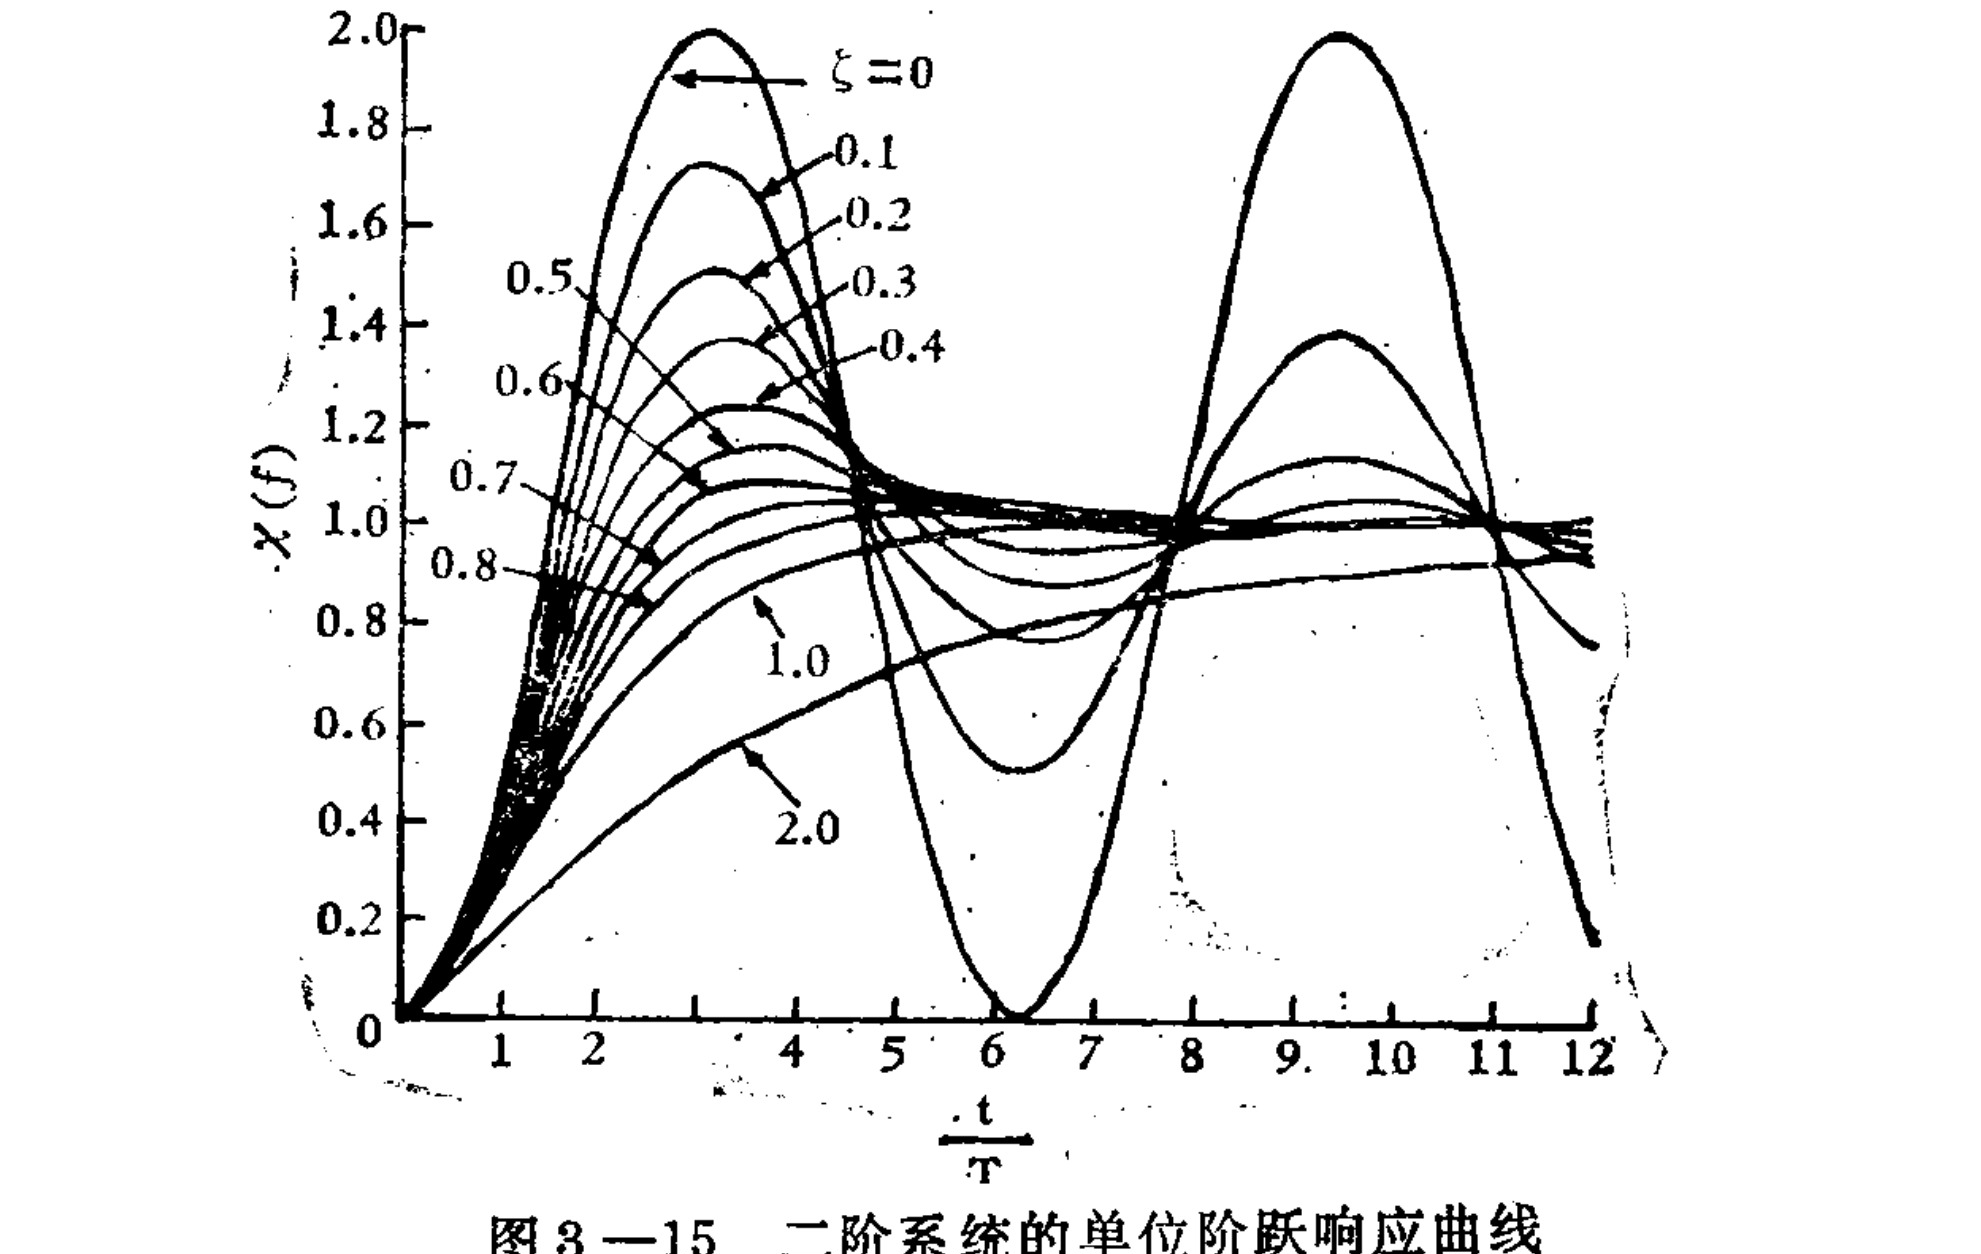
Figure 3–15. The dynamic process of X with t/T as the coordinate and different values of ζ. From Figure 3–15 it can be seen that, when K = 1, under different values of ζ, the final stable value reached is 1; 1 is the steady-state value. The times required to reach the steady-state value, however, are different. The period before the steady-state value is reached is called the transient-process time (or transient time). During the transient process, when ζ is relatively small,
Translated labels: x(t); t/T; Damping ratio values (ζ): 0, 0.1, 0.2, 0.3, 0.4, 0.5, 0.6, 0.7, 0.8, 1.0, 2.0
Figure 3–15 Unit step response curve of a second-order system
X reaches 1 quickly; the smaller ζ is, the faster the rise. But it soon exceeds 1, then falls again, and may oscillate back and forth around 1—in other words, the process exhibits damped oscillation, and ζ is called the damping coefficient. When ζ = 0, the system output X is an equal-amplitude sinusoidal oscillation; when ζ < 0, its amplitude grows increasingly larger, producing amplified oscillation, which is unstable. When ζ ≥ 1, X does not exceed the steady-state value during the transient process. When the transient process exceeds the steady-state value, this is called overshoot. The maximum amount by which it exceeds the steady state—that is, the maximum overshoot—is an important indicator of the dynamic process. The larger ζ is, the longer it takes to reach the stable value. The length of the transient-process time is another important indicator of the dynamic process: the larger T is, the slower the process.
After feedback is added to a system, the properties of its dynamic process will improve. We will use a second-order system as an example to explain this. Suppose there is a simple direct-feedback system, as shown in Figure 3–16. From the formula in the preceding section, we can obtain the transfer function of the feedback system.
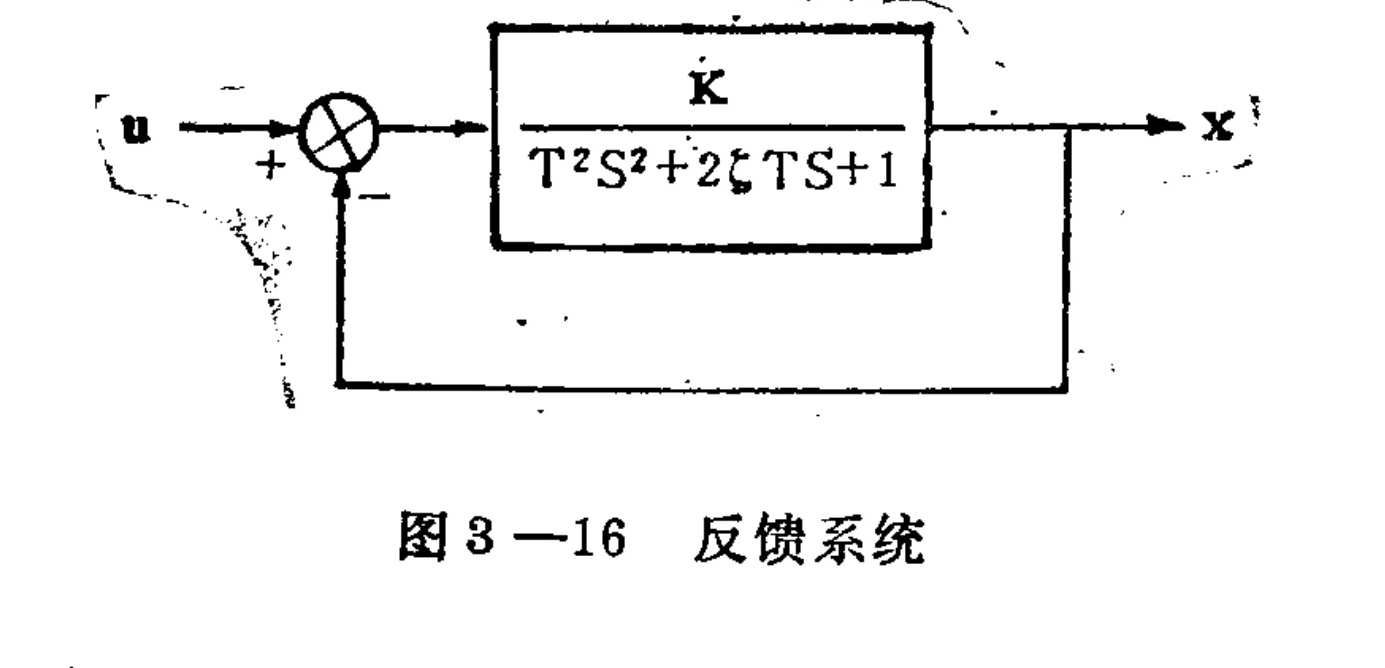
Figure 3–16. Feedback system
Translated labels: u; x; K; T^2S^2+2zetaTS+1; +; -; Feedback System
[ \frac{X(s)}{W(s)} = \frac{G(s)}{1+G(s)W(s)} = \frac{K}{T^2s^2+2\xi Ts+(1+K)} ]
Comparing the transfer functions of the system before and after feedback, we can see that both are second-order systems. However, T′ and the damping coefficient ξ′ have decreased. Therefore, the transient process becomes faster, but there is a tendency toward oscillation. The larger K is, the greater these changes are. In addition, feedback makes the operation of the entire system more stable: changes in internal parameters or characteristics have a smaller effect on the operation of the system as a whole. Taking changes in K as an example, without feedback, if K increases twofold, the output also increases twofold. With feedback, however, the situation is different. Suppose K increases from 10 to 20. Then the corresponding
K′ = 10/(1 + 10) = 0.909 changes to 20/(1 + 20) = 0.952, an increase of only about 5%. The larger K is, the smaller the change in K′ is.
From the discussion above, it may seem that feedback can improve the dynamic performance of a system, but it may also make the system worse, because the damping affects the overshoot and consequently also lengthens the transient time. Control theory has established a number of effective design methods that give feedback systems excellent dynamic characteristics. Because of space limitations, we cannot discuss this aspect in depth here. The following example confirms that this possibility exists. Instead of using direct feedback, suppose we use a feedback element with dynamic characteristics, (W_2(s) = As + 1). In other words, the feedback element has a differentiating effect: the feedback action is related not only to the output, but also to the rate of change of the output. Many receptors in biological systems approximately have this characteristic. The closed-loop system is then as shown in Figure 3–17. The transfer function of the entire closed-loop system can be calculated.
(W(s) = \frac{WG(s)}{1 + WG(s) \cdot W_2(s)} = \frac{\frac{K}{T^2s^2 + 2\zeta Ts + 1}}{1 + \frac{K(As + 1)}{T^2s^2 + 2\zeta Ts + 1}})
(= \frac{\frac{K}{1 + K}}{\left(\frac{T}{\sqrt{1 + K}}\right)^2 s^2 + 2\left(\frac{\zeta}{\sqrt{1 + K}} + \frac{AK}{2T\sqrt{1 + K}}\right) \cdot \frac{T}{\sqrt{1 + K}} s + 1})
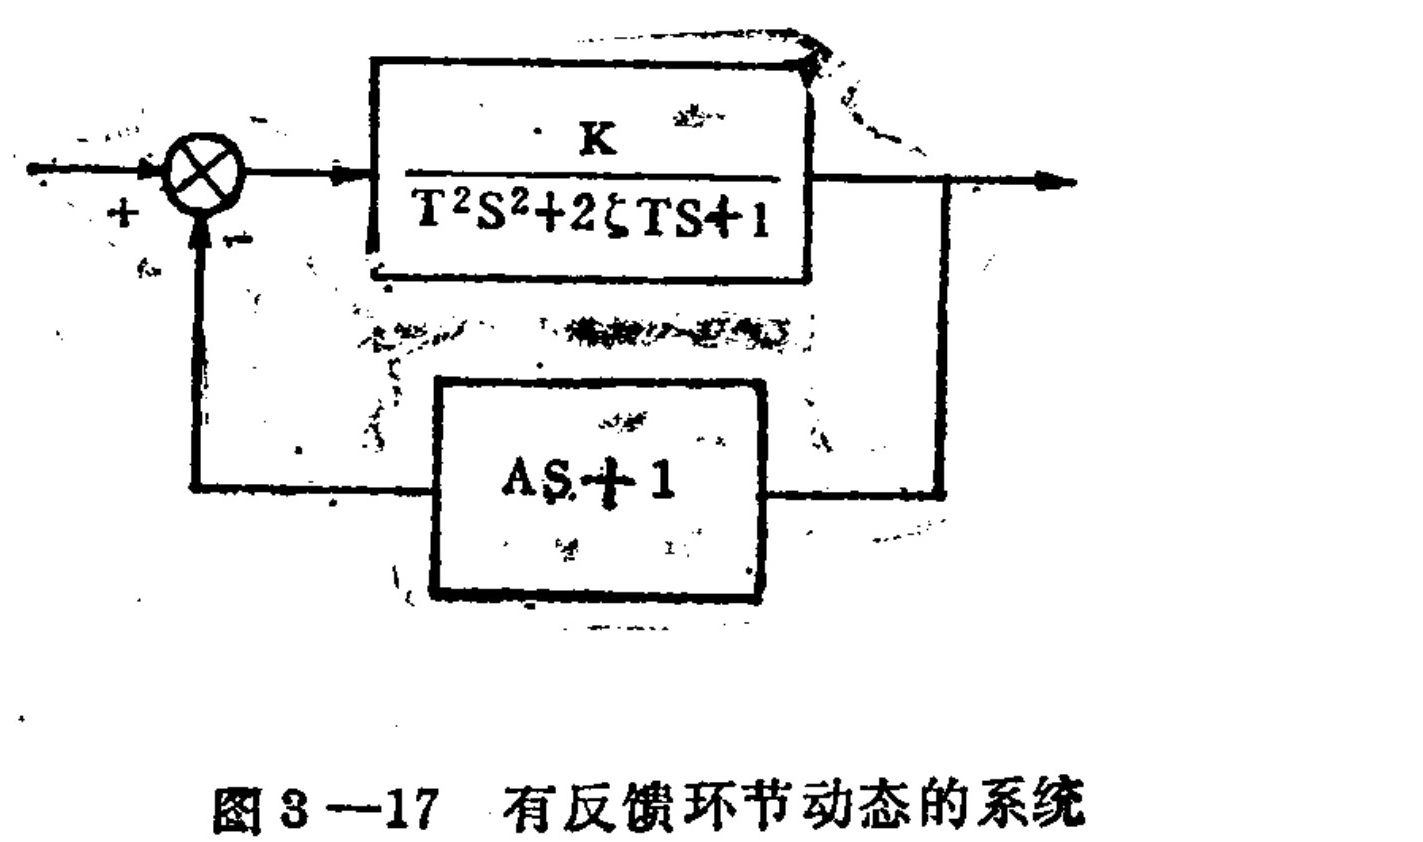
Figure 3–17. A system with dynamic feedback
Translated labels: K / (T^2S^2 + 2ξTS + 1); AS + 1; +
Comparing this result with the result for direct feedback, we can see that the equivalent T and K′ are the same, but ξ′ is different. In this case,
ξ′ = ( ξ∕√(1+K) + AK∕(2T√(1+K)) ) = 1∕√(1+K) · ( ξ + AK∕(2T) )
With appropriate selection of A, not only can the process be sped up, but there is also a larger damping coefficient, that is, the system has better transient-process properties.
VIII. System Stability
The systems discussed here are dynamic systems. In a dynamic system, because of the interactions among its various internal parts and because of external disturbances, the system is always in a state of motion.
On the other hand, for a system to operate normally it is often necessary for it to remain in a relatively stable state—especially a control system, which exists to achieve a particular control objective. The state of the system should be affected as little as possible by the external environment (disturbances), remaining within a predetermined range or changing according to a required pattern. This ability to maintain the relative constancy of a system’s state under changing internal and external conditions is the stability of a dynamic system.
Clearly, stability is a necessary condition for the normal operation of a control system. The human body, for example, is an extremely complex dynamic system, constantly affected by changes in its internal and external environments. It contains many subsystems, quite a few of which are also control systems. As early as the last century, Bernard clearly pointed out that the relative stability of the internal environment is a necessary condition for the existence of life. Blood pressure, pulse, body temperature, and other parameters within the human body should all remain within a certain range. If body temperature changes by more than ±0.5°C, the person may be considered ill. We now understand that the relative stability of these internal-environment parameters is ensured by biological feedback systems. In the human body, under physiological conditions, these control systems are all stable.
When the surrounding temperature changes, a thermostatic chamber should ensure that the temperature inside the chamber remains within a predetermined range; this is achieved by a temperature regulator. Achieving this objective enables the thermostatic-chamber system to maintain its stability. Similarly, in connection with ecosystems, we often hear discussions about maintaining ecological balance. An ecosystem is the larger system composed of biological populations and their environment; it too is a dynamic system. Under certain conditions, the various populations in an ecosystem
…of it. However, human activity may destroy this relative stability, and may even cause certain systems to become unstable.
Stability is a necessary condition for the operation of most dynamic systems. We study the stability of a system for different purposes. For example, when designing an engineering control system, we must adjust the system’s structure and parameters so that the designed system can operate stably. Biological and ecological systems are generally stable originally, but under abnormal circumstances they may become unstable. In that case, our goal is to find the causes of the instability and seek ways to overcome it. In short, we must find the factors that determine system stability.
To explain the concept of stability more vividly, we will discuss a specific simple example. Figure 3-18 shows a dynamic system consisting of a small ball of mass M; here too there is a stability problem. The ball is placed in a pot with the shape shown in the figure. For simplicity, we examine motion in only one cross-sectional plane. The ball is acted upon by several forces: gravity causes it to move toward the lowest point, and the pot exerts a reaction force; friction also acts while it is moving. If the ball was originally at point a or point b at the bottom of the pot, is its motion stable? If a temporary disturbance causes the ball to leave the bottom, then, because of gravity and friction, the ball will swing back and forth near point a or point b, and finally return to the bottom of the pot.
If, however, the ball was originally at point c or point d, its motion is unstable. As soon as it deviates slightly from the original point, it cannot return to that point. If it deviates to the right from point d, it will eventually fall toward point b; if it deviates to the left, it will oscillate near point a and eventually fall into a. Alternatively, if friction is small, it may pass over point c and continue falling. Thus, even this simple system may exhibit several different kinds of motion under different circumstances.
The factors related to stability in this system include: (1) the ball’s position (that is, the initial value of the system state); and (2) the shape of the pot, its coefficient of friction, and other system parameters. We can also see that a system may have several stable points, such as points a and b in the figure. Near points a and b, the mathematical model of the system above is approximately a second-order system. Its damping coefficient is related to the coefficient of friction.
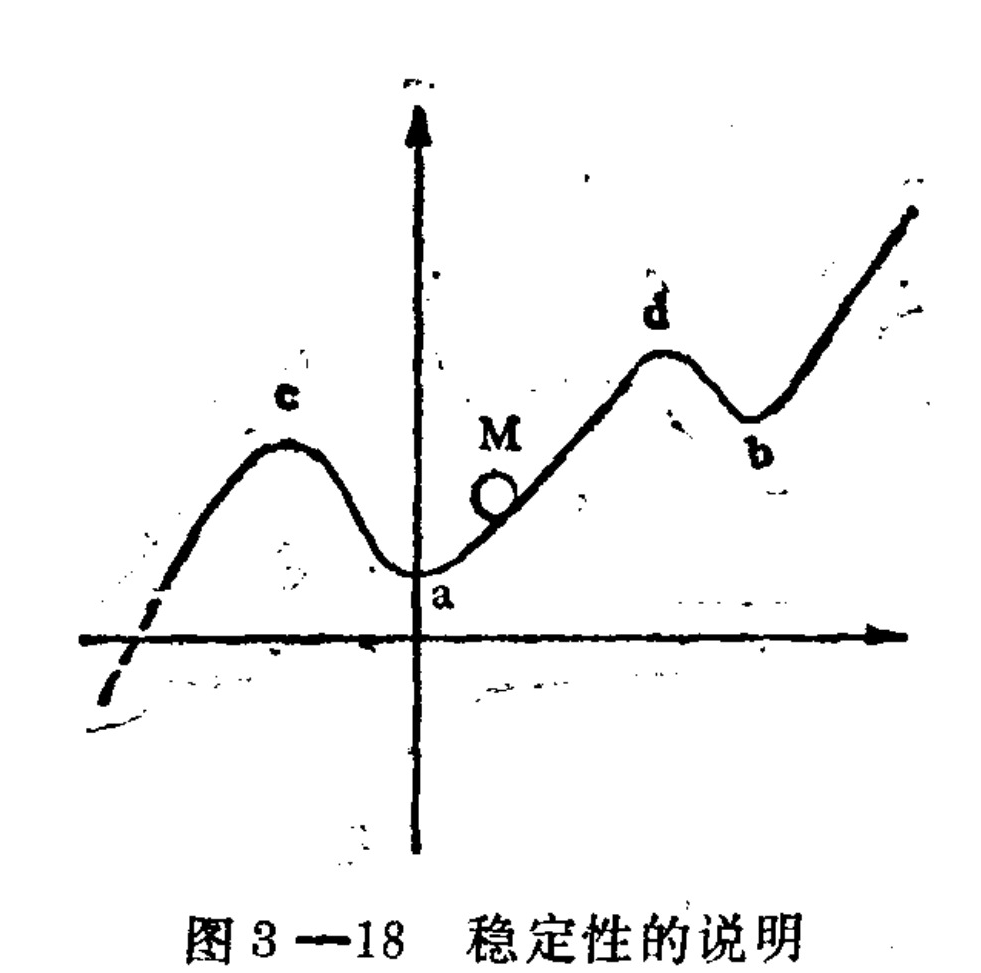
Figure 3-18. Explanation of stability
Translated labels: c; a; M; d; b
The conclusions drawn from simple systems offer useful guidance for observing and studying complex systems. For example, the phenomenon of multiple stable points may occur in an organism. Some chronic disease states may constitute another stable point outside the normal physiological state. The effects of some treatment methods, such as acupuncture and qigong, may consist precisely in moving the system from a metastable state point into the normal stable state. Of course, whether this hypothesis is correct remains to be tested through further work.
System stability usually refers to a property of the system itself and is unrelated to the input u or external disturbances. It asks whether, in the absence of external forces, the system has the ability to return automatically to a state after deviating from it. If it can do so, the system is said to be stable at this point (a point in state space). A strict mathematical definition of stability can be given, but since we do not intend to apply too many mathematical tools here, it will not be introduced. When a system ultimately returns to its original state after a small deviation, it is said to be asymptotically stable with respect to that point. If, throughout the entire state space, every deviation returns to that point in the absence of external forces, the system is said to be globally asymptotically stable with respect to that point.
It has already been proved that, for a system describable by a linear constant-coefficient differential equation, stability is determined by the roots of its characteristic equation. For a system described by an nth-order ordinary differential equation, we have:
x^(n) + a_(n-1)x^(n-1) + ... + a_i x^(i) + ... + a_1 x + a_0 x = K uThe corresponding transfer function is:
W(s) = X(s)/u(s) = K / (s^n + a_(n-1)s^(n-1) + ... + a_i s^i + ... + a_1 s + a_0)Its characteristic equation is the algebraic equation:
s^n + a_(n-1)s^(n-1) + ... + a_i s^i + ... + a_1 s + a_0 = 0The solutions of these algebraic equations may be real or complex numbers. If the real parts of their roots are negative, the system is stable and is also globally asymptotically stable. It therefore seems that the stability problem for linear constant-coefficient systems has been solved. However, even for an algebraic equation, when the degree is higher than 4, the relationship between the characteristic roots and the equation’s coefficients cannot be found directly. It is therefore necessary to seek a way to determine directly, without solving the characteristic equation, whether its roots have negative real parts. One such method has been found and is introduced below. It is called the Routh–Hurwitz criterion. A necessary and sufficient condition for the roots of an algebraic equation of the form above to have negative real parts is that all the following determinants be positive:
A₁ = a_(n−1) > 0

A₂ = | a_(n−1)  a_(n−3) |
     | 1          a_(n−2) | > 0

A₃ = | a_(n−1)  a_(n−3)  a_(n−5) |
     | 1          a_(n−2)  a_(n−4) |
     | 0          a_(n−1)  a_(n−3) | > 0

Aₙ = | a_(n−1)  a_(n−3)  a_(n−5)  ⋯  0  0 |
     | 1          a_(n−2)  a_(n−4)  ⋯  0  0 |
     | 0          a_(n−1)  a_(n−3)  ⋯  0  0 |
     | 0          1          a_(n−2)  ⋯  0  0 |
     | ⋯          ⋯          ⋯          ⋯  ⋯  ⋯ |
     | ⋯          ⋯          ⋯          ⋯  a₀  0 |
     | 0          0          0          ⋯  a₁  0 |
     | 0          0          0          ⋯  a₂  a₀ | > 0
For example, for the equation
x⁵ + 5x⁴ + 10x³ + 10x² + 5x + 1 = 0we have A₁ = 5 > 0, and
A₂ = | 5  10 |
     | 1  10 | = 40 > 0
Δ₃ = |5 10 1; 1 10 5; 0 5 10| = 280 > 0
Therefore, all the characteristic roots of this equation have negative real parts. Clearly, the Routh–Hurwitz criterion is also a stability criterion for systems described by the corresponding differential equations.
Section 5 introduced the experimental method for obtaining frequency characteristics and the use of the open-loop frequency characteristic (Nyquist plot) to determine system stability. A Nyquist plot can also be obtained analytically. Thus, when the open-loop transfer function of a system is known, the corresponding frequency characteristic can be obtained (simply substitute jω = s), and the stability of the closed-loop system can be determined.
For example, the open-loop transfer function is printed in the running text as
W_G(s) = 20/[(s + 1)(s + 2)].
We want to determine whether the closed-loop system (Figure 3-19) is stable. Substituting s = jω gives:
W_G(jω) = 20/[jω(jω + 1)(jω + 2)] = −20[3ω² + jω(2 − ω²)]/{[ω(2 − ω²)]² + (3ω²)²} = [−60ω² − j20(2ω − ω³)]/(ω⁶ + 5ω⁴ + 4ω²)
Substituting different values of ω into the expression, taking the horizontal coordinate as the real axis and the vertical coordinate as the imaginary axis, produces the frequency-characteristic curve shown in Figure 3-20.
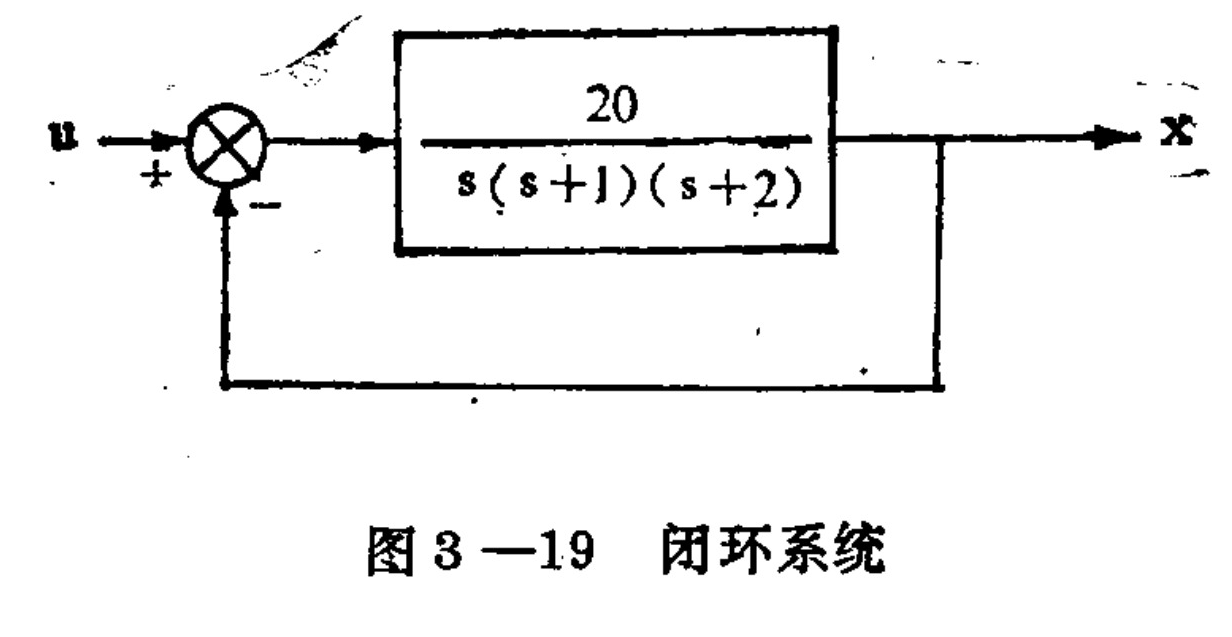
Figure 3-19. Closed-loop system. Diagram labels: input u enters a summing junction at the positive input; unity feedback enters its negative input; the forward block is 20/[s(s + 1)(s + 2)]; output x.
Translated labels: u; x; +; -; 20; s(s+1)(s+2)
It can be seen that the Nyquist plot encloses the point (−1, j0), so the closed-loop system is unstable. There are different ways to make the closed-loop system stable, such as reducing gain K.
Real part 0 … -1.5 -3.33 -6
Imaginary part 0 … 10.5 0 -2
The figure shows the open-loop frequency-response curves on the complex plane. The imaginary axis is labeled Im, with frequency points marked at ω = 0.41 and ω = 2. The real axis is labeled Re, with graduations from −8 to 1. The curves are labeled (W_G), 0.4, 0.2, and (W_G \cdot W_1), with frequency points ω = 1 and ω = 0.15 also marked.
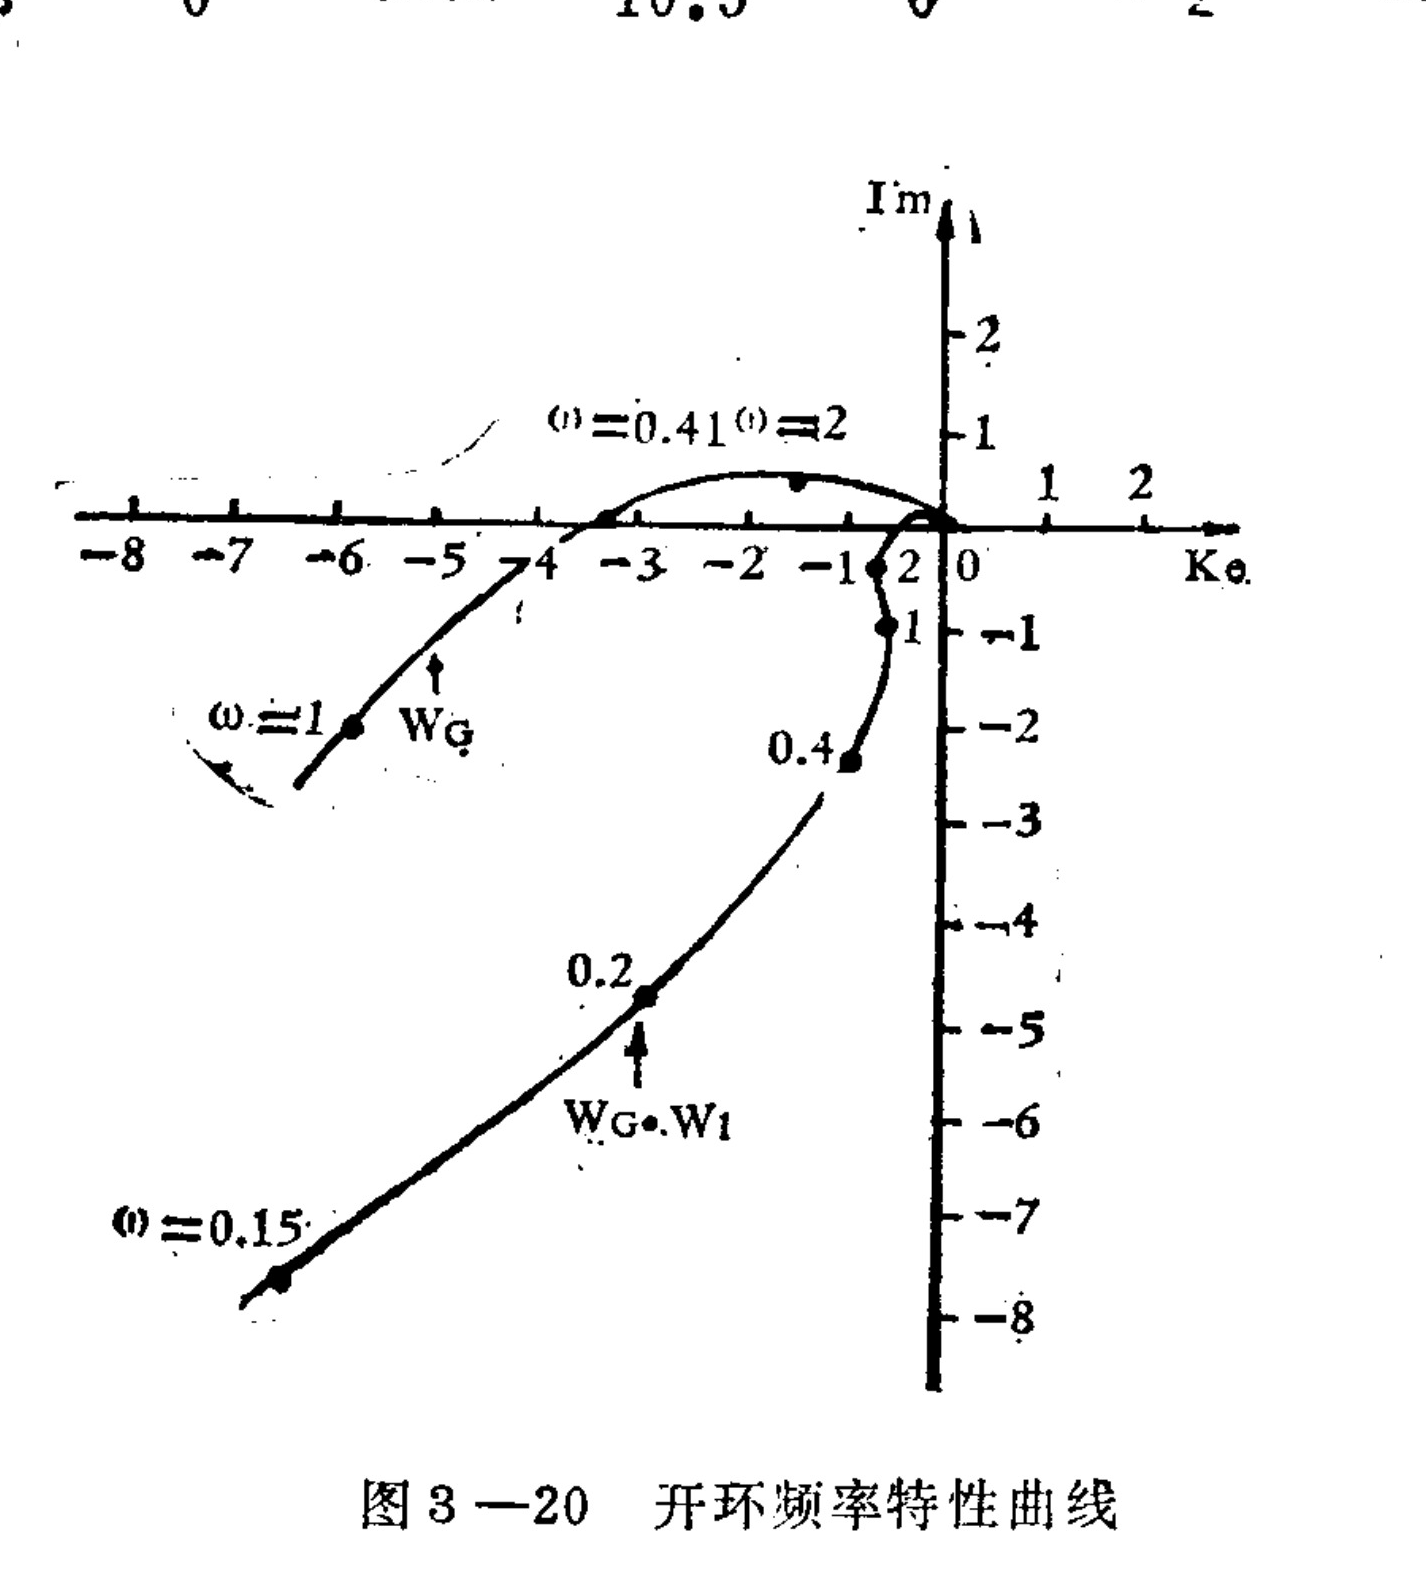
Figure 3-20. Open-loop frequency-response curve
Translated labels: Im; Re; ω=0.15; W_G·W1; 0.2; 0.4; ω=1; W_G; ω=0.41; ω=2
When (K < 20/3.33), the curve does not enclose ((-1,j0)), and the system can be stable, but its other performance is poor. Generally, the curve is required to remain a certain distance from this point, and the phase and angular displacement should also be somewhat smaller. For example, the maximum phase angle is 150° (the 180° direction is the imaginary axis); the difference between this and 180° is called the phase-margin angle. Control theory has developed design methods that guarantee the stability of closed-loop systems. As in the previous section, the characteristics of feedback elements can be used to improve the system’s dynamic characteristics. Below we explain how to improve dynamic characteristics by the series-correction method. “Series” means connecting an appropriate dynamic element in series ahead of the controlled object. In the example above, direct feedback is unstable, so we insert another element in series before (W_G(\omega)),
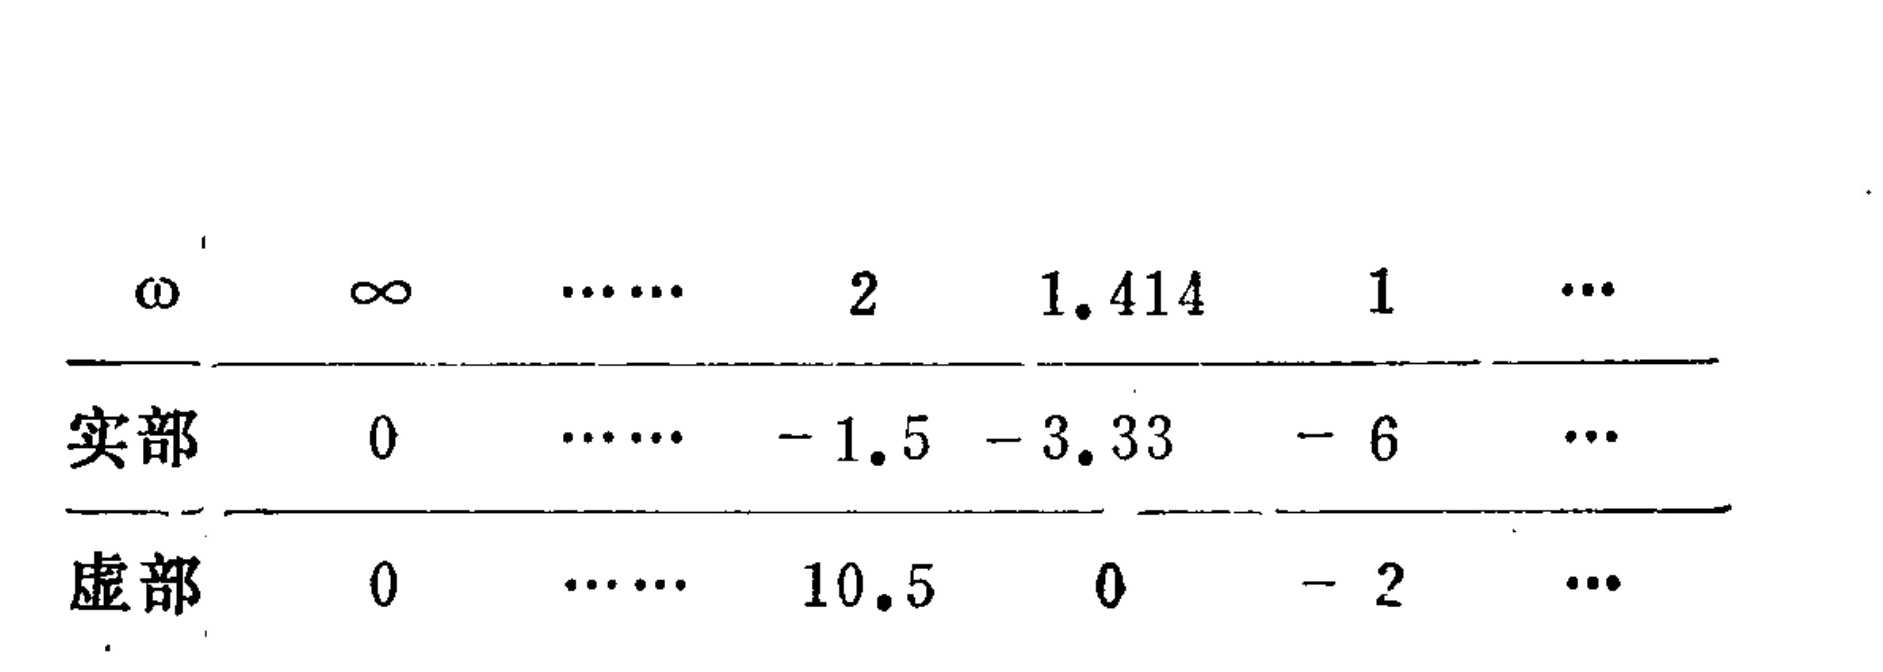
Table showing the real and imaginary parts of a complex function corresponding to different values of the frequency parameter ω.
Translated labels: ω; ∞; Real part; Imaginary part
[ W_i(s)=\frac{(As+1)(Cs+1)}{(Bs+1)(Ds+1)} ] as shown in Figure 3-21. By suitably selecting the parameters (A), (B), (C), and (D), the system can be given excellent dynamic characteristics. Because of space limitations, the specific selection method
will not be introduced. If we take
[ W_i(s)=\frac{(1.43s+1)(6.67s+1)}{(0.143s+1)(66.7s+1)} ]
then the entire open-loop transfer function becomes
[ W_1(s) \cdot W_G(s)=\frac{10(1.43s+1)(6.67s+1)}{s(0.143s+1)(66.7s+1)(s+1)(0.5s+1)} ]
Substituting (s=j\omega) gives the new Nyquist diagram, as Curve 2 in Figure 3-20. It can be seen that the system is stable and has relatively large gain and phase margins.
Series correction
[Figure: feedback system with series correction]
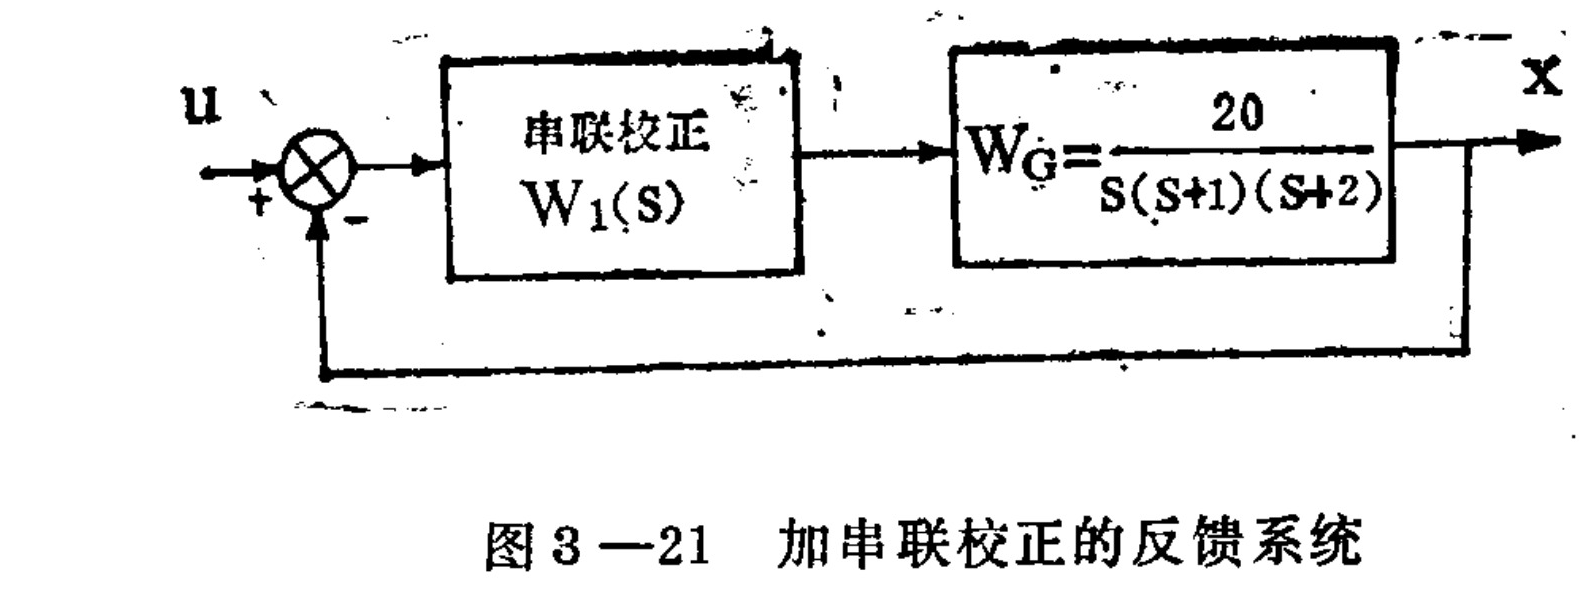
Figure 3-21. Feedback system with series correction
Translated labels: u: Input signal; Series compensation W1(s); WG = 20 / s(s+1)(s+2): Plant transfer function; x: Output signal
9. Computer simulation (simulation)
After obtaining the mathematical model of a system, it can be studied by analytical methods, such as analyzing the stability of the system and improving its dynamic characteristics. However, analytical methods generally can be used only for linear time-invariant systems or simple nonlinear systems. Most biological systems are complex nonlinear systems. Therefore, it is difficult to use analytical methods to obtain the system’s dynamic response or to solve problems such as the influence of parameters on dynamic characteristics. Fortunately, the rapid development of electronic computers has provided us with a useful tool for solving these problems.
With the development and increasingly widespread application of electronic computers, it has now become easy to enter a mathematical model into an electronic computer and use the computer to obtain the system’s various quantitative results and dynamic processes. This method is called mathematical simulation (simulation), or computer simulation.
There are mainly two types of electronic computers that can be used for mathematical simulation. One type is the electronic analog computer, which consists of many components centered on operational amplifiers. Each component performs one kind of operation, such as integration, differentiation, amplification, or a nonlinear functional relationship. The operations in the mathematical model are completed by interconnecting the components; the values of the individual variables are represented and processed as analog (continuous) quantities. Analog computers are relatively easy to use, their parameters are easy to change, and their operating speed is high, but their precision is relatively low. In simulation studies of biological systems, analog computers were used most often during the 1950s and 1960s.
The other type is the electronic digital computer. Its basic components can perform only the four arithmetic operations and some logical operations. Through a program, the operations in the mathematical model are transformed into a sequence of simple operations in the digital machine, thereby realizing simulation of the process. Electronic digital computers have high precision; their operating speed and storage capacity have continued to increase year by year, and they can solve extremely complex problems. However, a program must first be written before they can be used, which requires specialized skills. Easier-to-master high-level programming languages have now been developed, along with programming languages specifically for system simulation; specialized programs or software packages are also available for various common specific problems.
Specialized programs or software packages are application-software products that can be purchased on the market, allowing people who do not understand electronic computers to learn to use them quickly. Because large-scale or very-large-scale integrated circuits are used, the price of digital electronic computers is continually falling. At present, most simulation research on biological systems uses digital computers, and there is a trend toward replacing analog computers. In addition, there are analog–digital hybrid computers. These computers possess the advantages of both preceding types of electronic computer and are suitable for system-simulation applications.
The analog method was adopted relatively early in engineering and technology. With the development and popularization of electronic computers, the range of applications of computer-simulation methods has expanded; these methods have also been adopted in the social sciences and medicine, where they have spread rapidly.
The advantage of mathematical simulation is that it is very easy to change the parameters and conditions of the object being simulated. Various factors’ effects on a process can be investigated, and simulation experiments can be repeated. This is particularly important for research in cybernetics. Moreover, simulation methods can quickly and economically find things that are difficult to obtain theoretically, identify the internal relationships reflected in a process, and predict the process’s future. Therefore, when a problem is theoretically difficult to solve, when experiments with the real object involve substantial risk, or when simulation experiments are more economical and time-saving, simulation methods are often adopted.
The application of simulation methods in biomedicine is highly valuable. (1) Because biological systems are composed of an extremely large number of components, it is very difficult to understand the operation of the entire system from the few components that can be measured. If a model of the object is used in its place, various variables can be measured and experiments can be conducted under different conditions, thereby enabling a comprehensive, quantitative, and dynamic analysis of the organism. (2) Because simulation is used, the reactions of an organism under extreme and highly difficult conditions can also be observed in simulation experiments. Repeated experiments can also be conducted under different circumstances and with different parameters, in order to find the optimal means of controlling the biological object so that it reaches the desired state. In clinical medicine, simulation may be even more useful. For example, the anesthesia-training simulator “Sim One,” developed by the University of California in the United States, is an application. Thus, simulation has become a useful tool for understanding biological functions and for analytical research on clinical medical phenomena.
Before conducting simulation research, a digital model of the system being simulated should first be established. Establishing a mathematical model is difficult and often requires repeated cycles together with the simulation work before it can be completed. Model construction and the simulation based on the model should generally proceed according to the following steps:
-
Determining the problem: Based on the purpose of the simulation, determine the object system to be analyzed. Then, using existing knowledge and data, make a rough structural diagram and block diagram of the system, and make preliminary estimates of the approximate dependency relationships and relevant parameters among the system’s parts or components.
-
Collecting and accumulating data: Collect data and known facts related to the system involved in the problem under study; when necessary, use simple experiments and other means to obtain relevant new data.
-
Analyzing and processing data: Analyze and process the collected data and knowledge. Taking into account the preliminary estimate of the system’s structure and its approximate regularities, investigate the laws governing changes in the various factors and the correlations among the parameters, and then determine the regularities and dependencies among the system’s parts or components.
-
Establishing the model: Based on the processing results, use appropriate methods to describe the relationships among the system’s constituent components and establish the model that best represents the system.
-
Conduct simulation experiments: On the basis of the established mathematical model, conduct simulation experiments using a suitable device, such as an analog computer or digital computer. From the results, evaluate the model’s applicability in such respects as whether it can adequately simulate the behavior of the actual system and whether it sufficiently clarifies the principles governing the actual system’s behavior.
-
Revise the model: If the model cannot yet satisfy the requirements for simulating the actual system, it should be revised. Such revision is needed not only at the initial stage of evaluating the model; on the basis of experimental results, new hypotheses may be proposed and a higher-level revision carried out. These revisions may need to be repeated several times. In all cases, necessary additional or corrected data should be supplied, and the methods of processing them improved accordingly.
-
Apply the model and simulation method: Once the model’s applicability has been established, it can be used for computer simulation. By changing the corresponding parameters and conditions, the model’s responses under different circumstances can be studied to achieve the research objective. When necessary, a dedicated simulator can also be constructed.
The steps described above for establishing a model and conducting a simulation can be summarized as shown in Figure 3-22.
Addition or correction of data Improvement of processing methods Revision of the model Problem formulation Collection and accumulation of data Analysis and processing of data Model creation Evaluation of the model Conduct simulation Additional experiments Known pathophysiological knowledge
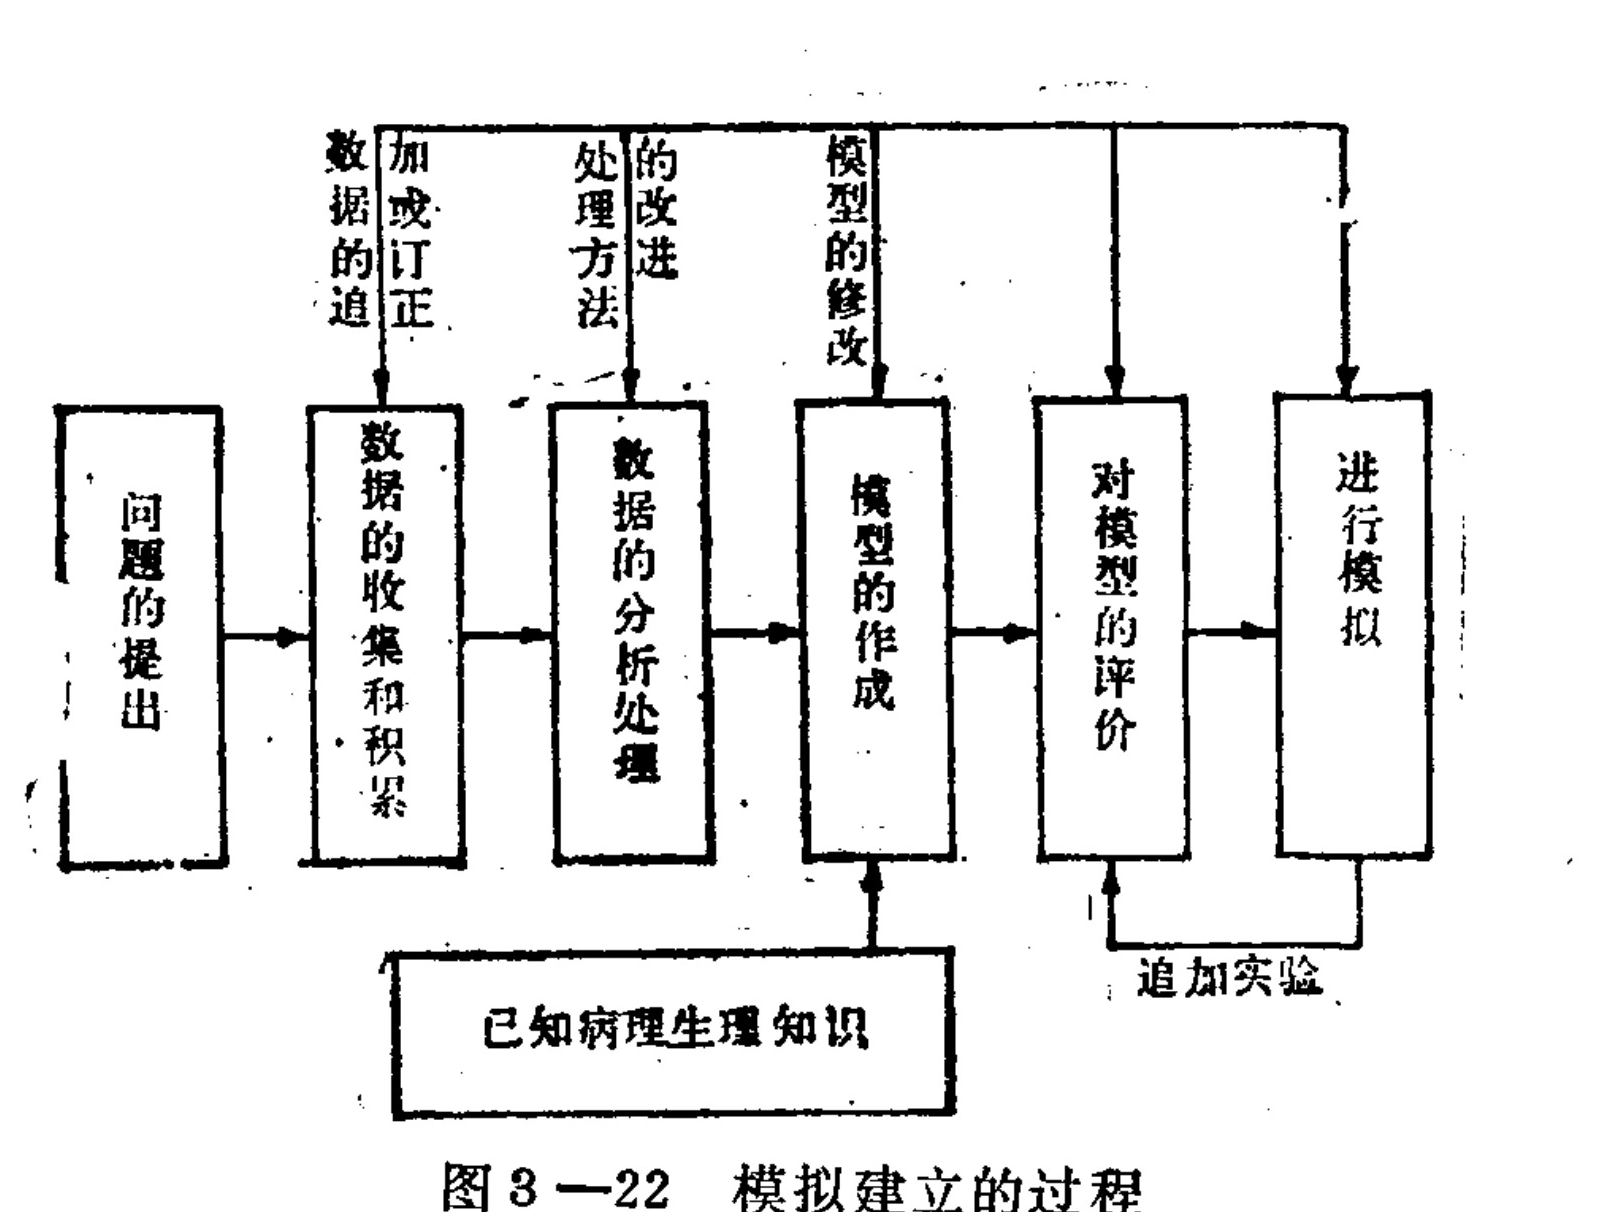
Figure 3-22. The process of establishing a simulation model
Translated labels: Problem formulation; Data collection and accumulation; Data analysis and processing; Model creation; Model evaluation; Simulation; Known pathophysiological knowledge; Additional experiments; Data pursuit; Supplement or correction; Improvement of processing methods; Model modification
When establishing a model, on the one hand, it should not be made so simple that it cannot approximately simulate the behavior of the actual system; on the other hand, too many features and secondary factors should not be introduced, making it excessively complex and difficult to solve.
The more complex the system’s behavior or condition, the more complex the dependencies among its components and parameters. A certain degree of complexity in the model is unavoidable. Even when data can be collected, organized, and analyzed satisfactorily, it is generally quite difficult to establish a model that satisfactorily represents the actual situation. Therefore, when conducting a simulation, rather than building a model extremely similar to the actual situation, it is better, once the problem has been defined, to clarify its central issue and design a simplified model. This prevents too many peripheral issues from obscuring the truly critical problem and allows the intended simulation to be carried out smoothly.
At present, corresponding mathematical models have been established for all the major physiological systems. For the same system, moreover, multiple mathematical models of different degrees of complexity have been established for different purposes. Because biological systems have complex structures and often contain many nonlinear components, they are difficult to solve using purely analytical methods. Consequently, most biological systems for which mathematical models have been established have also been simulated using electronic computers. For example, a model of the blood-pressure regulation system has been established with 354 computational elements, each representing one or several mathematical equations describing circulatory function. There are approximately 400 equations in all, most of them nonlinear. In addition, there are 38 integrator elements, equivalent to a thirty-eighth-order nonlinear differential equation. Computer simulation has been performed on this relatively large-scale biological-system model.
Mathematical models and simulation methods have demonstrated their superiority in biomedical education. Through electronic-computer simulation, with display on a screen or graphical output, students can gain an intuitive understanding of how the various physiological systems work and of the role of their parameters. Because the model’s parameters and operating conditions can easily be adjusted, physiological responses and various pathological responses under different conditions can be displayed clearly on the screen, enabling students to master this knowledge more quickly and effectively. Clearly, the different regulatory and control processes in the various structures of the human body can be studied using mathematical models and simulation methods. Much work remains to be done in this area.
Because the components of a biological system are mutually connected and mutually constraining, it is difficult to explain their intricate relationships using only traditional descriptive methods. In particular, it is difficult to explain how a change in one part affects the control of the biological system as a whole. Control theory focuses on the interconnections among the various parts of a system and analyzes the different ways in which they are connected. These connections are expressed using mathematical equations, thereby establishing a mathematical model of the biological system’s functions.
Generally speaking, the mathematical models established through control theory are not easy to solve analytically. However, we have the powerful tool of the electronic computer. Establishing mathematical models with control theory and conducting simulations with electronic computers is an effective method for studying biological systems.
- System Identification
In order to control a system effectively, and especially to achieve optimal control, it is necessary to obtain an accurate mathematical model of the controlled object. It is necessary to know not only the form of the mathematical model but also the numerical values of its specific parameters.
System identification is a method of obtaining the structure and parameters of a mathematical model for a dynamic system through experiments. Usually, an artificially generated signal (although the system’s own existing signal may sometimes be used) is applied to the system under study, and the system’s corresponding response—that is, its output—is then recorded. Through calculations, usually performed online or offline by an electronic computer, information about the system is extracted from the input and output data. The ultimate result is a dynamic mathematical model governing the behavior of the measured system. System identification can also be described as a method of establishing a mathematical model from experimental data. Although system identification models the system using only input and output data, it can obtain the parameters of a parametric model and thus also provide information about the system’s internal structure.
This method was first applied and developed in solving engineering-control problems. Many industrial control objects involve complex physical and chemical processes, and it is often difficult to establish their mathematical models through theoretical derivation. It is therefore extremely important to obtain mathematical models by experiment. Similar problems exist in biomedicine. Biological systems are also dynamic systems, and are often even more complex than industrial systems; purely theoretical derivation can scarcely produce accurate mathematical models for them. It is therefore even more necessary to determine mathematical models of biological systems experimentally, using system identification.
System identification is oriented toward practical application. It produces the mathematical model of a specific object, including the order of the object’s equations and the numerical values of its parameters. If the structure of the mathematical model—that is, the form and order of the equations—is known, and only its parameters are required (the coefficient values in the equations), then system identification is called parameter estimation. At present, structural identification, apart from some methods for determining the order of the equations, has no generally effective method at present. Current theory of system identification is primarily concerned with parameter estimation. The method discussed earlier for obtaining a transfer function from a frequency-response curve is also a system-identification method, but it yields a nonparametric model; it may therefore be regarded as nonparametric system identification.
Usually, when carrying out system identification, one first has to determine a parametric model. As described in the preceding section, determining the model may require a repeated process. After determining the model, one then proceeds to design the identification experiment. This includes selecting an appropriate input signal so as to obtain as much information as possible; determining the times at which the output signal is sampled, especially when only a small number of samples is permitted; and then conducting the identification experiment and collecting the relevant input and output data. Depending on practical requirements, the data are processed online or offline by computer—that is, parameter estimation is performed. Finally, the parameters obtained are substituted into the equations to determine the deviation between the model’s dynamic process and the actual data. If the deviation lies within the permitted range, the identification results can be further verified. Verification methods include checking whether the parameters lie within a range that is physically possible, using the model to make a computer-simulation prediction of its response, and comparing the simulation results with actual data—not the data used for identification, but new actual data. If the two are close, the identification results can be considered valid.
The purpose of system identification is to obtain the mathematical model of a specific object; parameter estimation is its central problem. Many dynamic processes can be represented by systems of differential or difference equations. That is, on the basis of physical and chemical laws and physiological and biochemical principles, their state equations can be written, with parameters that may have corresponding physical or physiological meanings. Once the state equations are available, identification experiments provide the system’s input and output data. How to calculate the corresponding parameters from these data is the parameter-estimation problem. Many parameter-estimation methods are now available.
If the system is linear, the least-squares method is the basic method of parameter estimation. As early as the beginning of the nineteenth century, Gauss proposed the method of least squares for estimating the orbits of celestial bodies. Given observational data containing errors, the actual orbit is most likely the orbit for which the sum of the squared errors between the actual observations and the theoretically calculated values is smallest. This method was subsequently applied widely to the processing of experimental data. Beginning in the 1960s, it was further extended to parameter estimation for dynamic systems.
If a system can be described by differential equations, then, because system-identification calculations generally use a digital computer, it can be converted into the corresponding difference equation. Suppose the difference equation has the following form:
y(t) + a₁y(t−1) + ··· + aₙy(t−n) = b₀u(t−k) + b₁(t−k−1) + ··· + bₘ(t−k−m)
Here u is the input and y is the output. y(t−i) is the output value i unit-time intervals before t. Suppose sampling is performed once per unit-time interval, yielding one pair of input and output values. The a₁, a₂, …, aₙ and b₁, b₂, …, bₘ are the parameters. After N pairs of data have been recorded, the corresponding parameters can be calculated. The result is written directly below without proof. Writing the output and parameters as vectors gives:
Y = (y_{n+1}, y_{n+2}, …, y_{n+N})ᵀ
θ = (a₁, …, aᵢ, …, aₙ, b₁, …, bᵢ, …, bₘ)ᵀ
Arrange the recorded data into the following matrix:
φ = [−y_n −y_{n−1} … −y_1 u_n u_{n−1} … u_1 −y_{n−1} −y_{n−2} … −y_2 u_{n+1} u_N … u_2 ⋮ ⋮ ⋮ ⋮ ⋮ ⋮ −y_{n+N−1} −y_{n+N−2} … −y_N u_{n+N−1} u_{n+N−2} … u_N]
The corresponding parameters can then be found using the following formula:
θ = (φᵀ·φ)⁻¹φᵀ·Y
Here φᵀ is the transpose matrix of φ, and φ⁻¹ is the inverse matrix of φ. This is the basic formula of least squares. Standard programs already exist for calculating this formula. People unfamiliar with the formula can also enter the input and output data into an electronic computer, which calculates and prints the parameter values. Because noise is generally present during data collection, a relatively large amount of input and output data is needed to obtain precise parameter estimates. Generally speaking, the more data there are, the higher the precision. However, as the amount of data increases, the corresponding matrix Φ also becomes larger, greatly increasing the computational workload and requiring greater computer storage capacity. To avoid increasing the computational workload and storage requirements, the recursive least-squares algorithm was developed. This algorithm can continually make use of newly acquired data to obtain increasingly precise parameters and may permit real-time implementation.
The least-squares method does not require the statistical characteristics of the noise to be assumed in advance. However, when the noise sequence is correlated, its estimates are biased and non-consistent: even when the amount of data increases without limit, precise parameter values cannot be obtained. Therefore, the generalized least-squares method was developed. It can estimate the parameters of a model for the noise sequence at the same time, treating the noise as being generated when white noise passes through a model. Because white noise is uncorrelated, an unbiased estimate can consequently be obtained. For linear models, the instrumental-variable method, the maximum-likelihood method, and other methods can also be used for parameter estimation. Interested readers may consult monographs on system identification. As for nonlinear systems, there are currently no relatively effective methods for parameter estimation. At present, after establishing nonlinear equations describing the process, the parameter-estimation problem is generally transformed into the problem of finding the extremum of an index function in parameter space (usually the sum of squared errors or an integral form). In other words, it is transformed into an optimization problem for solution. Various optimization methods have been applied to estimating the parameters of biological systems. For example, it can be used to measure noninvasively certain parameters in living organisms that are difficult to measure directly. From analysis of the composition of respiratory gases, cardiac output can be estimated noninvasively, because cardiac output is a parameter in the alveolar gas-exchange equation. Vascular resistance and compliance can be estimated through measurements of blood pressure and blood flow. Under certain conditions, the diameter and length of blood vessels in a living body can also be estimated.times more than in the usual test), and these parameters can be used to distinguish different types of diabetes. The results of estimating model parameters for the respiratory airways can be used to diagnose different pulmonary lesions. ③ It can serve as a basis for treatment, especially for determining optimal treatment plans. For example, on the basis of estimated model parameters for the blood-glucose system, a computer program for an optimal treatment plan for diabetic coma has been proposed. After verification against past cases showed it to be effective, it was being tested clinically. The biomedical field has now become an important arena for the application of system identification. There are already many successful applications in pharmacokinetic systems, the respiratory system, the cardiovascular system, the renal-function system, the sensory and nervous systems, the endocrine and metabolic systems, the musculoskeletal system, and the human–operator system; space limitations prevent their detailed introduction here. At present, almost every different system-identification method has been tried in biomedical research, and some practical results have been achieved. However, more in-depth issues have not yet been discussed, such as the identifiability of a system—that is, whether all the parameters in a given model can in principle be estimated from the available measurements—the uniqueness of parameter estimates, and the effects of noise on parameter estimation. These issues have not yet been considered in nonlinear-model identification.
The application of system identification in biomedicine also presents some special difficulties. ① There are complex interrelationships among the various parts of a biological system. The input and output terminals often cannot be separated. Yet an identification experiment requires the input and output signals to be distinguished; artificially separating a subsystem from the organism as a whole may disrupt the normal physiological state. ② The state of a biological system is not easy to measure. In particular, noninvasive measurement is often required for human subjects, making it impossible to measure the variables needed for parameter estimation. Sometimes a variable can be measured, but very little experimental data can be collected—for example, when repeated blood draws are not permitted—making it difficult to guarantee the precision of parameter estimation. ③ Biological systems have many forms of nonlinearity. In addition to typical nonlinearities such as thresholds and saturation, there are nonlinearities related to frequency, adaptation phenomena, and so forth. The parameters also often change over time. All these issues create great difficulties for system identification and hinder the development of its applications in biomedicine. The progress achieved in applications so far has, to some extent, resulted from overcoming or bypassing these difficulties.
In identifying biological systems, the following issues deserve attention and investigation. (1) Biological systems themselves contain rhythmic activities with different time scales, such as heart rate, respiratory frequency, and periodic changes in body temperature; moreover, these rhythms are not completely fixed. Identification may therefore require sampling at unequal time intervals, requiring the development of new identification methods to solve this problem. (2) For biological systems, the identification input signal should be considered carefully. The theoretically optimal input can rarely be applied to a biological system. A switching signal may cause the system to deviate from its normal operating point, making the results inconsistent with reality. Pseudorandom-code signals partly overcome this problem. In addition, the organism’s inherent rhythmic activity can sometimes be used as the identification input signal. Although this is not optimal, it is relatively convenient. (3) In biological-system research, sensitivity analysis of the estimated parameters to measurement-signal errors is important. When the measurement data represent only a few sampled values of the entire process, this issue is even more pronounced. It has been reported that when cardiac output is estimated from respiratory measurements, the estimated parameter is extremely sensitive to errors in the measurement data. Since measuring instruments inevitably have measurement errors, the proposed estimation method becomes impractical. (4) A multilevel hierarchical structure is a relatively natural description of biological systems, and dynamic processes with a wide range of frequencies exist within biological organisms. The complicated identification problem of simultaneously handling state variables at different levels, on different time scales, and in different forms presents new challenges for system identification.
In conclusion, the biomedical field is an important and broad arena for the application of system identification. At the same time, it presents many new challenges to system-identification theory. It can be expected that system-identification methods will undergo further development in biomedicine. Developments in biomedical applications will, in turn, push system-identification theory into a new stage.
11. Optimal Control
In a control system, the controller normally generates a control action and applies it to the controlled object, causing the object’s state to reach a predetermined goal. How can the controller be made to perform this function? In practice, there are different methods for designing controllers. If the control objective is to keep a certain variable stable, the simplest method is direct feedback control. That is, when the variable deviates from the predetermined target, the controller generates a control action in the opposite direction, causing the variable to return to its original value. However, the controlled object usually has inertia and other dynamic parameters, so simple negative feedback often cannot produce satisfactory results. For example, it may take a long time to restore the original value—in other words, the transient process may be too long—or oscillation may even occur, preventing normal operation. Therefore, to achieve good control, control must be generated not only according to the amount of deviation, but also according to the rate of change of the deviation (its derivative) and/or its integral. This may improve the regulation characteristics and constitutes so-called P, I, and D (proportional, integral, and derivative) regulation.
Industrial regulators often use this type of control. By adjusting the proportional coefficients of the three quantities, good control results can be obtained for different objects. Similar regulating mechanisms also exist in biological regulation systems. These forms of regulation belong to the scope of classical control theory.
Modern control theory not only requires improved control performance, but also hopes to obtain the optimal control effect under certain conditions. “Optimal” generally means making a predetermined performance index reach its maximum (or minimum). For example, suppose a drug is used to control a patient’s blood pressure. If the requirement is that the drug concentration in the blood must not exceed a certain value while blood pressure is restored to normal as quickly as possible, this is an optimal-control problem. Here, the control is drug administration, the performance index is recovery time, the constraint is that the drug concentration must not exceed a specified value, and optimal control is the best drug-administration plan.
Optimal-control problems originally arose from engineering practice, such as how to make a motor start and brake as quickly as possible. By the mid-1950s, solutions had been found for some specific situations. From the late 1950s to the early 1960s, two general theories of optimal control were proposed: the maximum principle and dynamic programming. These two methods provide necessary conditions for an optimal-control solution under fairly general conditions; in principle, an optimal-control solution can be found. When the maximum principle is used to solve the problem, one encounters a two-point boundary-value problem for differential equations, and it is not easy to obtain specific numerical values, but some properties of the optimal-control solution can be obtained. When rapidity or certain other performance indices are required, optimal control is often bang-bang control (that is, the control action takes only the maximum or minimum permitted value). This is relatively suitable for applications involving the control principles of biological systems. For example, the rapid saccadic movement of the eyeball may be achieved by bang-bang control. With the dynamic-programming method, after the corresponding optimality equation has been written, a digital computer is usually used to solve it step by step. It is more suitable when specific control values are needed, such as when calculating a specific optimal drug-administration schedule. In actual applications, however, the appropriate method must be decided according to the particular circumstances.
An optimal-control solution is generally a nonlinear function of the state; it varies with the system parameters, the constraints, and the performance index. Therefore, when applying optimal control, it is necessary to know in advance the parameters of the model of the controlled object accurately and to select a suitable optimality index.
Many problems in biomedicine can be formulated as optimal-control problems and solved using optimal-control theory. Optimal-control theory has already been used to address a number of biomedical problems. In studying the control principles of biological organisms, optimal-control theory has been applied to study and explain the rapid movements of the eyes in following a target. In the immune system, both the process by which plasma cells differentiate after antigen stimulation and the process by which plasma cells first produce IgM and then switch to producing IgG conform to the time-optimal-control principle. This indicates that organisms have achieved optimal control effects during the course of evolution. In clinical applications, researchers were already studying the problem of optimal drug therapy in the early 1960s. The models used at that time were too simplified for practical application. In recent years, mathematical models based on pharmacokinetics and cell kinetics have enabled more in-depth study of optimal-control problems in drug therapy, cancer chemotherapy, and radiation therapy. Moreover, improvements in measurement technology now make it possible to obtain model parameters more accurately, so the results of optimal-control research can provide a basis for clinicians choosing optimal treatment plans.
There are also some limitations on the application of optimal control in medicine. The solution of an optimal-control problem is closely related to the model describing the controlled object. Only when the model is completely accurate (with both its structure and parameters determined) are the resulting solutions truly optimal. In biomedical systems, however, it is very difficult to obtain an accurate mathematical model of the controlled object. Therefore, when applying optimal-control theory to medical problems, sensitivity should theoretically be studied—that is, the sensitivity of the optimal-control solution to changes in the model parameters. If the solution is not sensitive, then although the model may be inaccurate, the difference between the theoretical optimal-control solution and reality will not be large. The results calculated theoretically will consequently be relatively useful. In current practical work, a set of optimal-control solutions is often calculated using optimal-control theory (possibly corresponding to different constraint conditions and different performance indices), and a clinician selects one of the plans in light of experience.
Next, we will introduce an application of optimal control to drug administration. Drugs are the most basic means of treatment. At present, drug administration is determined according to a program specified in advance or according to a physician’s experience, without adequately considering individual differences or making full use of the drug. To reduce drug toxicity and increase efficacy, improvements can of course be made to the drug itself—for example, locally administered drug-delivery methods using films are currently being studied. On the other hand, even with existing drugs, better results can be achieved by determining the administration times and dose at each administration more rationally. Applying optimal-control theory to design a drug-administration plan is intended to achieve this goal.
Optimal drug-administration control is generally combined with pharmacokinetics and is based on a compartment model reflecting the distribution, metabolism, and excretion of the drug in the body. One study concerned the optimal design of the doses and dosing times for oral ABPC (an antibiotic) and digoxin (a cardiac glycoside). First, the pharmacokinetic model of the drug was analyzed. Three-compartment (the digestive tract, blood, and peripheral compartment) and two-compartment (with blood and the peripheral compartment combined into one compartment) models were compared by estimating their parameters from experimental data; the two-compartment model was found to be more reasonable. On this basis, it was assumed that the drug concentration in the blood had to be maintained no lower than the minimum effective concentration (the constraint), while the total amount of drug was to be minimized (the performance index). Since an orally administered drug can be regarded as a pulse input, optimal-control theory can be used in this situation to calculate the optimal drug-administration plan.
Taking ABPC as an example, its minimum effective blood concentration is 0.1 mg/L. If it is administered four times a day at uniform intervals (that is, once every six hours), the change in drug concentration is as shown in Figure 3-23. The dose on each occasion is 134 mg, and the total dose is 536 mg. With the usual method of administration—taking it after the three meals and before going to bed—the dosing times are not equally spaced. Its optimal dose is different on each occasion, while the total dose is 794 mg, as shown in Figure 3-24. This figure also shows (with a dashed line) the blood-drug-concentration curve when 134 mg is still administered each time.
[The page contains the ABPC concentration diagrams reproduced below.]
ABPC
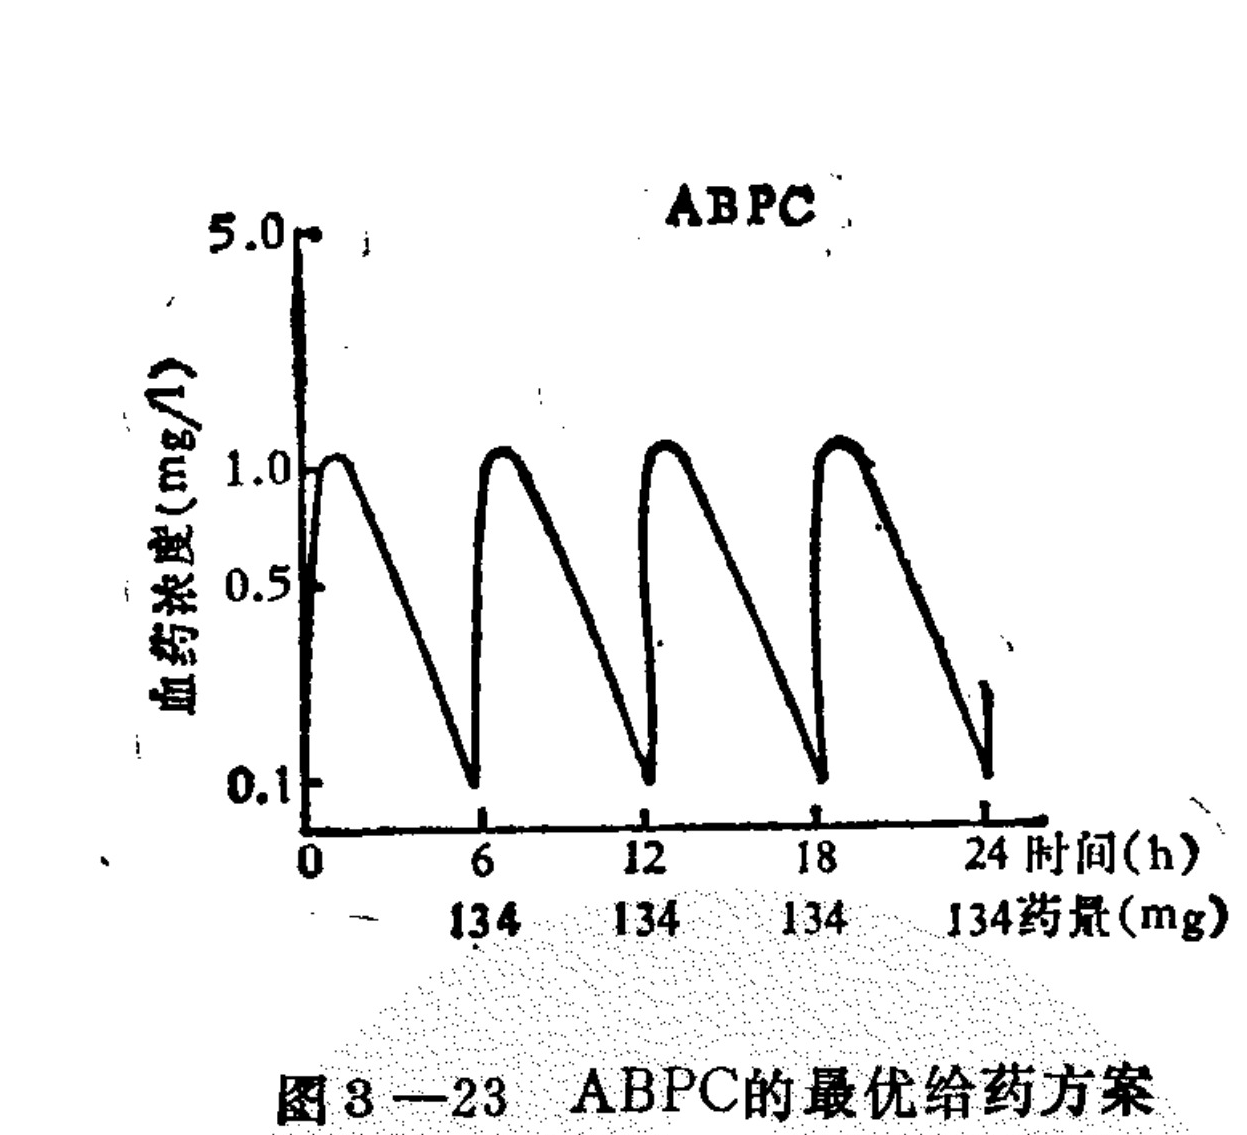
Figure 3-23. Optimal drug-administration plan for ABPC.
Translated labels: ABPC; Blood drug concentration (mg/L); Time (h); Dosage (mg)
- Blood-concentration axis markings: 5.0, 1.0, 0.5, and 0.1 mg/L.
- Time axis: 0, 6, 12, 18, and 24 hours.
- Doses shown: 134, 134, 134, and 134 mg.
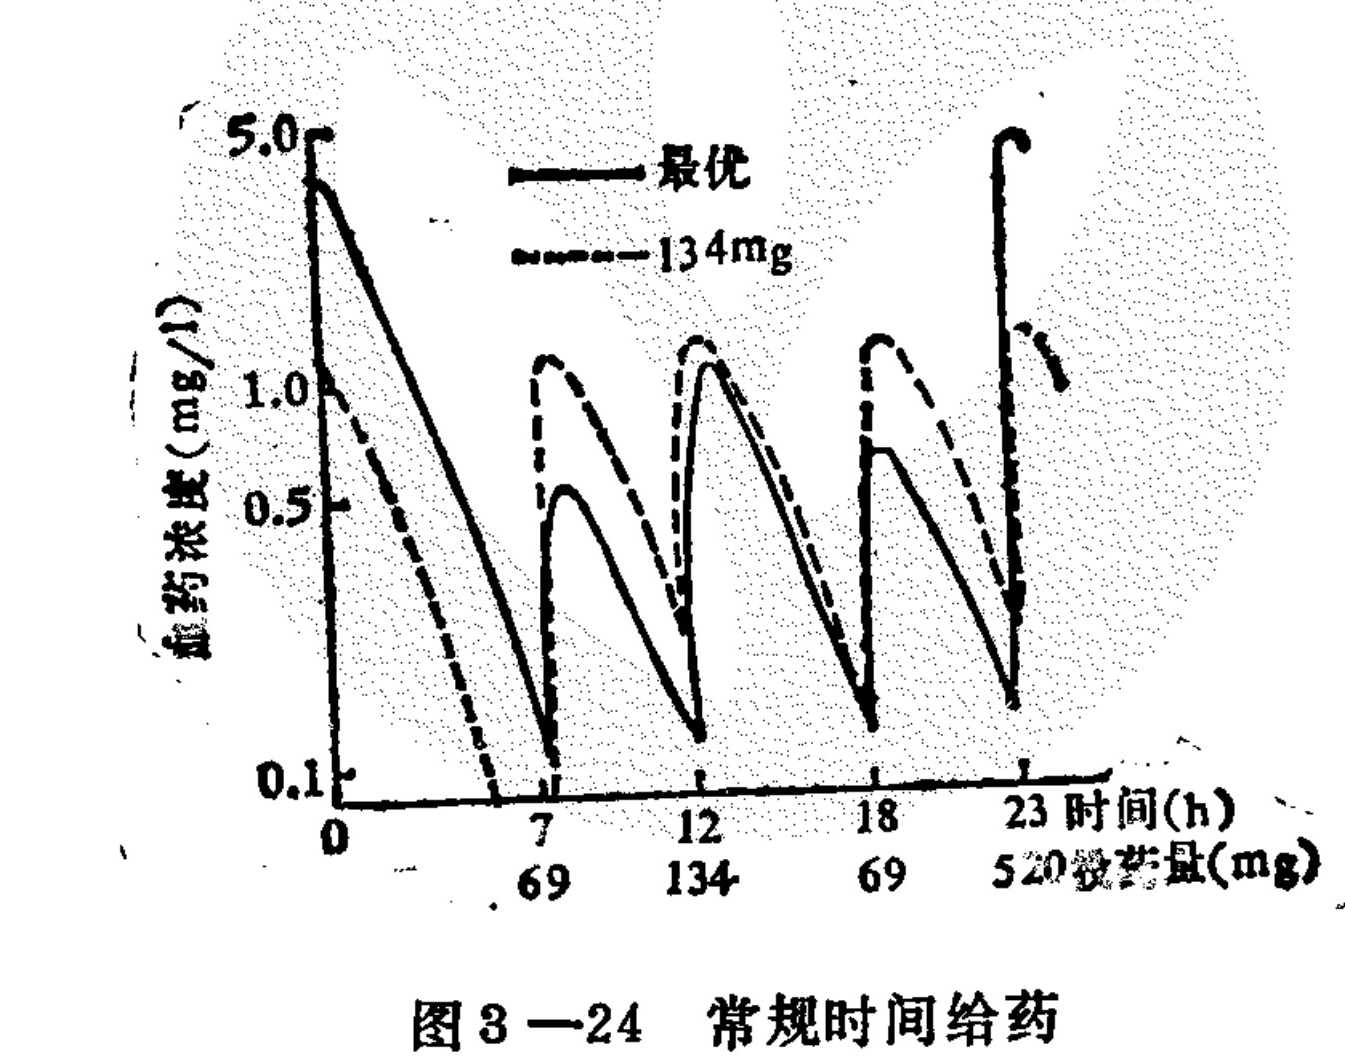
Figure 3-24. Administration at conventional times.
Translated labels: Blood drug concentration (mg/l); Optimal; 134mg; Time (h); Dosage amount (mg)
- Dashed-line label: each dose = 134 mg.
- Time axis markings: 7, 12, 18, and 23 hours.
- Dose labels shown: 69 mg, 134 mg, 69 mg, and 520 mg.
For the blood-drug-concentration curve at this point, there is a period during which the blood-drug concentration falls below the minimum required level. Similar results were obtained for digoxin. That is, the optimal dosing times should be equally spaced. It can be seen that the usual method of administration is not the best. Of course, the derivation above was obtained under the assumption that the pharmacokinetic parameters of the drug remain fixed. In reality, these parameters may change with time, or may differ between day and night. Nevertheless, these examples show that there is room for improvement in current drug-administration methods. Optimal-control theory can provide a new tool for designing optimal drug-administration plans.
12. Adaptive Control
In fact, for many systems, not only can the parameters of their models not be known in advance, but they also change with time and circumstances. This is especially true of biological organisms. Generally speaking, their parameters differ greatly between individuals and may also change over time. Under these circumstances, it is difficult to use ordinary control methods and a fixed control structure to satisfy the control requirements for different individuals under all times and conditions. Therefore, it is desirable to seek new control methods.
In fact, biological organisms possess control that maintains their own stability under changing conditions. In other words, biological control systems have adaptive capability. It was precisely the adaptive function of biological organisms that inspired the proposal of adaptive-control methods in automatic-control technology. Such a control method can automatically change the structure or algorithm of the controller according to changes in the controlled object and its environment, so as to obtain satisfactory results under various conditions.
Some adaptive-control schemes were already proposed in the late 1950s. They used relatively intuitive methods to design systems, but were not very successful. This was because, even when the controlled object was linear, the entire adaptive-control system was nonlinear and time-varying, making it difficult to guarantee the stability of the whole system. It was not until the 1960s and early 1970s that design methods capable of ensuring stable operation of the system were gradually found, thereby solving, in theory, the design problem of adaptive-control systems. In the late 1970s, improvements in adaptive algorithms, together with the widespread application of microcomputers, made it possible to implement adaptive algorithms on microcomputers. Consequently, in recent years adaptive control has developed relatively rapidly in engineering, medicine, and other fields.
At present, adaptive-control algorithms can broadly be divided into three categories: gain scheduling, reference-model adaptive control, and self-tuning control. Gain scheduling mainly finds indirect indicators according to the possible changes in the system, and adjusts the system gain or regulator parameters correspondingly as the indicators change, in order to achieve better control. The reference-model method assumes the desired quality of the system and designs a parameter-invariant model as a standard. The control input is applied simultaneously to the controlled system and the reference model; their outputs are compared, and the difference between the two outputs is applied to the adjustment mechanism, thereby changing the control quantity and reducing the difference to a minimum. When the difference between the two outputs approaches zero, the controlled object is considered to have the same dynamic characteristics as the model, and the desired objective has been reached.
The key problem here is to design an adjustment algorithm capable of guaranteeing stable operation of the whole system. In self-tuning control, system identification is generally first used to obtain the parameters of the controlled system. Then, according to the different design methods for models with known parameters, the control algorithm is continually changed on the basis of estimated parameter changes, thereby achieving adaptation.
Generally speaking, gain scheduling is easy to implement, but its adaptive capability is poor and its stability is not necessarily guaranteed. Self-tuning control algorithms are the most complex, but have a broad range of adaptation and can achieve relatively high control quality. The reference-model method lies between the first two. Each has its own advantages and disadvantages, so the choice in practical applications should be made according to the specific circumstances.
Adaptive-control theory and technology have been applied to problems in biomedicine. Biological organisms themselves have obvious adaptive capability: they automatically adjust their internal control as the environment changes, thereby adapting to the environment. The adaptive-control viewpoint has been used to analyze some biological systems. For example, research on the respiratory system has confirmed that it is an adaptive system that meets the organism’s oxygen-supply requirements while minimizing the energy consumed by respiratory movement. Similarly, the vestibulo-ocular reflex system also has extremely strong adaptive capability. When prisms are used to reverse the left-right visual fields of the eyes, after several days the vestibulo-ocular reflex can adapt to this change. It has been proved that the flocculus of the cerebellum plays an important role in this adaptive control.
In recent years, adaptive-control theory and methods have developed rapidly, producing a wave of applications of adaptive control in various fields. In medicine, extensive exploratory work has also begun. For example, adaptive control has been explored for artificial pancreases, total artificial hearts, and left-ventricular assist devices. The control of administration of muscle relaxants during surgery and the control of analgesics after surgery have passed adaptive-control animal trials and begun clinical trials. Methods for simultaneously controlling the depth of anesthesia, an artificial ventilator, and muscle relaxation are being developed with electronic computers. Work on adaptive blood-pressure control is being carried out in many laboratories at home and abroad, and a considerable number of systems have already been used clinically.
In some clinical operations or in the postoperative period, the body’s blood-pressure regulation system may fail to function normally because of trauma and other disturbances. Blood pressure may become too low or too high, directly threatening the patient’s life. Clinically, manually administered drops of drugs to raise or lower blood pressure are used to address this problem, but it is difficult to achieve satisfactory results, and this also increases the burden on medical staff. Because patients differ greatly in their responses to drugs, with the maximum difference reaching several dozen times, it is necessary to adopt adaptive-control methods. The dynamic characteristics of patients’ blood-pressure responses to drugs have been studied. For example, for the commonly used antihypertensive drug sodium nitroprusside, a pseudo-random-code signal was used to control the drug-injection rate, the patient’s blood pressure was recorded, and the transfer function from blood pressure to sodium nitroprusside was obtained by the correlation method. The results showed that, for different individuals, the drug action time and blood-pressure-lowering effect—that is, the gain, time constant, and delay of the transfer function—differed greatly. Dopamine, epinephrine, and other drugs obtained from animal experiments showed similar conditions. Moreover, these three drugs can be represented by transfer functions of the same form, differing only in their parameters.
At present, all three major types of adaptive-control algorithms have been used in adaptive blood-pressure control. Animal experiments have demonstrated that the algorithms are feasible. We implemented adaptive blood-pressure control in animals using the reference-model method and self-tuning control, two kinds of algorithms. The same algorithm could be used both for raising blood pressure (with dopamine) and for lowering blood pressure (with sodium nitroprusside), and it was tried clinically in several cases with good results.
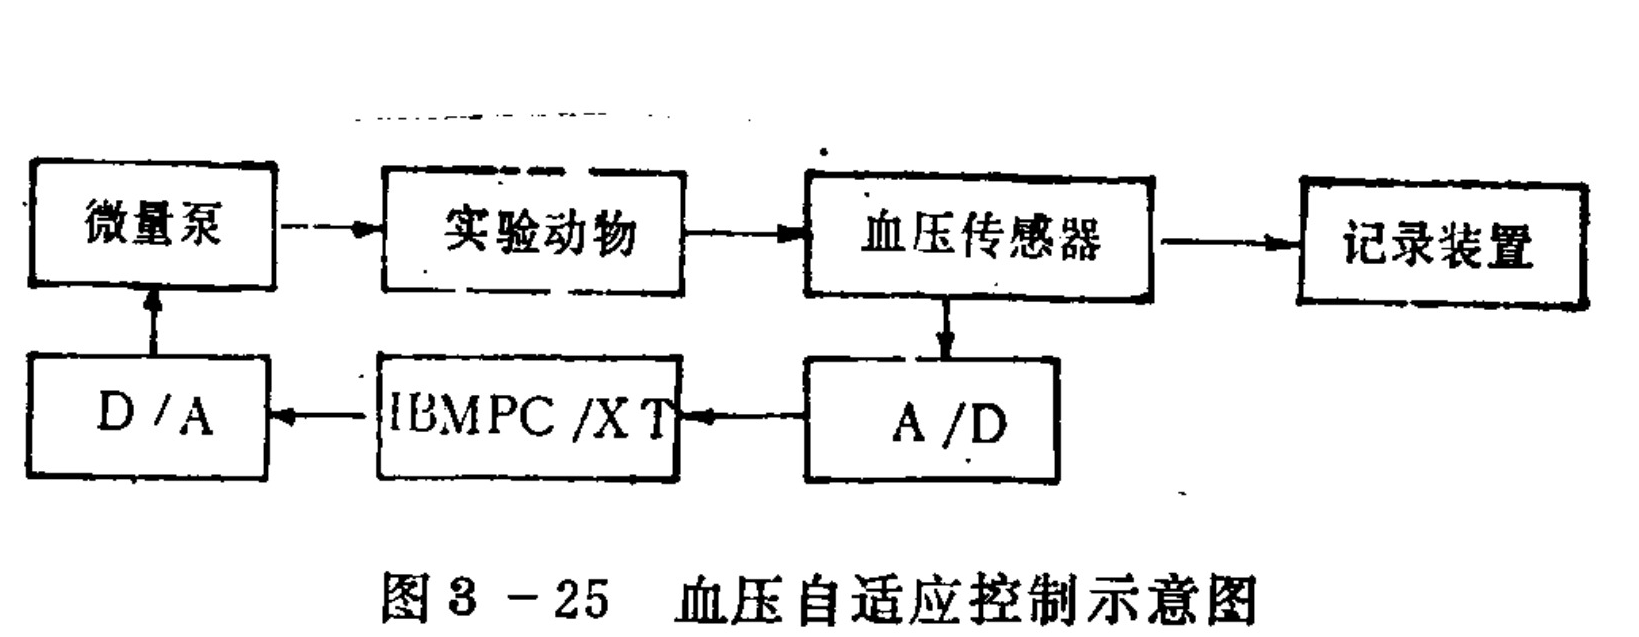
Figure 3-25 is a block diagram of an adaptive blood-pressure-control system. The system includes a blood-pressure sensor, a digital-to-analog converter, a microcomputer, and a micro-infusion pump for injecting medication. At present, blood pressure can only be measured through an indwelling catheter by means of a pressure sensor, so the system is suitable only for use during or after surgery and in critically ill patients. The measured blood pressure is converted into digital information and sent to the computer. The computer performs the adaptive-algorithm calculation, then outputs the calculated medication-infusion-rate signal to control the micro-pump and administer the drug. Under the action of the drug, the blood pressure
Translated labels: Micro pump; Experimental animal; Blood pressure sensor; Recording device; A/D; IBMPC/XT; D/A
Figure 3-25. Schematic diagram of adaptive blood-pressure control.
is stabilized at the set value. Such systems can already be used clinically. Figure 3-26 shows a record of adaptive blood-pressure control in clinical use. For comparison, manual adjustment was used at the beginning.
It clearly could not achieve satisfactory results. Then the adaptive-control system was connected, and the blood pressure quickly remained within ±10 millimeters of the set value. Even when a disturbance was introduced, it quickly returned to normal. This proves the effectiveness of the adaptive blood-pressure-control system.
Blood Pressure (mmHg)
←——Manual——→←——Adaptive Control——→
120
80
Drug Infusion Rate (ml/min)
80
40
0
-90 -60 -30 0 30 60 90
Time (min)
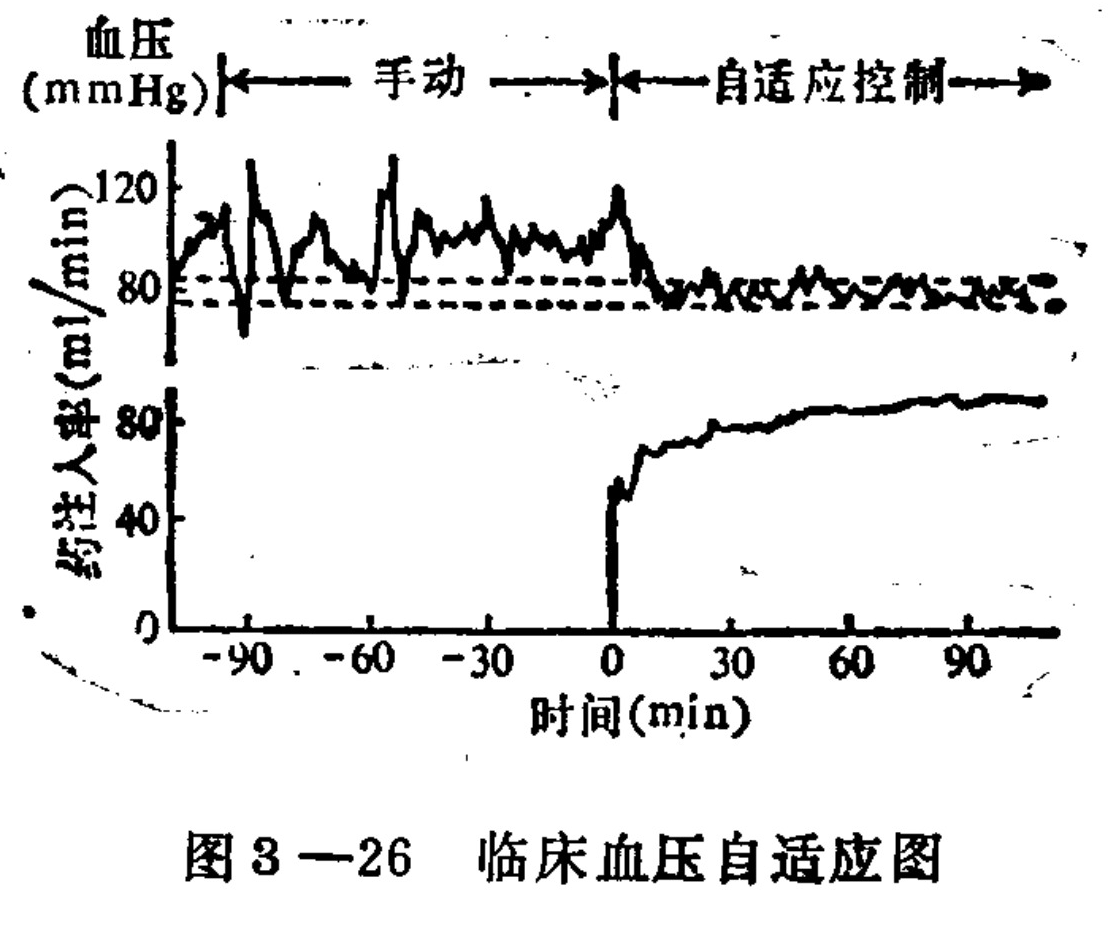
Figure 3-26. Clinical adaptive blood-pressure-control record.
Translated labels: Blood Pressure (mmHg); Manual; Adaptive Control; Drug Infusion Rate (ml/min); Time (min)
- Self-Organizing Systems
Control theory is an extremely rich discipline. Although the preceding text of this book gave a definition of control theory, that definition is not unique and may still be controversial. More than ten years ago, someone collected the definitions of control theory that had appeared in the literature; there were more than 100 of them. Different authors define its scope more or less broadly. For example, some believe that cybernetics is limited to the study of human-machine systems. Others believe that cybernetics should study only complex systems.
The scope of cybernetics mainly concerns systems, control, complexity, intelligence, and self-organization. Different authors emphasize different aspects: some emphasize systems, some emphasize intelligence, and some emphasize complexity and the capacity for self-organization. Some have proposed that the study of self-organizing systems should be the core of cybernetics. Below, we give a brief introduction to self-organizing systems.
Self-organization is an important characteristic of biological systems. From the late 1950s to the 1960s, during the early development of cybernetics, the structure and function of self-organizing systems, as well as models and analyses of self-organizing systems, were important topics in this field at that time. So-called self-organization refers to
Without external action, the system itself can automatically organize all its constituent units organically, and can alter the connections among them, enabling the system to accomplish its own tasks more effectively. Of course, in the course of self-organization, a system needs to absorb matter, energy, and information from the outside world. In 1959, a U.S. Navy research unit organized a multidisciplinary conference on self-organizing systems attended by 400 people. In 1961, a smaller conference on the principles of self-organization was held at the University of Illinois, with many leading experts in cybernetics participating. Both conferences published proceedings. At this stage, the work focused on exploring principles and making general analyses, and rarely involved specific objects. During this period, some models or devices with self-organizing capabilities were also established; the most famous was Rosenblatt’s perceptron. The appearance of the perceptron once promoted the development of this type of work, but its capabilities were limited, and by the mid-1960s such work gradually declined. Nevertheless, the perceptron remains a successful starting point for research on brain models and self-organizing systems.
On the basis of the earlier general research, research on self-organizing systems turned toward solving problems of specific self-organizing systems, with the greatest amount of work combining such systems with neural networks or brain structures. The brain is a system that clearly possesses self-organizing capability. It has been established that after the first year following birth, the number of brain cells no longer increases, while the specific content of the objective environments encountered by each person’s brain throughout life cannot be known in advance. Therefore, the connections among nerve cells cannot be predetermined by genetic information. It is generally believed that the brain completes the self-organization of its processing of information about the objective world through information input from that world, which induces plastic changes in the connections among neurons. A great deal of research has been carried out in this area, chiefly on the assumption that self-organization is achieved through plastic changes in the synapses connecting neurons. Usually, under certain rules for synaptic plasticity (for example, if the pre- and post-synaptic neurons are excited simultaneously, the synaptic conductance is increased), a system is formed according to a specified pattern of connections. After a learning process involving a certain information input, the system’s function is analyzed, or the self-organizing process is further simulated with an electronic computer and the capabilities of the self-organizing system are examined. In principle, self-organizing systems are a class of relatively complex nonlinear systems, which are difficult to study by analytical methods alone; computer simulation has therefore become an important tool in this type of research. Naturally, in the case of simplified models, some theoretical analysis can be made of such properties as system convergence, associative memory capacity, and resistance to interference. In recent years, owing to advances in research on the cerebellar cortex and the visual areas of the cerebral cortex, more precise data have become available on the structures of these two parts of the brain. Some researchers have gone on to investigate the self-organizing functions of these specific neural structures. For example, the visual areas of the cerebral cortex contain feature-extraction cells that respond specifically to particular stimuli. Animal experiments have already demonstrated that these feature-extraction cells vary with the animal’s growth environment; that is, they are formed through self-organization by receiving external information. Models reflecting the self-organizing process of feature-extraction cells in the cortical visual areas have been established to explain the mechanism of this process.
In short, research on self-organizing systems has developed from research into general principles to research into a particular class of concrete self-organizing systems. At present, it is progressing further into the study of specific self-organizing systems; in-depth investigation of these concrete systems may lead to new general principles.
Self-reproduction and self-repair are also forms of self-organization. von Neumann was a pioneer in the study of self-reproducing systems; one of his monographs presented highly illuminating results. This work has been applied to the study of cellular self-replication, and corresponding models have been established.
From another perspective, the development of new control principles progressed from feedback control to extremum-seeking systems and adaptive control systems, and then further gave rise to the concepts of self-organizing control systems, learning control systems, intelligent control systems, and so on. The concepts of these latter types of control systems overlap. In the view of the Control Systems Terminology Committee of the American Institute of Electrical and Electronics Engineers, a self-organizing control process is defined as follows: a control process that, during its development, uses information observable from the system’s inputs and outputs to reduce the a priori uncertainty involved in effectively controlling the system is a self-organizing control process. In other words, the characteristic of a self-organizing control system is that, through its operation, it can gradually accumulate experience and improve its own structure, thereby improving the performance of the control system as a whole.
The foregoing has described the state of research on self-organizing systems only from the perspective of information and control. Self-organizing processes also occur in certain physical and chemical systems. Self-organization can be studied from the perspective of nonequilibrium thermodynamics. Dissipative-structure theory and synergetics are important tools for studying self-organizing processes from another perspective. These will be discussed further in the next section.
XIV. Cybernetics and Catastrophe Theory, Dissipative-Structure Theory, and Synergetics
Cybernetics is a cross-disciplinary field with extremely broad applications. After cybernetics, several other cross-disciplinary fields emerged, such as catastrophe theory, dissipative-structure theory, and synergetics. These three fields are sometimes called the “new three theories,” while cybernetics, information theory, and systems theory are the original three theories. These disciplines have properties similar to those of cybernetics: their primary objects of study are also systems, and they all have broad possibilities for application and methodological significance. This reflects the deepening of humanity’s understanding of nature and society today, as well as the general trend toward synthesis on the basis of analysis in scientific research.
The following gives an extremely brief account of these three disciplines and points out their mutual relationships with cybernetics. Since these disciplines all have relatively complete theoretical foundations and have been tested in applications across broad fields, the introduction here is only very preliminary.
Catastrophe theory is a mathematical theory proposed in the 1960s by the French mathematician Thom to describe catastrophic phenomena in systems, reflecting the catastrophic process by which quantitative change becomes qualitative change in the objective world. Because catastrophic processes exist in many fields, the theory consequently has relatively general significance.
For a system, if nonlinear relationships exist among its variables (or states), then when one or several variables change continuously, the other variables may also change continuously in response. However, when an independent variable (called a control parameter in catastrophe theory) passes through a certain point (a point in control space), some variables undergo discontinuous or sudden changes. This is a catastrophe. Catastrophe theory attempts, by aEach type of catastrophe has a corresponding potential function and forms a different geometric shape in space. The principal problem is to find the solutions of:
∂V/∂xᵢ = 0
that form special points on the equilibrium surface. These special points are the turning points at which catastrophes occur. The geometry of the equilibrium surface reflects some global characteristics of the system. The different catastrophe types are named according to their geometric shapes.
The seven basic catastrophe types have the following forms of potential function:omena in biological systems, such as morphological development, bistable phenomena in visual perception, and changes in predator–prey populations in ecosystems. Catastrophe models have also been used to guide the treatment of anorexia nervosa. However, actual systems are generally relatively complex, and the actual phenomena that can be described by accurate mathematical models are still limited. Apart from extremely simple cases, some existing applications can provide only qualitative results. Catastrophe theory offers a new tool for structural analysis and structural identification of nonlinear systems, and in this respect may provide new approaches for extending cybernetics’ study of nonlinear control systems.
Dissipative-structure theory was established in the 1960s by the renowned Belgian scientist Ilya Prigogine. It is primarily a theory for studying self-organization in nonequilibrium systems. Classical thermodynamics mainly studies processes in equilibrium states. In this situation, increasing disorder and energy dissipation are characteristic of these processes, and the second law of thermodynamics governs them.
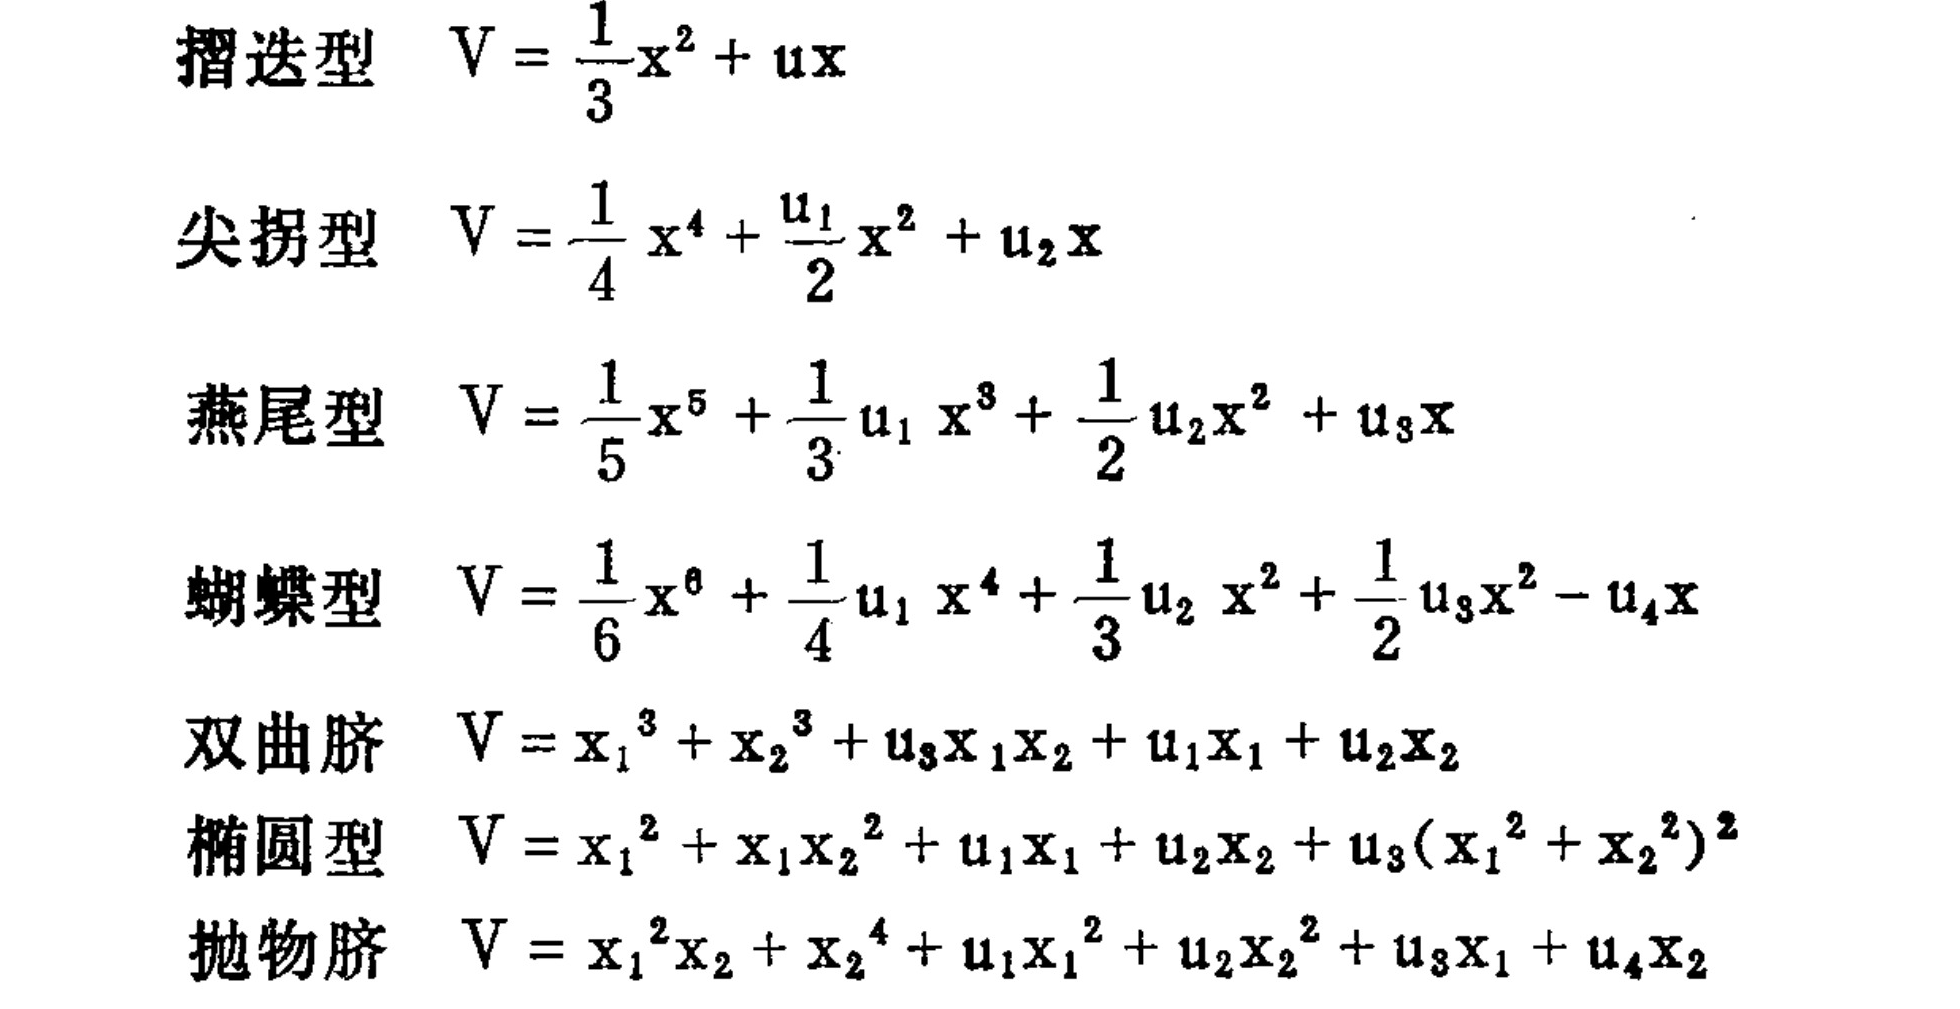
Table of mathematical formulas for various catastrophe theory models, listing the potential function V in terms of state variables and control parameters.
Translated labels: Fold; Cusp; Swallowtail; Butterfly; Hyperbolic Umbilic; Elliptic Umbilic; Parabolic Umbilic
Thus, the tendency of the movement of matter is toward balance, uniformity, and stillness; the system ultimately tends toward an unorganized state, and its structure tends toward extinction. Many processes in the physical world have these properties. On the other hand, we see a different picture in the processes of life: biological evolution has resulted in an increasing variety of species, while structures and functions have become ever more complex. It seems that the physical and biological worlds obey completely different laws. In fact, this is not so. Even in the nonliving world, there are phenomena in which macroscopic ordered structures form spontaneously. Under certain experimental conditions, these self-organizing processes can be reproduced. For example, in the heated fluid layer shown below, only heat conduction exists at first. When the fluid’s temperature gradient exceeds a certain critical value, the originally stationary fluid suddenly develops a highly regular hexagonal convection lattice, known as the Bénard pattern.
Prigogine’s theory of dissipative structures revealed the general laws governing self-organization. The systems studied by classical thermodynamics are closed systems: they exchange neither matter nor energy with the outside world and therefore eventually reach an equilibrium state. An open system, however, under conditions far from equilibrium, exchanges matter and energy with its external environment. It takes in matter and energy from outside (dissipation/input) and also discharges matter and energy (dissipation/output). During this process of matter-and-energy dissipation, a structure that maintains macroscopic spatial and temporal order is formed by internal nonlinear dynamic mechanisms. Prigogine called this a dissipative structure. In a dissipative structure, an open system tends toward an organized state: a stable state far from equilibrium. The system remains in this stable state, with irreversible processes continually occurring within it; matter and energy enter and leave, and construction and destruction continually occur simultaneously inside the system, yet its composition remains unchanged.
Dissipative-structure theory studies the laws of this type of self-organization, uses mathematical formulas to describe precisely the causes of self-organization and the conditions under which it arises, and points out the universality of this law and its broad prospects for application. Two necessary conditions for the formation and maintenance of a macroscopic ordered structure are that the system be maintained far from thermal equilibrium and that some nonlinear dynamic process exist. Because the study of nonlinear dynamic processes requires relatively advanced mathematical tools, the specific mathematical derivations and calculations will not be introduced here.
Clearly, biological systems also belong to the category of dissipative structures. Life processes require a continuous input of matter and energy, while waste and energy are discharged at the same time. Once this metabolism stops, life immediately comes to an end. After an organism dies, it undergoes a process of changing from organized to unorganized; this belongs to the thermodynamic process of equilibrium. Many people have applied dissipative-structure theory to explore and explain biological processes, such as the origin of life, evolution, morphogenesis, growth and development, the activity and transport of living matter, and the occurrence and prevention of cancer. In general, only qualitative conclusions can be obtained. Precise mathematical descriptions remain limited to relatively simple physical and chemical processes. For his contributions to the establishment of dissipative-structure theory, Prigogine received the 1977 Nobel Prize in Chemistry.
Synergetics was proposed in the early 1970s by the German physicist Hermann Haken. By 1977, its theoretical system had taken shape. Synergetics studies systems composed of many subsystems: how the subsystems cooperate to produce macroscopic structures and functions, and the laws and characteristics of the system’s transition from disorder to order through coordination.
In practice, every system can be decomposed into many subsystems, yet the behavior of the system we observe often cannot be obtained by simply adding together the behaviors of its subsystems. The result of the interactions among these subsystems makes the behavior of the whole system appear to be organized purposefully. Synergetics aims to study the common laws of the qualitative transformation of self-organization in systems far from equilibrium. Thus, the subsystems in synergetics may be of all kinds: they may be physical particles such as atoms, molecules, or protons; cells, tissues, or organs in a living organism; or animals, people, machines, factories, and so forth. Its subject is not restricted by the nature of the subsystems, but by the phenomena being studied; it emphasizes qualitative transformations. The formulation of systems here is consistent with that of cybernetics. Synergetics can therefore also be regarded as a theory for studying a particular type of system. Synergetics has found that although complex systems contain extremely large numbers of variables and subsystems, their macroscopic ordered structures are ultimately described by only a few parameters, and all subsystems are governed by a small number of variables. The variables that determine the degree of order in a system are called order parameters. For a complex high-dimensional system, once the order parameters governing the system have been found, its order-parameter equations can be identified. The order-parameter equations are low-dimensional, so they are comparatively easy to solve, making the discovery of order parameters very important. The order parameters of different systems may differ greatly. In a laser system, the order parameter is field intensity; in an economic system, it may be a cost value.
Synergetics has proposed not only concepts but also specific calculation methods. It uses the cooperation of many different techniques to discover the principles governing self-organization. It connects dynamical systems with statistical physics, discusses the evolution of systems, and considers the role of fluctuations in phase transitions. Fluctuation and selection (or competition) drive the evolution of systems, making the principles of synergetics applicable to both nonequilibrium and equilibrium phase transitions. Synergetics developed the use of order parameters to describe complex systems. Applying the adiabatic-elimination principle, at the critical point variables are divided according to damping magnitude into two types of processes, fast and slow. Fast-changing processes do not play a decisive role in the properties of the system; the slowly changing parameters determine the system’s evolution. Thus, the fast variables can be eliminated and the order-parameter equations established. Solving these equations yields the overall ordered state of motion and structure. Synergetics has developed a complete set of mathematical methods for establishing and solving order-parameter equations. Moreover, by changing the control parameters, the order parameters can be changed, causing the system to undergo a desired qualitative transformation. These methods can be applied to a fairly broad range of phenomena. In addition to solving physical and chemical problems, synergetics is used to investigate social and economic systems, ecological systems, morphogenesis, linguistics, and many other problems. Although for many problems only qualitative results with heuristic value can currently be obtained, the introduction of macroscopic order parameters by synergetics has made quantitative research into many complex systems possible.
The three theories described above, like cybernetics, all study systems. They discover and seek, from relatively simple matters such as mathematics, physics, and chemistry, the common laws governing self-organizing transformations in complex systems, and extend them to biological, social, and economic fields. Their founders were mathematicians or physicists, and their theories are based on rigorous mathematical foundations. However, judging from the current situation, truly complex systems still cannot be expressed accurately in mathematics. In general, only qualitative results can be obtained. Although these theories have a very broad scope of application, they remain limited to one aspect of particular types of systems. They can be incorporated into the framework of the more broadly encompassing cybernetics and become new tools for cybernetic research. These theories focus on problems that cybernetics and systems theory have not explored deeply enough, emphasizing system evolution and qualitative transformation, and primarily studying nonlinear systems. Their ways of formulating problems and their mathematical methods of application also differ from those of traditional cybernetics. Therefore, the development and incorporation of these theories will enrich the content of cybernetics and broaden its range of application.
Chapter Four: The Respiratory System and Qigong
The tissue cells of the human body constantly carry out oxidative activity, and the oxygen they require is obtained through respiration. The main physiological function of the respiratory system is to complete gas exchange. Because the body’s stored oxygen is very limited—enough for only a few minutes of consumption—the respiratory system must work continuously to ensure the supply of oxygen required for metabolism. The role of respiration in qigong practice has always received considerable attention; regulating the breath is one of the key factors in qigong. The respiratory system is the body’s mechanism for continuously exchanging matter with the outside world and is a necessary guarantee of normal metabolism inside the body. Respiration is controlled both by the autonomic nervous system and voluntarily, so it may become a bridge between the voluntary-movement and autonomic-movement systems. These characteristics of the respiratory system make it capable of playing an important role during qigong practice. One important function of qigong is to control the body’s metabolic processes and establish a connection between consciousness and control of the internal environment. This section discusses the basic structure and functions of the respiratory system, its physiological regulation, models of respiratory-system control, the role of the respiratory system in qigong, and changes in the respiratory system during qigong practice.
1. Basic Structure and Functions of the Respiratory System
The respiratory system consists of the respiratory tract, which conveys gases, and the lungs, where gases are exchanged. The respiratory tract consists of the nose, pharynx, larynx, trachea, and bronchi. The respiratory tract above the trachea is called the upper respiratory tract. The trachea branches repeatedly into bronchi of various orders and bronchioles. These are passages through which gases flow. The terminal bronchioles branch further into respiratory bronchioles. After approximately three more rounds of branching, the respiratory bronchioles become alveolar ducts and alveolar sacs, whose walls consist entirely of alveoli; these are the structures for gas exchange. The trachea and its branches of various sizes resemble an inverted tree. Each successive branching is called a first-order branch; the longest airway has approximately 23–25 orders of branching. In adults, the trachea has a diameter of approximately 2.5 centimeters, while the terminal respiratory bronchioles have a diameter of approximately 0.45 centimeters. The diameter of the airways has a very great influence on airflow resistance. The contractile activity of the airway smooth muscle is an important factor affecting airway diameter and airflow resistance. Smooth-muscle tone is regulated by neural and humoral factors.
The alveoli are the smallest functional units of the lungs. The human body has approximately hundreds of millions of alveoli. An alveolus is a hemispherical air sac; their sizes are not uniform, and the average diameter is approximately 0.1 centimeters. Because of the action of a surfactant secreted by the alveoli, and because surface tension changes with alveolar size, collapse of the small alveoli and overexpansion of the large alveoli can be prevented, thereby maintaining the relative stability of alveolar volume.
The principal function of the respiratory system is gas exchange. The act of inhalation draws fresh air through the airways into the alveoli. The gases in the alveoli exchange with those contained in the blood of the capillaries: oxygen enters the blood, while carbon dioxide in the blood is discharged into the alveoli and then exhaled from the body through the airways.
Breathing is caused by the mechanical movement of the thorax. The thorax is shaped somewhat like a hollow cone, small above and large below. The diaphragm forms the bottom of the thorax. When it contracts, the dome moves downward, which increases the vertical diameter of the thorax. When the vertical, anteroposterior, and transverse diameters of the thorax increase, the thoracic cavity and lung volume expand, constituting inhalation. When the ribs and sternum descend and the diaphragm relaxes, the dome rises back to its original position, the anteroposterior, transverse, and vertical diameters of the thorax decrease, the thoracic cavity and lungs contract, constituting exhalation.
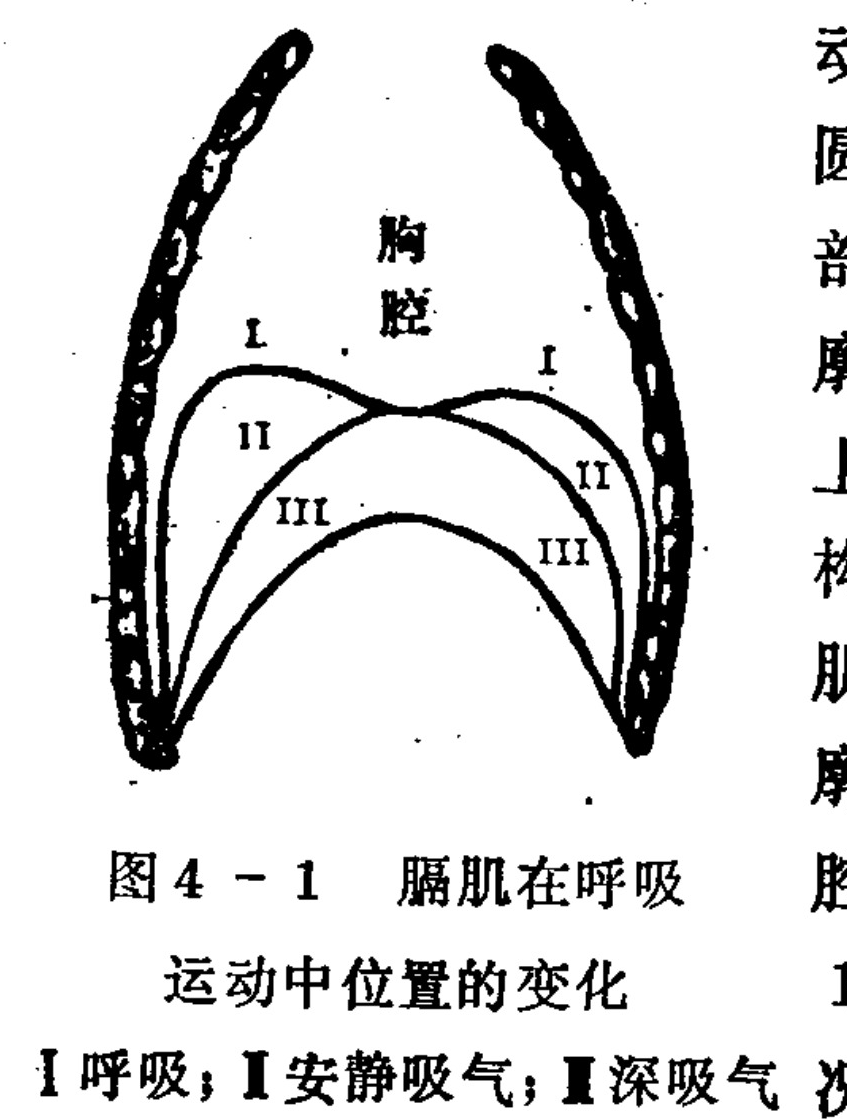
Figure 4–1. Changes in the position of the diaphragm during respiratory movement.
Translated labels: thoracic cavity; I respiration; II quiet inspiration; III deep inspiration
I respiration; II quiet inspiration; III deep inspiration
The intercostal muscles are also one of the driving forces of respiratory movement. The diaphragm and external intercostal muscles are inspiratory muscles, while the internal intercostal muscles are expiratory muscles. When the diaphragm contracts to produce inhalation, the abdominal viscera move downward, intra-abdominal pressure increases, and the abdominal wall bulges outward. When relaxation of the diaphragm produces exhalation, the abdominal contents move upward and return to position, and the abdomen contracts. Thus, movement of the diaphragm is always accompanied by movement of the abdominal wall. If respiratory movement is mainly due to diaphragm activity, the rising and falling movement of the abdominal wall is more obvious; this is called abdominal breathing. During forceful inhalation, other accessory inspiratory muscles also participate in respiratory contraction. When the intercostal and abdominal-wall muscles participate in contraction, they further reduce the volume of the thoracic cavity; exhalation at this point is no longer passive but becomes an active movement.
The capacity of the respiratory system is measured by the volume of inhaled and exhaled gas. In quiet breathing, the amount of air inhaled or exhaled in each breath is called the tidal volume, generally approximately 400–500 milliliters. In a resting state, approximately 25% of tidal volume comes from contraction of the external intercostal muscles of the thorax, while 75% comes from movement of the diaphragm. The product of tidal volume and the respiratory rate per minute is the minute ventilation.
After a maximum deep inhalation, the greatest volume of air that can be exhaled by deep exhalation is called the vital capacity. When, after deep inhalation, a person exhales at maximum speed, the volume exhaled within a specified period is called the timed vital capacity. Vital capacity and timed vital capacity reflect the working capacity of the respiratory organs.
When the lungs expand, air is drawn into them; when the lungs contract, part of the air in the lungs is exhaled. Under ordinary conditions, minute ventilation is determined by the rate of metabolism in the body. In a resting adult, minute ventilation is approximately 6–8 liters; during strenuous exercise, it can reach several tens of liters. The minute ventilation achieved by the maximum amplitude and speed of breathing is called the maximum voluntary ventilation. Measuring maximum voluntary ventilation is one of the commonly used methods for examining pulmonary ventilation function.
Because gas exchange occurs in the alveoli, alveolar ventilation has greater physiological significance than pulmonary ventilation. The fresh air inhaled in each breath does not all enter the alveoli: only the first portion of the inhaled air enters the alveoli, while the last portion remains in the airways. The airways have no gas-exchange function; their volume is called the anatomical dead space (or dead space). Minute alveolar ventilation equals the tidal volume minus the dead space, multiplied by the respiratory rate.
When tidal volume is reduced by half and the respiratory rate is doubled, minute pulmonary ventilation remains unchanged, but minute alveolar ventilation decreases. Therefore, considering ventilation efficiency, deep and slow breathing is more efficient than shallow and rapid breathing.
II. Regulation of Respiratory Movement
The function of the respiratory system depends on the movement of the respiratory muscles. The purpose of respiratory movement is to meet the organism’s metabolic requirement for oxygen. Accordingly, under ordinary circumstances, respiratory movement is controlled by the level of metabolism. When people are at rest, the metabolic level of the body is low and breathing is slow. During heavy physical labor or strenuous exercise, metabolism accelerates and breathing also becomes faster. These changes are carried out automatically through the autonomic nervous system.
On the other hand, the respiratory muscles—including the diaphragm and intercostal muscles—are skeletal muscles. Respiratory movement is therefore also like the movement of other skeletal muscles: it is controlled by the cerebral cortex and can be performed voluntarily. In daily life, people encounter special circumstances that require respiratory movement to be changed in response to environmental changes. For example, when passing a foul-smelling ditch or an area filled with harmful gases, it may be necessary to stop breathing temporarily. During activities such as swimming or long-distance running, breathing must be adjusted voluntarily to achieve better coordination and better performance. Human beings have a strong capacity to control respiratory movement. The rate of metabolic processes can also be changed by controlling respiratory movement; for example, yoga practitioners can reduce the body’s metabolic rate to an extremely low level, approaching a state of hibernation.
The autonomic regulation of respiratory movement is generally understood as follows. There is a respiratory regulatory center in the pons that controls normal rhythmic respiratory movement. In addition, there is a prolonged-inspiration center in the lower part of the pons. When control from the regulatory center and the vagus nerve is lost, the prolonged-inspiration center can cause excessive excitation of the inspiratory center, producing prolonged-inspiration breathing.
In the medulla there is a respiratory center. It includes two groups of neurons: one group forms the inspiratory center, and the other forms the expiratory center. Neurons within each group are functionally interconnected and coordinated, while the two groups are functionally antagonistic. They receive signals from carbon dioxide and hydrogen ions in arterial blood and alternate between excitation and inhibition. When the inspiratory center is excited, it inhibits the expiratory center and sends nerve impulses into the spinal cord, strengthening contraction of the inspiratory muscles and producing inhalation. After a period of excitation, the excitability of the inspiratory center falls and the expiratory center becomes excited, inhibiting the inspiratory center and relaxing the inspiratory muscles to produce passive exhalation. When the expiratory center is more strongly excited, it also sends nerve impulses into the spinal cord, causing the expiratory muscles to contract and producing active exhalation. When the excitability of the expiratory center subsequently decreases, the inspiratory center is excited again, inhibiting the expiratory center and beginning another inspiratory movement.er is excited, no nerve impulses are transmitted to the adjustment center, and its inhibition of the expiratory center also ceases. This negative-feedback connection between the inspiratory center and the adjustment center accelerates the process of conversion between inhalation and exhalation.
Excitation of the respiratory center causes respiratory-muscle movement through spinal neurons. The diaphragm is innervated by the phrenic nerve, whose neurons are located in the anterior horn of the cervical spinal cord gray matter. The intercostal muscles are innervated by the intercostal nerves; the intercostal neurons are located in the anterior horns of the gray matter of the thoracic spinal cord. Spinal neurons alone cannot spontaneously generate rhythmic activity. The regulation of respiratory rhythmic activity is shown in Figure 4–2.
Pons
- Pons
- Medulla oblongata
- Spinal cord
- Respiratory regulatory center
- Apneustic center
- Inspiratory center
- Expiratory center
- Expiratory-muscle neurons
- Expiratory muscles
- Inspiratory-muscle neurons
- Inspiratory muscles
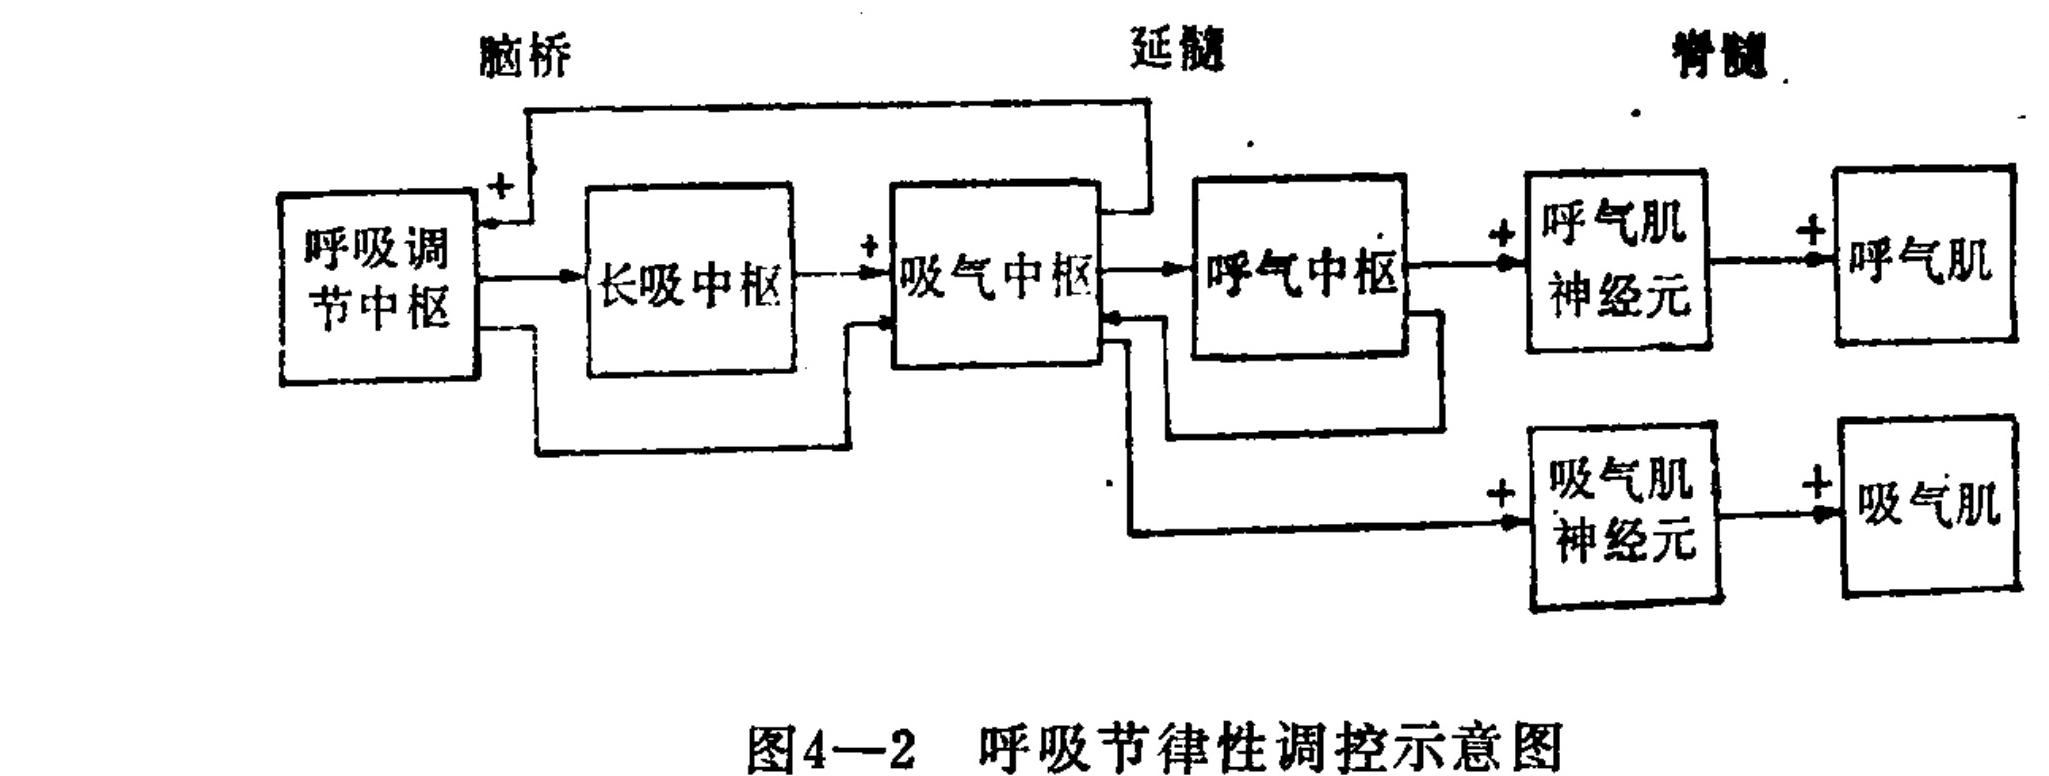
Figure 4–2. Schematic diagram of the regulation of respiratory rhythm.
Translated labels: Pons; Medulla Oblongata; Spinal cord; Respiratory adjusting center; Long inspiration center; Inspiration center; Expiration center; Expiration muscle neurons; Expiration muscles; Inspiration muscle neurons; Inspiration muscles
Autonomic respiratory movement is regulated reflexively by nerve impulses entering from various receptors. Among these, the chemoreceptor reflex is the most important. The carotid bodies and aortic bodies belong to this class of receptors. When hypoxia, excess carbon dioxide, or an increased concentration of hydrogen ions occurs, the respiratory response can be strengthened through the chemoreceptors.
In respiratory regulation, the role of the carotid bodies is greater than that of the aortic bodies. When the oxygen partial pressure in arterial blood is too low, respiration depends entirely on excitation of the carotid- and aortic-body chemoreceptors, whose impulses are transmitted to the center and reflexively strengthen respiratory movements. Excess carbon dioxide in arterial blood can also stimulate the carotid- and aortic-body chemoreceptors and the central chemoreceptors in the medulla, causing respiratory movements to increase. Changes in the concentration of hydrogen ions can excite the central chemoreceptors in the region near the roots of the glossopharyngeal and vagus nerves in the medulla; this then excites the respiratory center and thereby regulates respiratory movements. Hydrogen ions can also act on peripheral chemoreceptors such as those in the carotid bodies, thereby changing respiratory movements. In addition, there are stretch receptors in the smooth muscle of the pulmonary airways. When the lungs expand, these receptors receive stretch stimulation; their excitation is transmitted through the vagus nerve to the respiratory center, inhibiting activity of the inspiratory center. This is called the pulmonary stretch reflex. It is also a negative-feedback regulation: its function is to accelerate the transition between inhalation and exhalation, similar to the action of the respiratory adjustment center.
The respiratory muscles contain muscle spindles, a type of proprioceptor. When the respiratory center is excited and the neurons supplying the respiratory muscles are excited, the extrafusal and intrafusal fibers should contract synchronously. If airway resistance increases and the contraction force of the extrafusal muscle is insufficient, the muscle spindle will be stretched and emit nerve impulses, strengthening excitation of the respiratory center. In this way, the respiratory volume can still be maintained unchanged. All of the receptors mentioned above function to ensure that respiratory function can be carried out normally under different conditions.
The cerebral cortex can regulate respiratory-muscle activity. In addition to conscious control, activities such as speaking and singing require coordination of the respiratory muscles and depend on extremely fine regulation by higher centers. During emotional fluctuations, thought, and changes in mental energy and concen
Voluntary input (or other)
Phrenic nerve
Vagus nerve
Chemoreceptors
Circulation time delay
Oscillatory loop
Respiratory rate
Diaphragm
Lung mechanics
Lung pressure changes
Lung gas exchange (ventilation)
O2
CO2
Blood circulatory system
Arterial O2
CO2
O2 venous
Metabolism
Intercostal muscles
Lung stretch receptors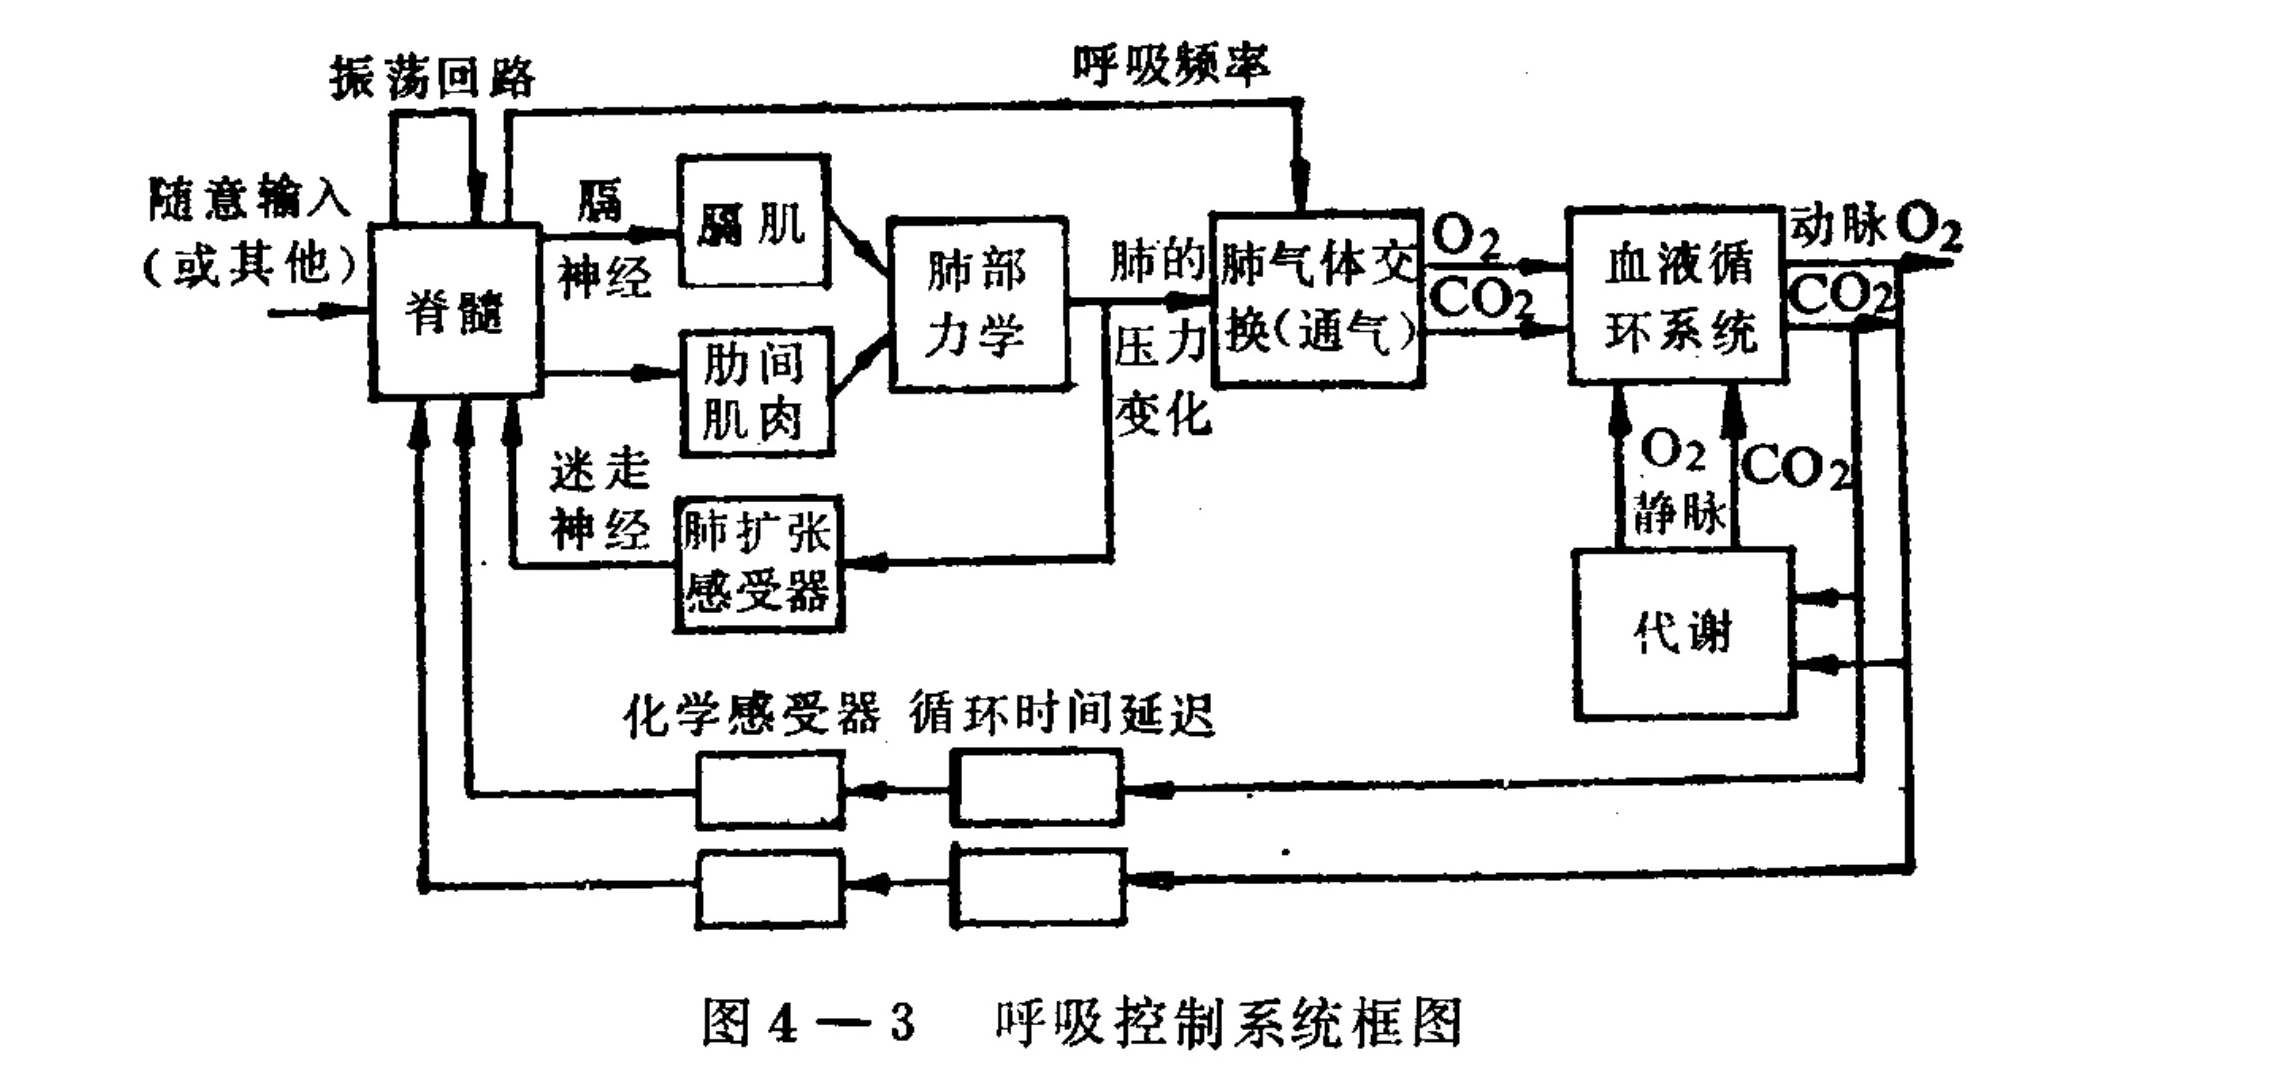
Figure 4-3 Block diagram of the respiratory control system
Translated labels: Spinal Cord; Voluntary Input; Oscillator Circuit; Breathing Frequency; Diaphragm; Intercostal Muscles; Lung Mechanics; Pulmonary Gas Exchange (Ventilation); Blood Circulation System; Metabolism; Vagus Nerve; Lung Stretch Receptors; Chemoreceptors; Circulation Time Delay
tration, the amplitude and frequency of respiratory movement are also affected. All of this reflects the control of respiration by higher centers. In addition, when body temperature rises, excitation of the hypothalamic thermoregulatory center can also increase respiratory frequency and promote heat dissipation. Regulation of respiration can be represented by the respiratory-control-system block diagram in Figure 4-3.
III. Mathematical Models of Respiratory-System Regulation
The principal function of the respiratory system is to complete gas exchange and thereby ensure the supply of oxygen within the body. To achieve this goal, it is necessary to regulate respiratory movements, pulmonary ventilation and gas exchange, and the various gas components in the blood. In autonomic control, negative feedback from the oxygen partial pressure, carbon-dioxide partial pressure, and hydrogen-ion concentration in arterial blood is the most important. These measurements transmit relevant information through chemoreceptors to the respiratory center, causing respiratory movements to change and regulating pulmonary ventilation so that these variables remain relatively stable.
At the beginning of respiratory-system modeling, researchers were limited to models of local structures and functions within the respiratory system, such as mathematical descriptions of the relationships between blood-gas partial pressures and ventilation, and between the mechanical properties of the lungs and the overall airflow pattern. To some extent, these models could reflect actual conditions in the respiratory system. However, because the subsystems of the respiratory system interact with one another, local models are insufficient for accurately simulating the respiratory system over a broad range, especially when the model must fit data from healthy people or different patients and provide clinical guidance. On the basis of the development of subsystem models, more comprehensive mathematical models that simulate respiratory-system dynamics have now been developed. These models include regulation of ventilation, gas transport, gas exchange, and hydrogen-ion regulation. They can simulate the dynamic processes of the respiratory system in healthy people and patients and have been widely used in teaching and in some clinical research. A monograph has discussed such complex models and their corresponding computer programs. Because of space limitations, this section introduces only several relatively simple models as examples of using models to study the respiratory system.
1. Chemoreceptor feedback-control model of ventilation
As stated in the preceding section, the chemoreceptor feedback from oxygen partial pressure, carbon-dioxide partial pressure, and hydrogen-ion concentration is the most important feedback in respiratory-system control.
These are all negative-feedback regulatory systems and can be analyzed and studied using control theory. This system can be represented by Figure 4-4. The entire system is divided into a controller and a controlled object. The controller includes the respiratory center and related neurons in the spinal cord, while the controlled object includes the lungs, the respiratory mechanism, the respiratory muscles, and the gas-exchange process. To avoid complicated mathematical calculations, we discuss only the steady-state condition, that is, the condition in which equilibrium is reached through regulation and control.
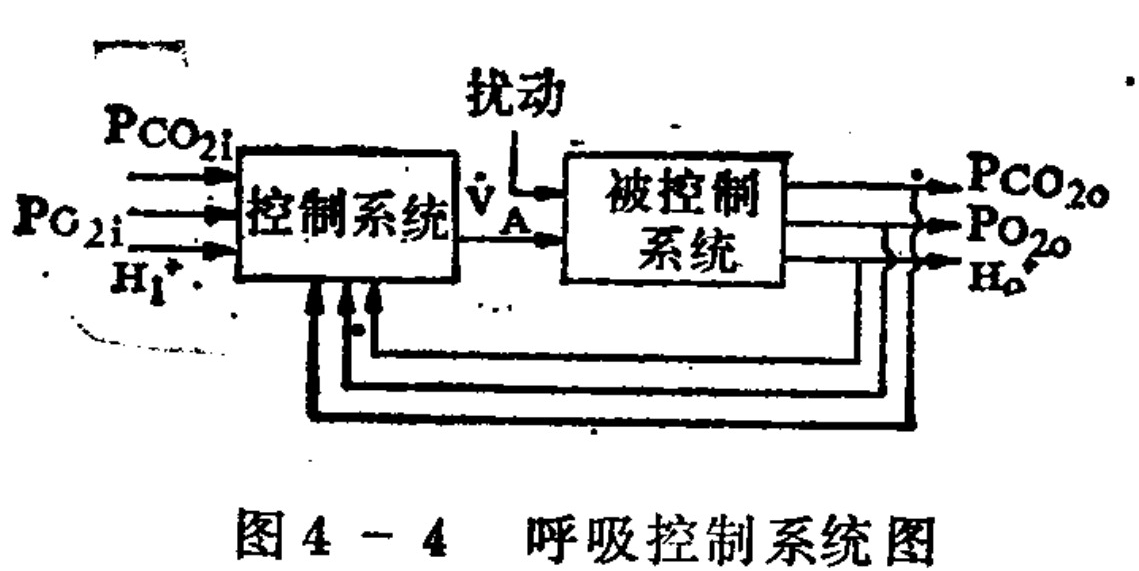
Figure 4-4. Respiratory-control system diagram
Translated labels: PCO2i; PC2i; H1+; Control system; Disturbance; VA (Ventilation); Controlled system; PCO2o; PO2o; Ho
To obtain the quantitative relationships among the system states under steady-state conditions, we can first derive the mathematical expressions for the controller and the controlled object separately, and then determine the relationships among the variables of the entire closed-loop system. We use several results already established in respiratory physiology. Assume that the three chemical factors in arterial blood—the oxygen partial pressure (P_O2), carbon-dioxide partial pressure (P_CO2), and hydrogen-ion concentration (H+)—act independently in the control system; their individual effects can therefore be added to obtain the total effect on the system. The total alveolar ventilation (V_A) is:
V_A = (V_A)_O2 + (V_A)_CO2 + (V_A)_H+
    = 1.1 f(H+) + 1.31 P_CO2 - 90 + 10.6 × 10^-8 (104 - P_O2)^4.2
In this expression, the unit of alveolar ventilation V_A is liters per minute; the unit of hydrogen-ion concentration (H+) is millimoles per liter; and the units of the oxygen and carbon-dioxide partial pressures, P_O2 and P_CO2, are millimeters of mercury. The equation shows that, when H+ and P_O2 are determined, V_A is also determined. The relationship between each component and each chemical factor can be written separately:
(V_A)_CO2 = aP_CO2 - b                         (4-1)
(V_A)_H+  = cH+ - b
(V_A)_O2  = d(m - P_O2)^2
Here, a, b, c, d, and m are constants.
The quantitative relationships of the controlled object—that is, the effects of pulmonary ventilation and the composition of inspired gas on P_CO2, P_O2, and H+—can be derived separately. According to the principle of material continuity, the theoretical expressions for the relationships between alveolar P_CO2 and P_O2 (approximately the same as arterial-blood P_CO2 and P_O2) and ventilation V_A are:
P_CO2 = P_CO2' + k·MR / V_A                 (4-2)
P_O2  = P_O2'  - k·MR / V_A
Here, P_CO2’ and P_O2’ are the partial pressures of carbon dioxide and oxygen in the trachea (or inspired gas), respectively; MR is the gas-exchange rate, assumed to be the same for both gases; and k is a unit-conversion constant. The equations show that, when the composition of the inspired gas is fixed and alveolar ventilation does not change, the increase in alveolar CO2 is exactly equal to the decrease in O2. Combining the two equations above with the relationship between H+ and V_A gives the mathematical model of the controlled object. The latter can be expressed approximately through the relationship between H+ and P_CO2 determined by the blood-buffer system:
H+ = aP_CO2 + b (4-3)Here, the values of a and b are determined by the composition of the blood bicarbonate buffer, oxygen capacity, and oxygen saturation.
Jointly solving (4-1), (4-2), and (4-3), the steady-state mathematical models of the controller and controlled object, gives the effects of disturbances caused by changes in the inspired-gas composition and metabolism on V_A, P_CO2, P_O2, H+, and other variables in the closed-loop condition. For simplicity, we further examine the single-loop case and consider only P_CO2 as the feedback variable. In this case the system is as shown in Figure 4-5. Assume that the other loops are in standard conditions. The controller equation can then be approximated by:
V_A = 2P_CO2 - 75 (4-5)To correspond to the form of a general feedback system, rewrite the above equation in the following form:
V̇_A = 2(P_CO₂ − 40) + 5 (4-6)Here 40 corresponds to the set point; that is, P_CO₂i = 40. This numerical choice is arbitrary; we do not know the body’s actual set point, but taking P_CO₂i = 40 is approximately reasonable. Since V̇_A increases when P_CO₂ increases, equation (4-6) has a sign opposite to that in the block diagram, but it reflects the actual situation. To simplify the analysis, linearize the equation of the controlled object:
P_CO₂ = (A − B V̇_A) + P′_CO₂ (4-7)Substituting equation (4-6) into equation (4-7) gives the closed-loop equation:
P_CO₂ = P′_CO₂ + [A − B(2P_CO₂ − 40) + 5] (4-8)Thus:
P_CO₂ = K + [1/(1 + 2B)]P′_CO₂ (4-9)where:
K = (A + 85)/(1 + 2B)Equation (4-9) is the expression for the influence of inhaled carbon dioxide on the partial pressure of carbon dioxide in the blood. If the controller and controlled-object equations are further written in transfer-function form—that is, as the ratio of input to output—then:
(V̇_A − 5)/(P_CO₂ − 40) = 2                     (4-6′)

[P_CO₂ − (P′_CO₂ + A)]/V̇_A = −B                (4-7′)
The block diagram of the respiratory system regulating P_CO₂ is shown below. P_CO₂i enters the control system through a summing point; its output is V̇_A. The controlled system also receives P′_CO₂ as an input and produces P_CO₂o, which is fed back negatively to the summing point.
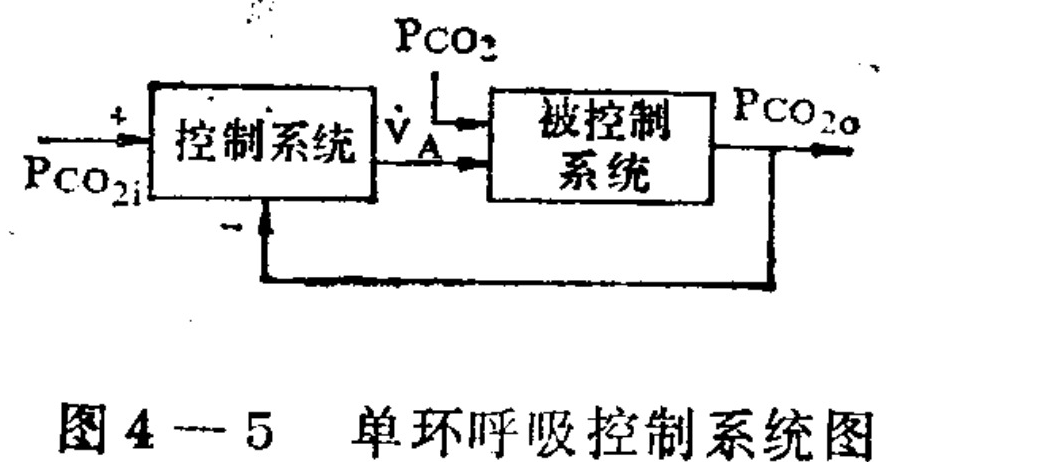
Figure 4-5. Single-loop respiratory control system
Translated labels: P_CO2i: Input CO2 partial pressure; Control System: Control System block; V_A: Alveolar ventilation output signal; P_CO2: Disturbance CO2 partial pressure input; Controlled System: Controlled System block; P_CO2o: Output CO2 partial pressure
PCo26
02; PCO2.6            Pcoz(DA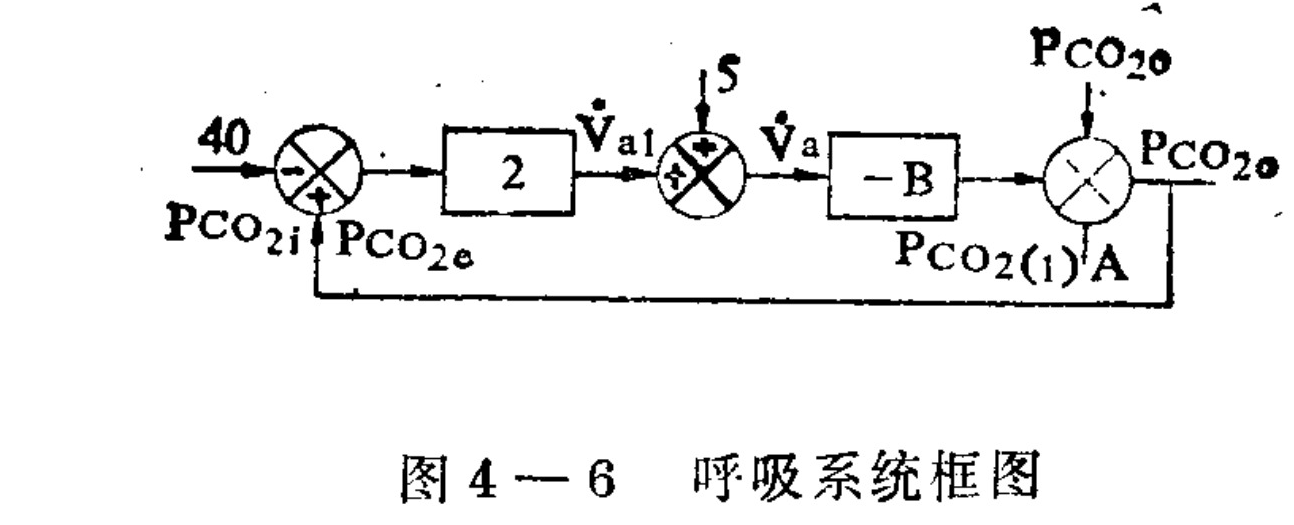
Figure 4-6. Respiratory-system block diagram
Translated labels: 40; P_CO2i; P_CO2e; 2; V_a1; 5; V_a; -B; P_CO2(1); A; P_CO2o
If equation (4-2) is not linearized, the nonlinear equations can also be solved simultaneously to obtain the corresponding solution. Within the normal operating range, the difference between the [Pco₂] values obtained from the linear and nonlinear equations does not exceed 2 mmHg. Thus, it meets general requirements. In addition, the linearized model in Figure 4-6 basically reflects the operation of the respiratory system. If the dynamics of each link are taken into account, a dynamic model of the system can be obtained. Analyzing or simulating the dynamic model can provide knowledge of the respiratory system’s dynamic processes.
2. Simulation study of ventilation control
We will continue to use the carbon-dioxide feedback loop as an example, consider the various factors affecting respiratory ventilation, and use computer simulation to study the effects of these factors on the dynamic process. In this control system, in addition to considering the effect of Pco₂ on ventilation, we also consider the transport time for blood to travel from the periphery to the brain. The controlled object can be represented by the model diagram in Figure 4-7. In this system, if a sudden change in the carbon-dioxide content of the inhaled gas is used as the disturbance, gas exchange causes the carbon-dioxide concentration in arterial blood and tissues to rise. Because of the action of the chemoreceptors (especially the central receptors), respiratory movement is strengthened; consequently, alveolar ventilation increases, more oxygen is inhaled, and carbon dioxide is exhaled, causing blood Pco₂ to decrease. This is a typical negative-feedback system. Taking the arterial and venous circulation delay times as t₁ and t₂, respectively, and assuming that the carbon-dioxide dissociation curve of arterial blood is linear, that the carbon-dioxide partial pressures in the alveoli and arteries are equal, that cardiac output is constant, and that tidal volume is proportional to respiratory frequency, the following equations can be derived:
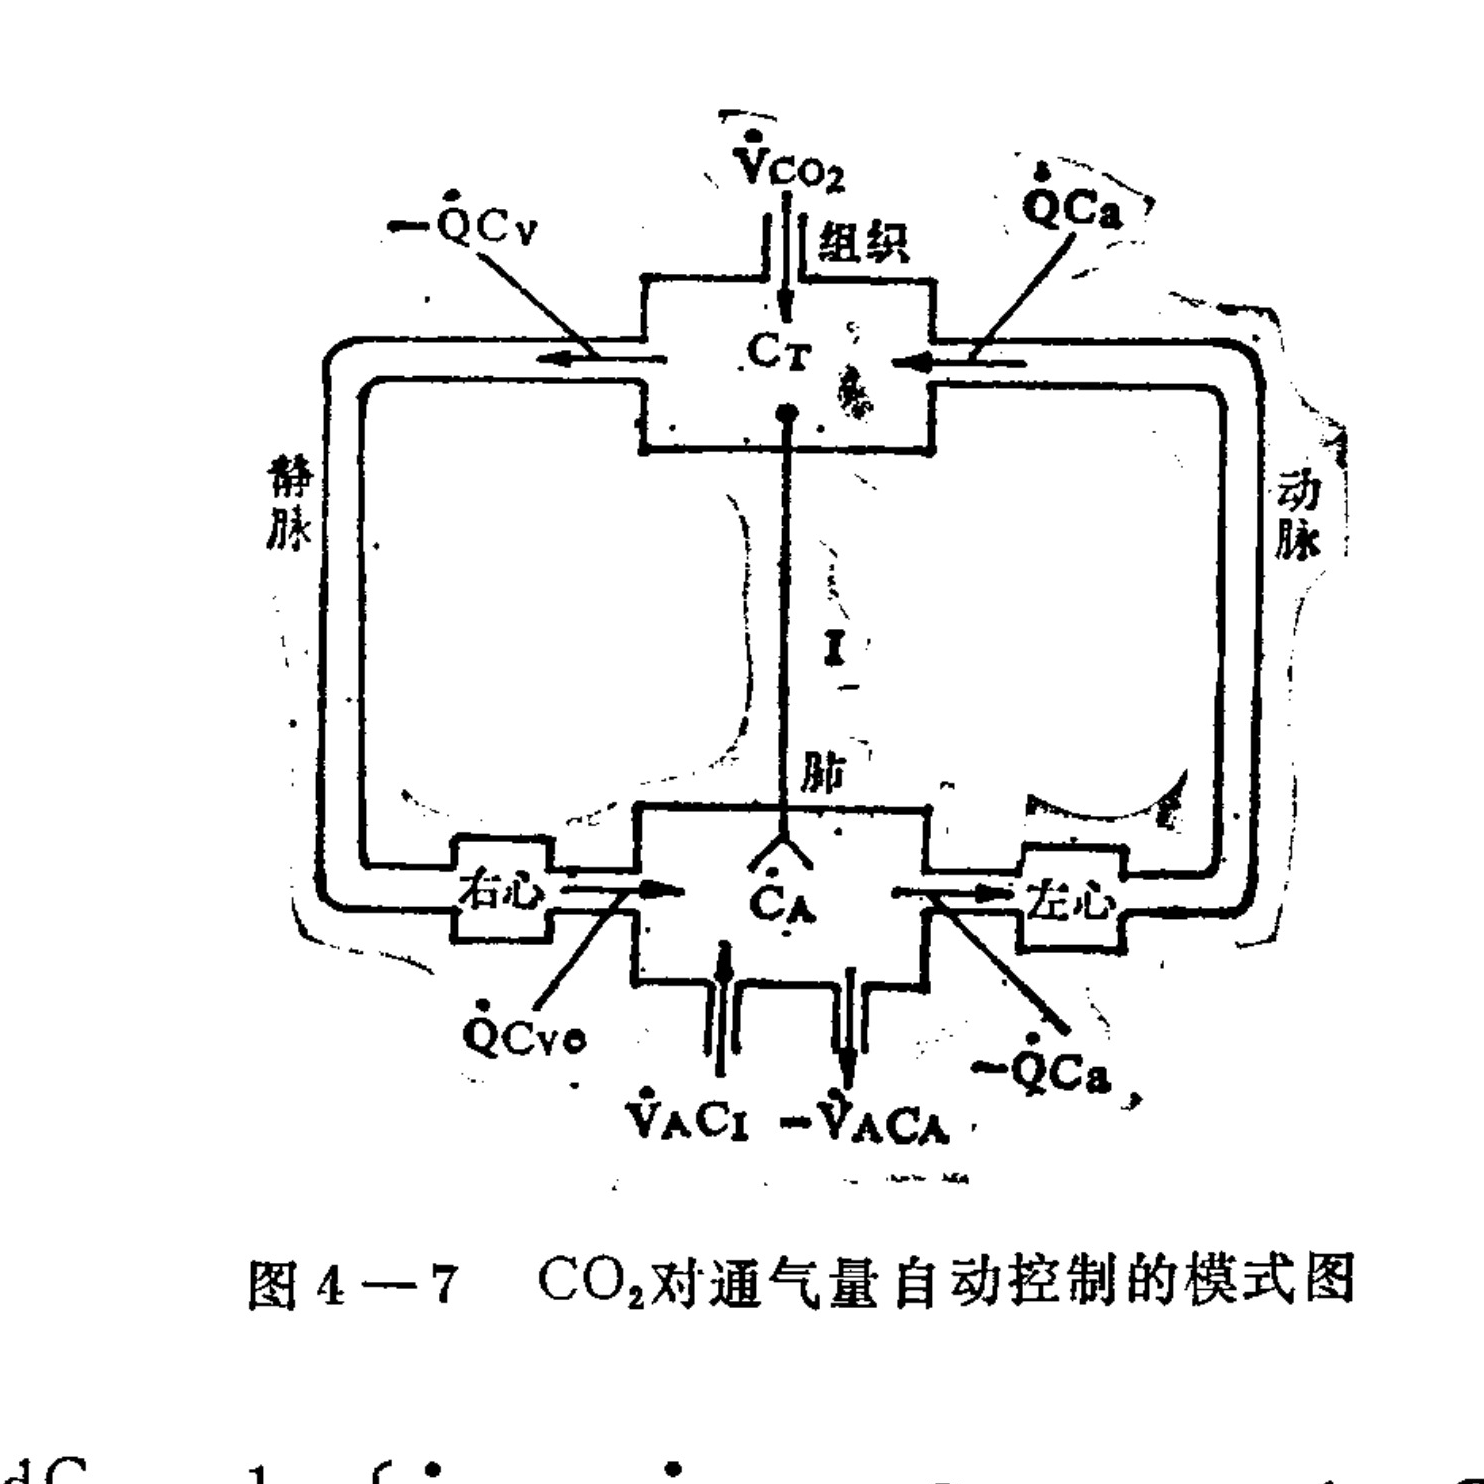
Figure 4-7 diagram labels: tissue; lung; vein; artery; right heart; left heart; C_T; C_A; V̇_CO₂; −Q̇C_v; Q̇C_a; Q̇C_v0 (lower-left subscript faint in the scan); −Q̇C_a; V̇_A C_I − V̇_A C_A.
Translated labels: Tissue; Lung; Vein; Artery; Right Heart; Left Heart
Figure 4-7. Schematic diagram of the automatic control of ventilation by CO₂
dC_T/dt = (1/V_T){V̇_CO₂ + Q̇[k′P_b·C_A·(t − t₁) + k₂ − C_T]}

dC_A/dt = (1/V_A){Q̇[C_T(t − t₂) − k₁P_b·C_A − k₂] + V̇_A(C_I − C_A)}

V̇ = aC_T − b

V̇_A = V̇ − (V̇/k₃)^(1/2)V_D    (4-10)
Here C_T, C_A, and C_I respectively denote the carbon-dioxide content in the tissues, in the alveoli, and in the inspired gas; V_T and V_A are the volumes of the tissues and alveoli; Q̇ is cardiac output; P_b is atmospheric pressure; k₁ and k₂ are dissociation constants; V̇_A is alveolar ventilation; V̇ is the ventilation controlled by the respiratory center; V̇_CO₂ is the rate of carbon-dioxide production caused by metabolism in the tissues; V_D is respiratory dead-space volume; and a, b, and k₃ are constants. Equation (4-10) is the dynamic mathematical model. Solving the above equations with an electronic computer gives the dynamic process of the respiratory variables when the relevant factors change. Figure 4-8 shows the computer-simulation result for the change in ventilation when a gas containing 5 percent carbon dioxide is inhaled and then suddenly removed. The continuous curve in the figure is the computer-simulation result; the small black dots are the average values actually recorded under the same conditions from six experimental subjects. It can be seen that the two are very close, indicating that this model can reflect the actual behavior of the respiratory system.
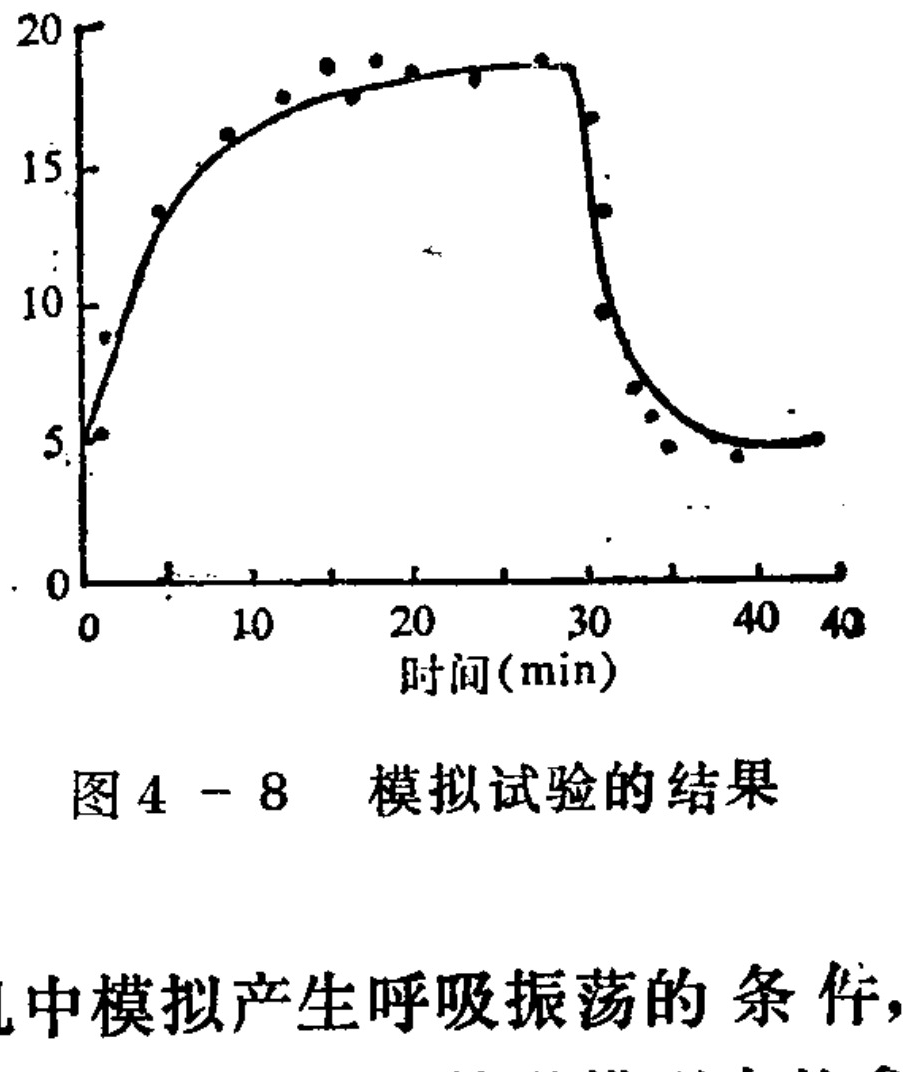
Figure 4-8. Results of the simulation test
Translated labels: Time (min)
Using the above model, respiratory oscillation—namely, the conditions for periodic breathing—can also be simulated on a computer. Because it is easy to change the parameters of the mathematical model in a computer, it can be found that G = ΔV̇/ΔC_T = a (that is, the sensitivity of the respiratory center to changes in carbon-dioxide partial pressure) and t₁ (arterial-circulation delay) have the greatest influence on the production of oscillations. Figure 4-9 shows the boundary line for the production of oscillations, using G and t₁ as coordinates. Outside the boundary line, the system tends toward producing oscillations. The figure also marks the normal operating point.
Under normal conditions, the system is far from the boundary; that is, normal people do not develop periodic breathing. Because the model makes many simplifying assumptions, it cannot provide accurate quantitative results, but it can lead to qualitative conclusions. For example, these results can explain why patients with heart disease are prone to developing periodic breathing.
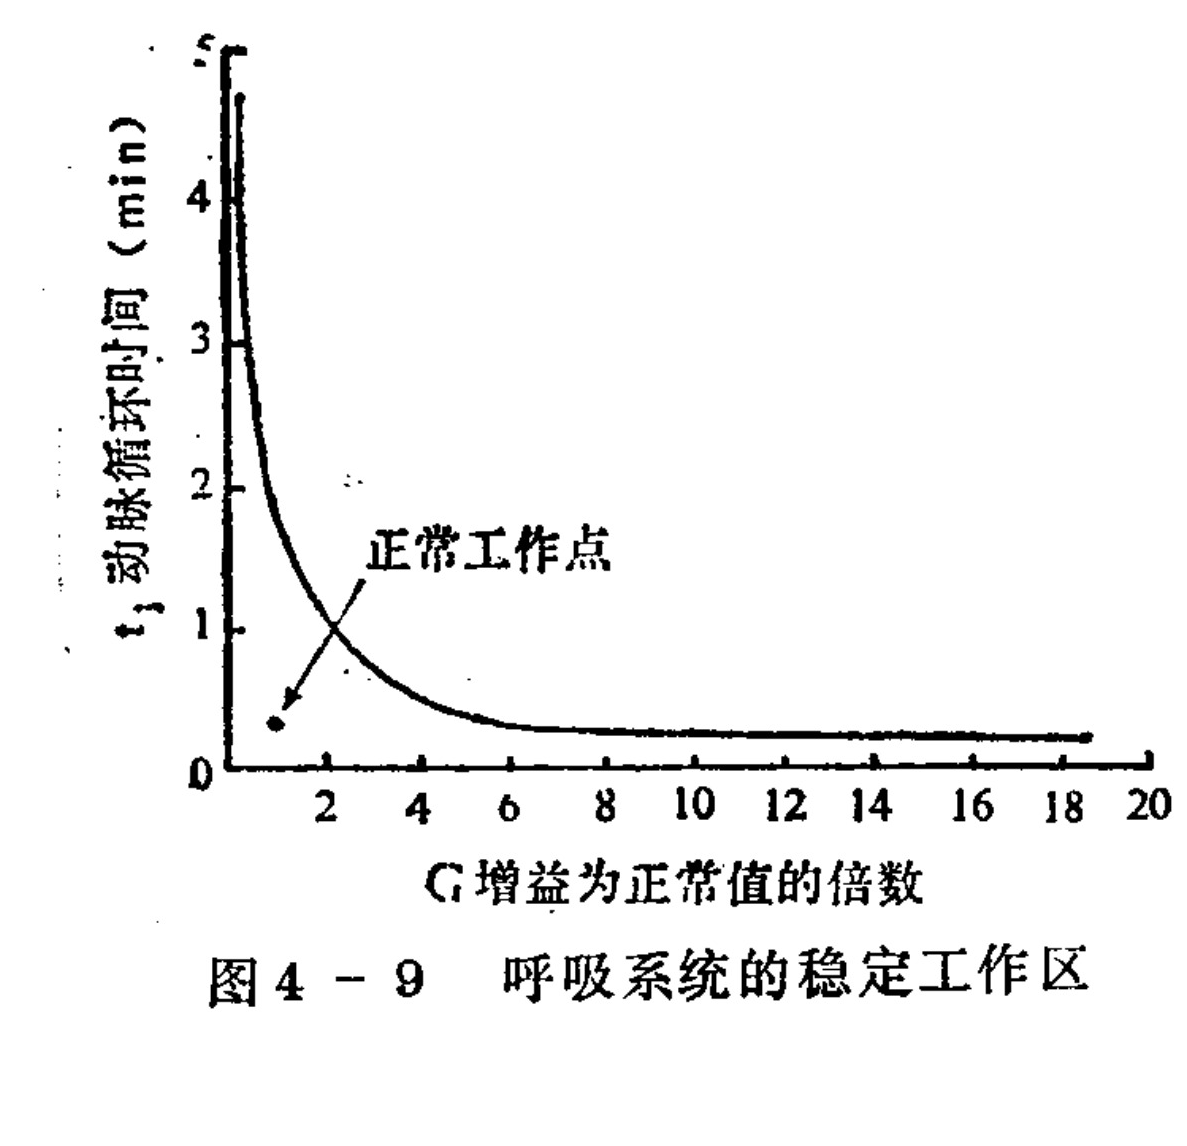
Figure 4-9. Stable working area of the respiratory system
Translated labels: t3 Arterial circulation time (min); G Gain as a multiple of normal value; Normal operating point
to Cheyne–Stokes breathing, because patients with heart disease often have left-ventricular hypertrophy, which increases the transmission-delay time t1; on the other hand, patients may also be sensitive to changes in the partial pressure of carbon dioxide in the blood, and therefore are prone to Cheyne–Stokes breathing. In addition, experiments with dogs have shown that artificially prolonging the time required for the animals’ blood to travel from the lungs to the brain also produces Cheyne–Stokes breathing. These facts show the significance of mathematical models.
3. Adaptive Control of the Respiratory System
Biological systems are the result of long-term evolution. Organizational structures unsuitable for the struggle for survival gradually degenerate, while more complete structures and modes of control develop. Biological systems therefore have a high capacity to adapt to their environment and are often operating at high efficiency. In other words, biological systems are adaptive control systems. Existing data show that the respiratory system can adapt to changing conditions and, while guaranteeing a certain ventilation volume, can minimize the energy consumed by respiratory movement; it is an adaptive optimal system. For example, human respiratory frequency varies under different conditions. Figure 4–10 shows theoretically calculated curves for the energy consumed by respiratory movement and respiratory frequency under different ventilation-volume requirements. The two curves correspond respectively to rest and physical exercise. Both are inverted parabolas, each with a point of minimum energy consumption; the respiratory frequency corresponding to that point is precisely the frequency actually observed at rest and during exercise. It can therefore be considered that
the respiratory system automatically regulates its respiratory frequency so that, while the ventilation requirement is guaranteed, the energy consumption of respiratory movement is minimized. As for how this adaptive control is achieved, it is not yet clear. Some reasonably grounded hypotheses have nevertheless been proposed. For example, the respiratory center may use the partial pressure of carbon dioxide in arterial blood during the respiratory cycle as a search signal and perform a self-optimization-point control of ventilation.
Others have started from the fact that the respiratory system is controlled by multiple levels of neural centers and have hypothesized that it has two control levels: the lower level controls changes in ventilation to meet oxygen-supply requirements; the higher level controls the durations of exhalation, inhalation, and pauses, as well as tidal volume (or frequency), so as to minimize energy consumption. The results calculated from the hypothetical theory are fairly close to experimental observations. These hypotheses still require further investigation and experimental verification.
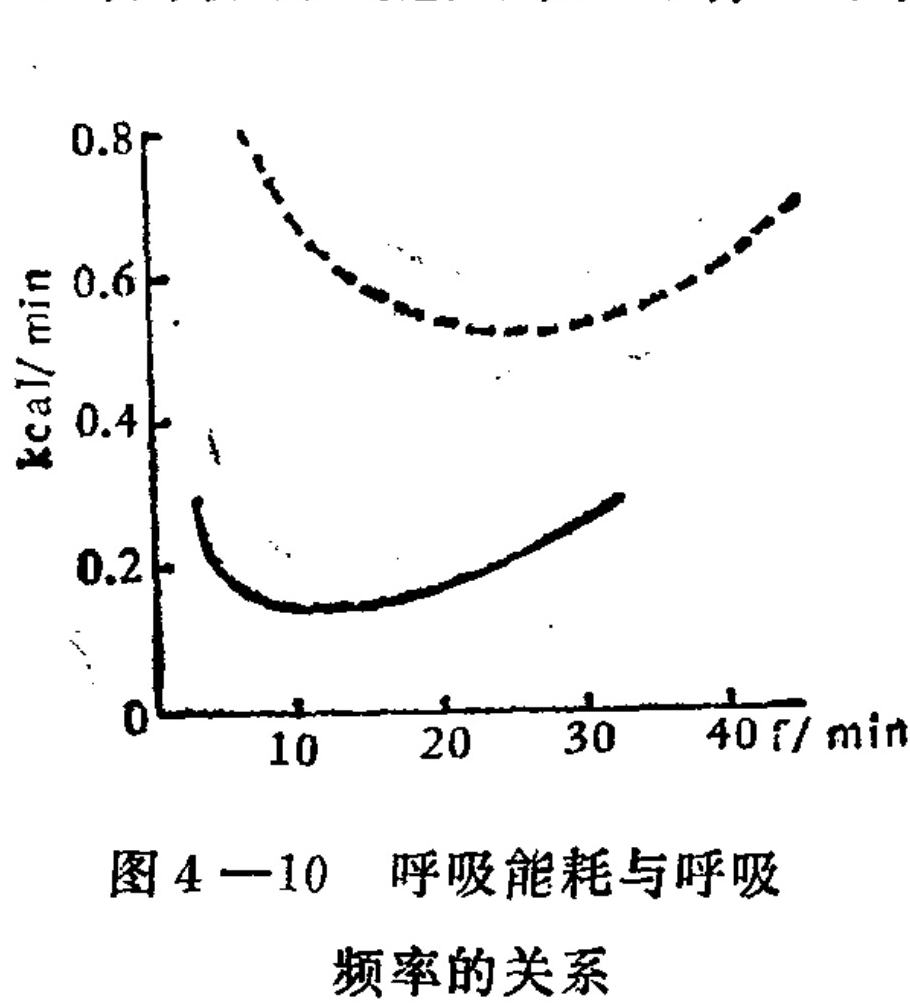
Figure 4–10 Relationship between respiratory energy expenditure and respiratory rate
Translated labels: kcal/min; f / min
Below we further introduce one of the hypotheses concerning adaptive respiratory control. Here it is assumed that the respiratory system is controlled by three subsystems: (1) chemical control, which ensures that, under the corresponding environmental conditions, the system’s ventilation volume is minimal; (2) muscle control, which minimizes the average energy consumption of the respiratory muscles; and (3) airway control, which minimizes the energy consumed during ventilation of the respiratory dead space.
The purpose of chemical control is to maintain ventilation at a minimum and ensure the highest ventilation efficiency of the respiratory system. Ventilation is controlled mainly by the partial pressures of carbon dioxide and oxygen in the blood and by ion concentration. The gas-exchange rate of hemoglobin is related to its degree of oxidation, while the oxygen saturation of hemoglobin is related to pH (ion concentration). The relationship between the gas-exchange rate and the partial pressure of carbon dioxide and pH in the blood can be represented by the surface in Figure 4–11. It can be seen that when the blood pH is 7.4 and the partial pressure of carbon dioxide, PCO₂, is 40 mmHg, the number of carbon-dioxide molecules that can be exchanged per oxygen molecule is at its maximum; that is, the gas-exchange rate is highest.
Under a given oxygen-supply requirement, if the system operates at the highest gas-exchange rate, the ventilation volume will be minimal. The surface also shows that, at the optimum exchange rate (the vertex), fluctuations in PCO₂ and pH caused by respiratory movement and disturbances are minimal. It is therefore hypothesized that minimum ventilation can be achieved by the control system shown in Figure 4–12. The chemoreceptors detect not only the mean values of PCO₂ and pH, but also send their fluctuation values to the neural controller. The controller keeps the chemical constituents of the blood in an optimal state, so that ven-
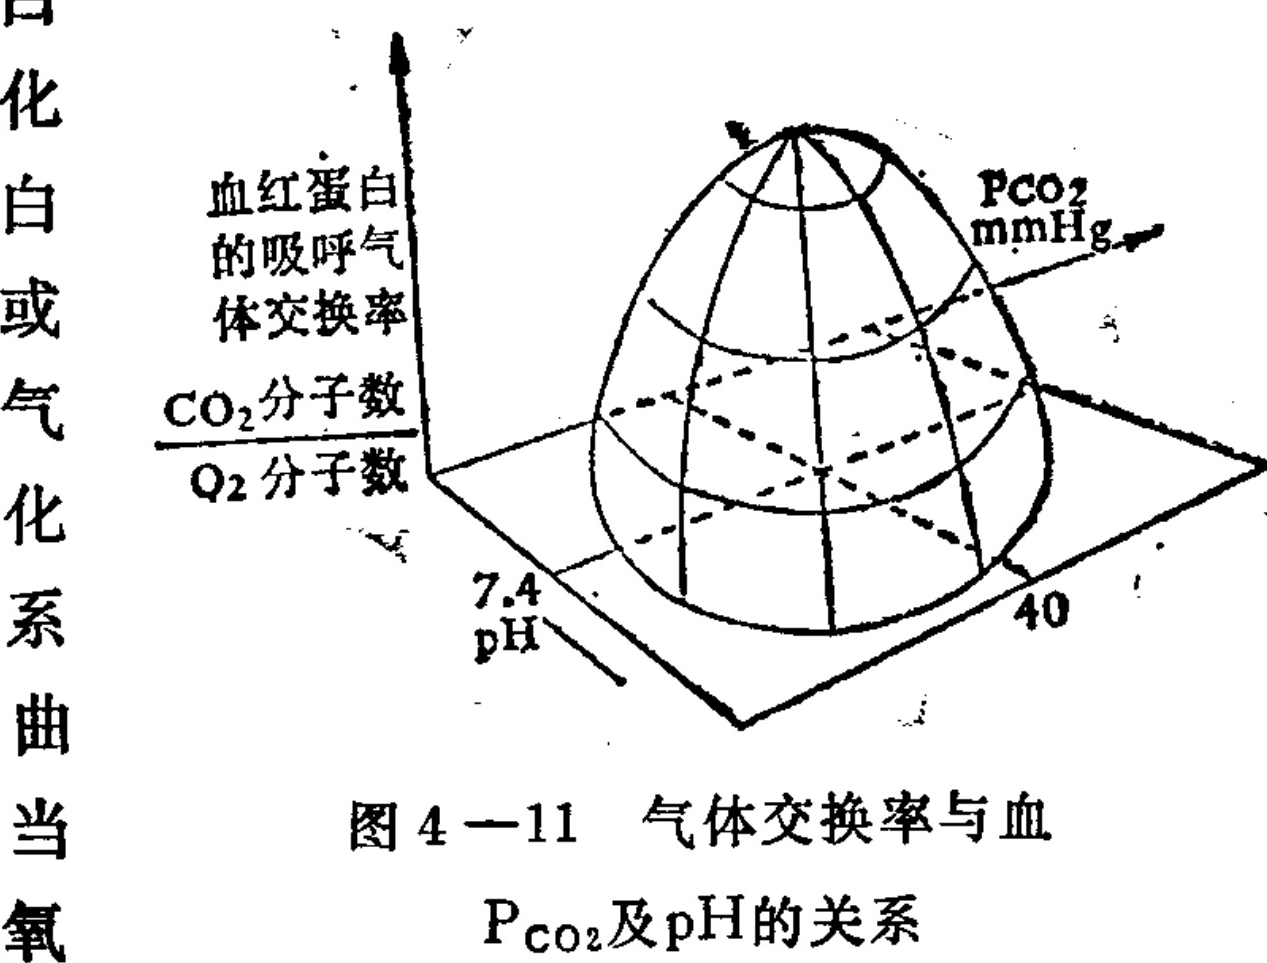
Figure 4–11: Relationship between gas-exchange rate and blood PCO₂ and pH.
Translated labels: PCO2 mmHg; pH; 40; 7.4; Ratio of CO2 molecules to O2 molecules; Hemoglobin’s respiratory gas exchange ratio
tilation is minimized, while the amplitudes of the PCO₂ and pH fluctuations caused by disturbances are also minimized. If the chemical composition of the blood is at the point of maximum gas-exchange rate, both requirements can be met simultaneously. Here it is hypothesized that the controller can use both the mean-value signal and the fluctuation signal to find automatically the operating point at which the fluctuation is smallest. The specific structure that performs this computation, and its anatomical location, are not yet clear.
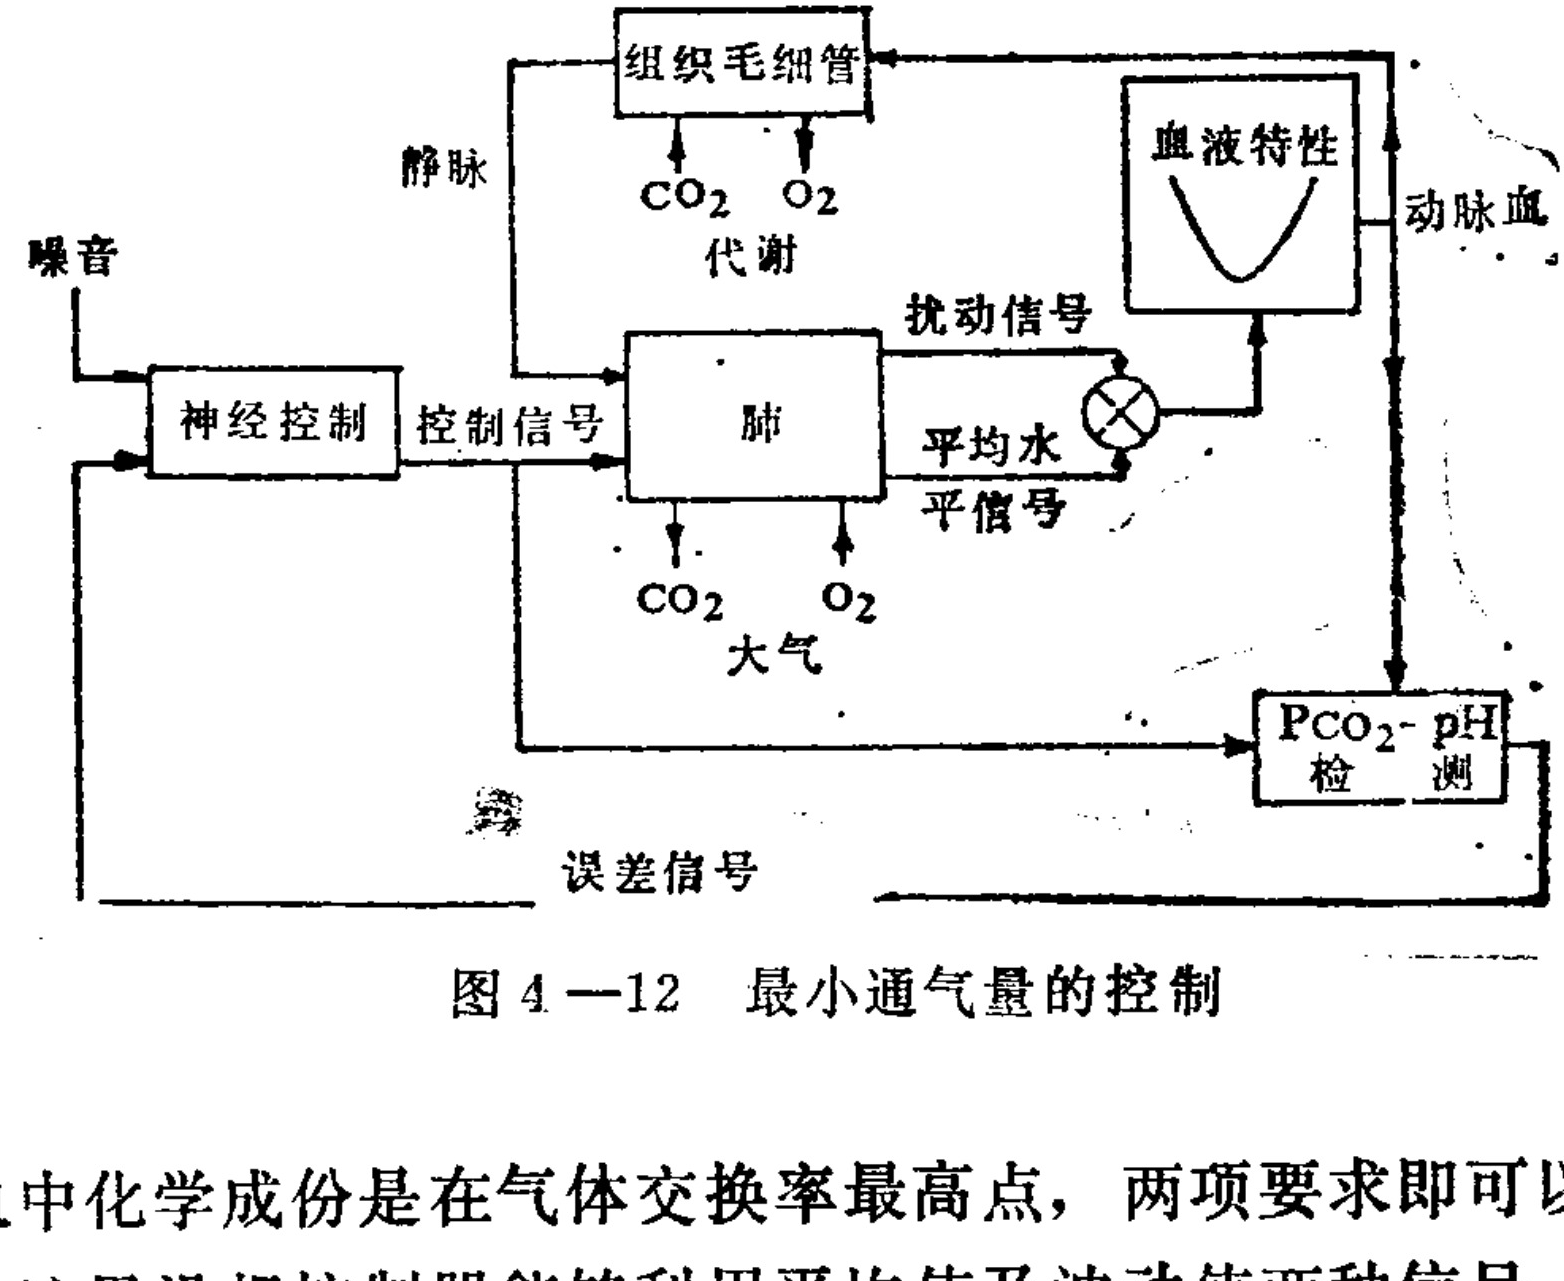
Figure 4–12 Control of minimum ventilation.
Translated labels: Tissue Capillaries; Metabolism; CO2; O2; Venous; Noise; Nervous Control; Control Signal; Lungs; Atmosphere; Disturbance Signal; Average Level Signal; Blood Characteristics; Arterial Blood; PCO2-pH Detection; Error Signal
The purpose of muscle control is to minimize the energy consumed when the respiratory muscles move. It is assumed here that energy consumption is minimized not only when the ventilation requirement changes (for example, when changing from rest to physical activity), but also when the posture and movement state of the limbs and trunk change, because the respiratory muscles are related to the state of the limbs and trunk. When the ventilation requireWe further hypothesize that the respiratory center can issue commands that produce the optimal distribution of muscle activity. In other words, the neurons of the respiratory center also have a corresponding activity distribution
This optimal distribution of neuronal activity can produce the optimal distribution of respiratory-muscle activity under normal conditions.cles, and excitation contour lines.]
Airway control is achieved through changes in the diameter of the airway. When the airway diameter is at its optimum, the energy required for gas to overcome airway resistance during respiration is minimal. Regulation of airway diameter can be achieved with the help of airway smooth muscle and feedback from receptors in the airway wall. At the same time, coordination with the chemical-control and muscle-control processes is also required.
Clearly, the three control processes described above are not independent of one another. Under the integrated control of the respiratory center, they cooperate and coordinate so that the respiratory system can automatically adapt to new changes in a continually changing environment, meet the ventilation requirement, and minimize total energy consumption. Having described the three subsystems separately, we can now discuss the overall adaptive control of the respiratory system in greater detail. The overall function of the respiratory system is realized by a multilevel hierarchical controller; the structure of this overall control is shown in Figure 4–14.
The multilevel controller is divided into three levels. At the highest level is the main controller, whose principal function is to predict the total energy consumption that will be required by the next breath. The prediction is made by using the preceding one or several
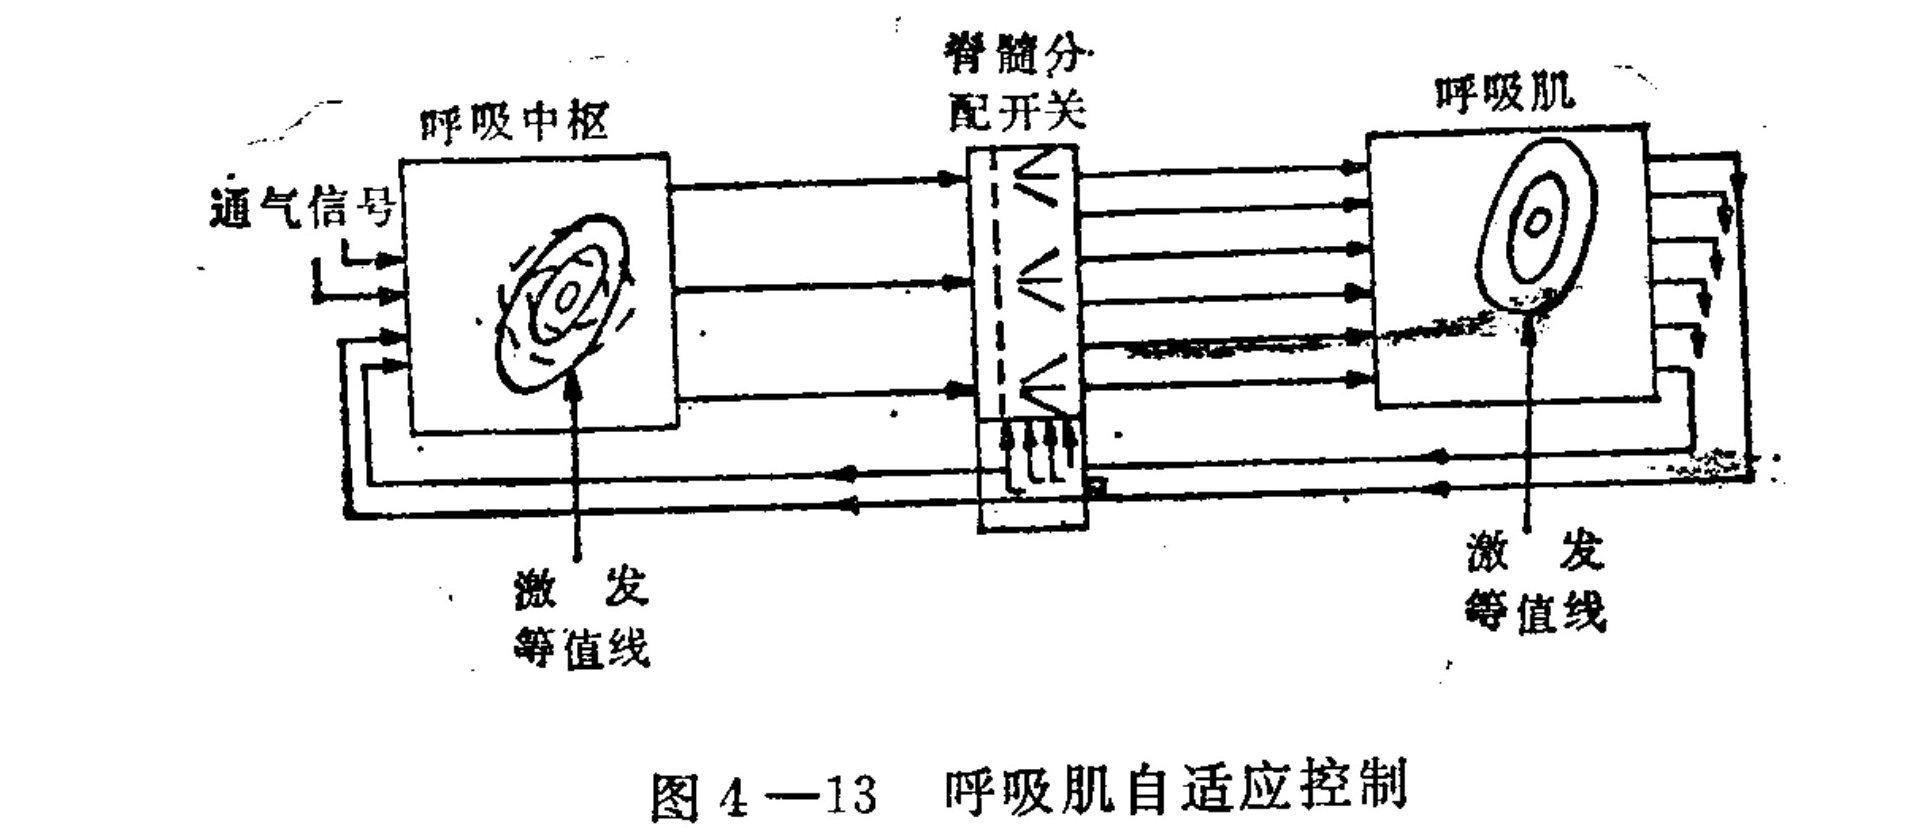
Figure 4-13 Adaptive control of respiratory muscles.
Translated labels: Respiratory Center; Spinal Distribution Switch; Respiratory Muscle; Ventilation Signal; Excitation Isocline
The information on energy changes during the next breath and changes in the working point of the blood components, among other conditions, is obtained through comparative analysis. The intermediate level is the intermediate controller. It receives feedback signals from the respiratory muscles and trachea and, based on the predictive commands of the master controller, makes a detailed temporal allocation of total energy expenditure and an initial spatial allocation—that is, it determines the optimal distribution of central-neuron activity. Low-level control is carried out mainly in the spinal cord; it completes the precise spatial allocation of muscle-activity control. If, for any reason, the working point of the respiratory control system shifts, the chemoreceptors transmit the deviation signal to the controller, where analysis and estimation can
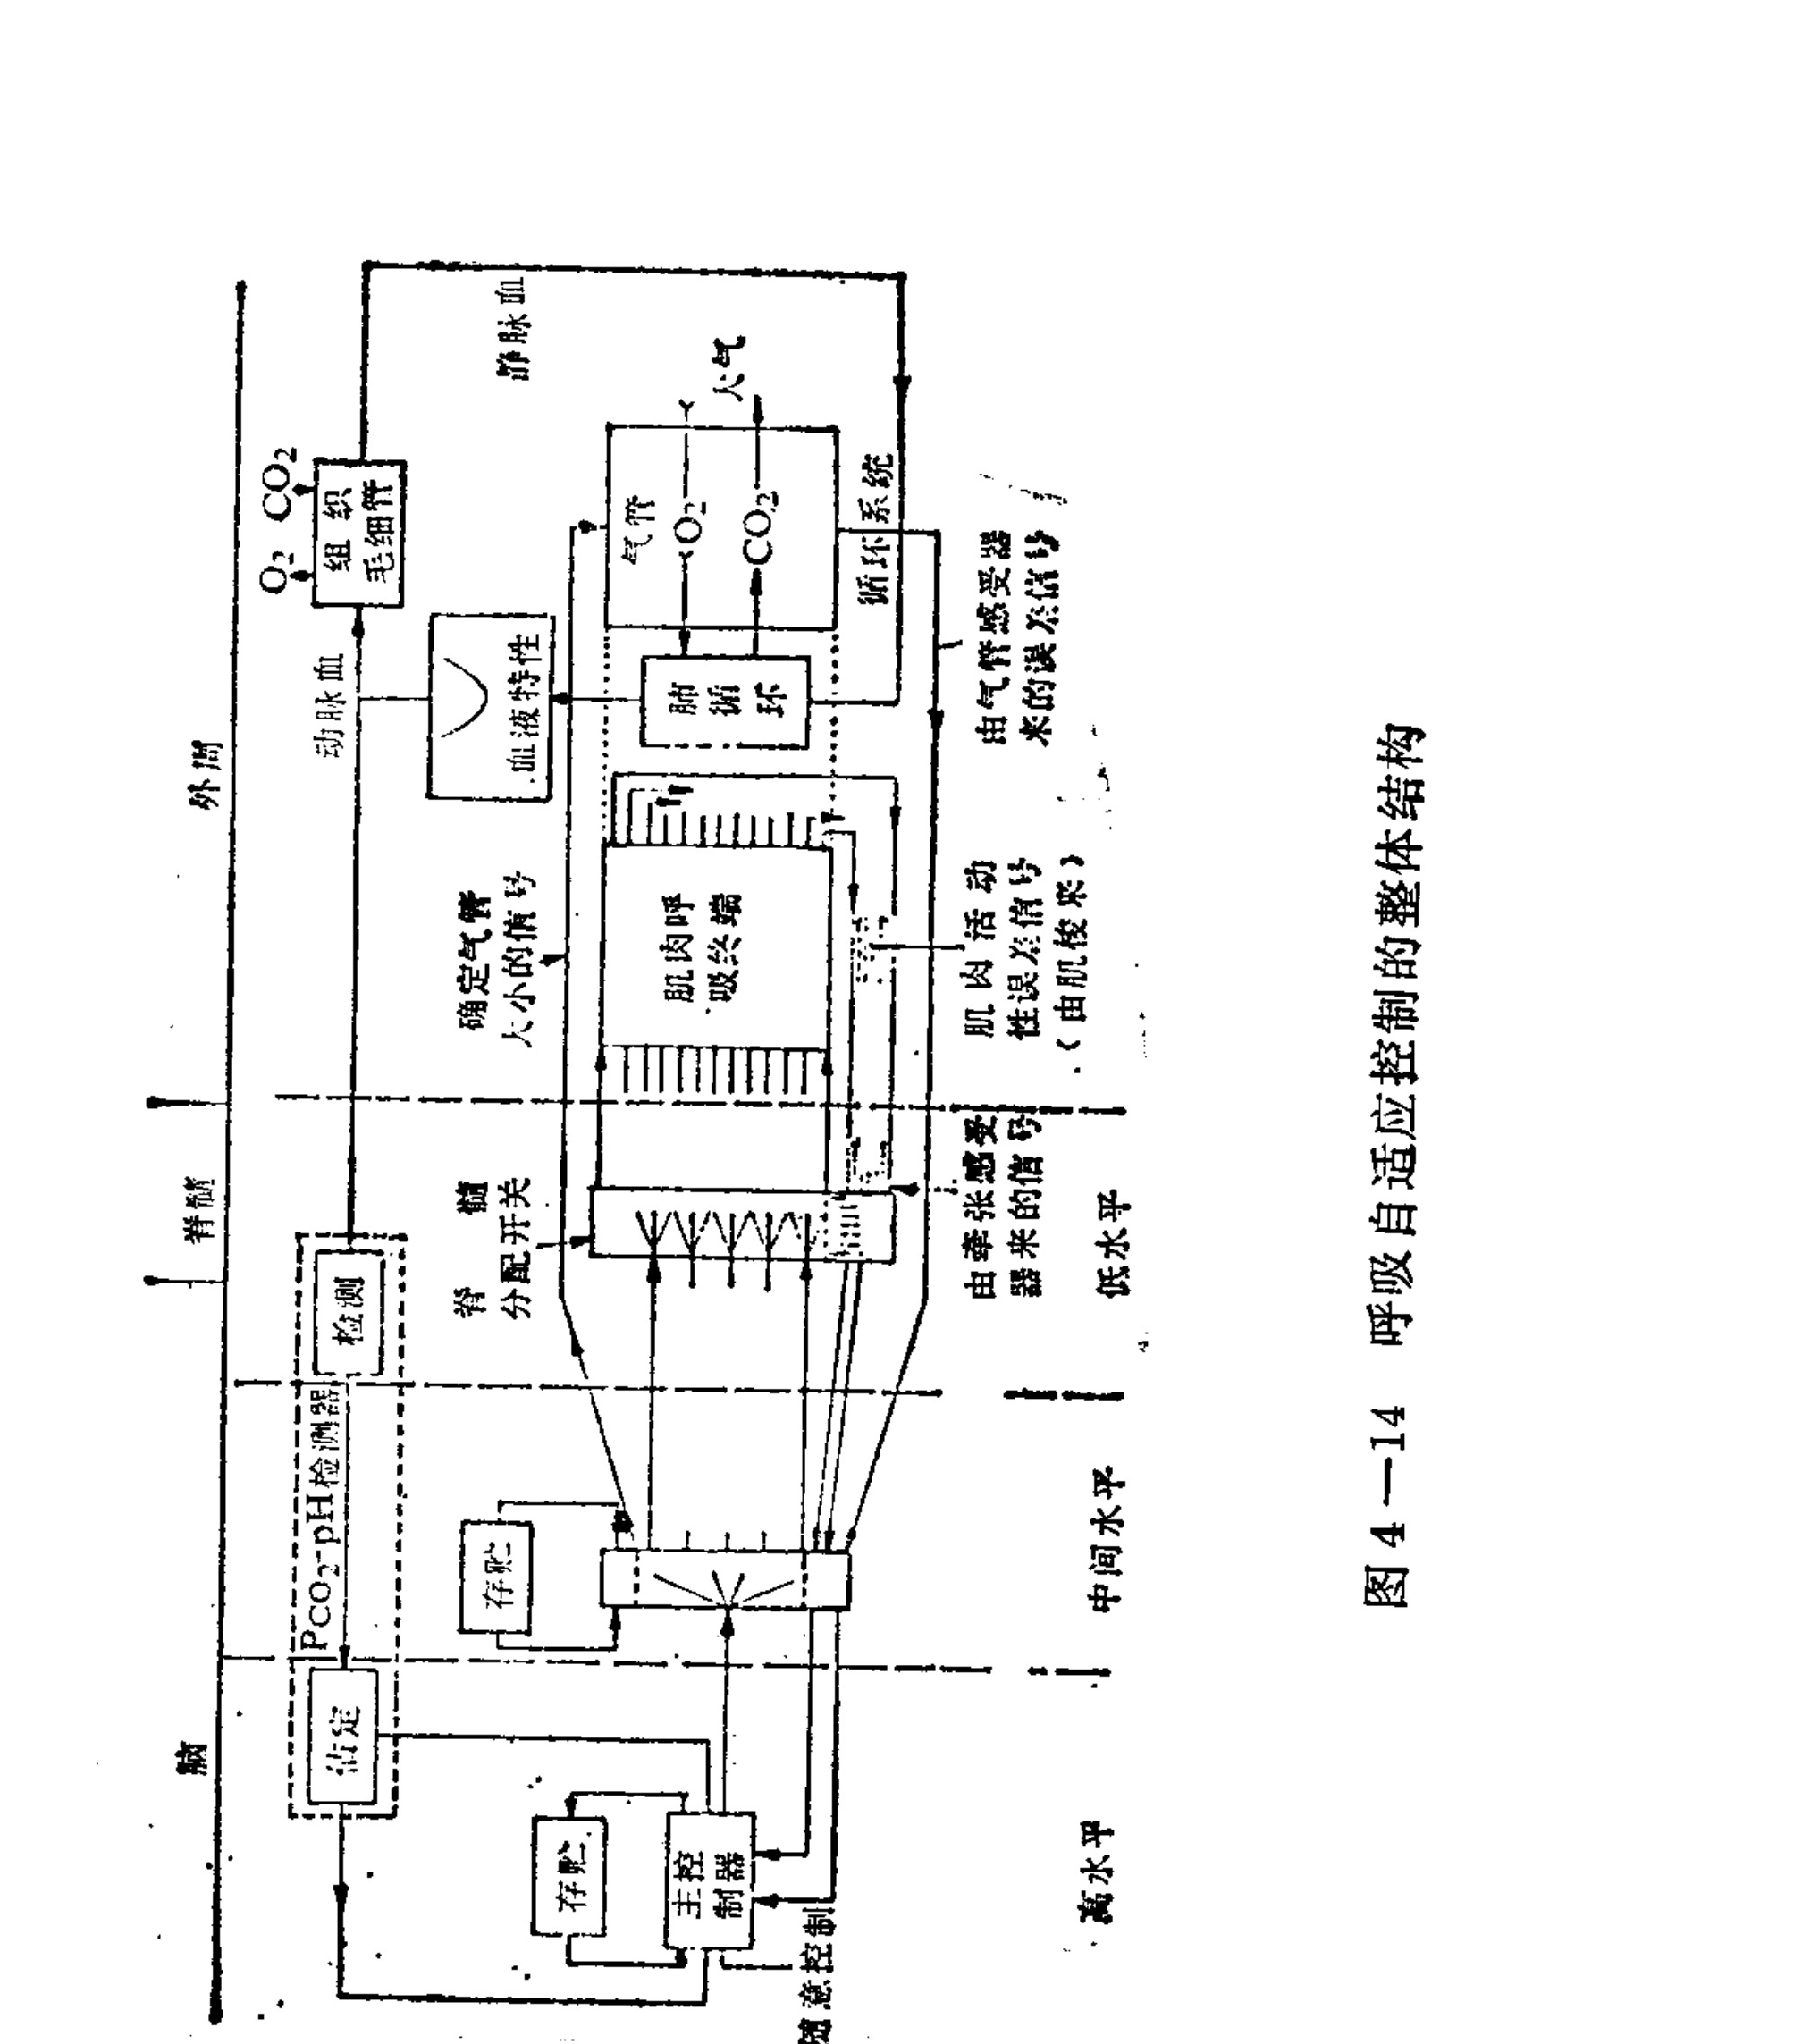
Figure 4-14. Overall structure of respiratory adaptive control
Translated labels: Brain; Spinal cord; External environment; Main controller; Storage; PCO2-pH detector; Detection; Arterial blood; Venous blood; Tissue capillaries; Blood characteristics; Spinal distribution switch; Muscle receptor signal; Diaphragm muscle end; Lung circulation; Trachea; Circulatory system
determine the magnitude and direction of the blood components’ deviation from their optimal points. This information is sent to the master controller. The master controller issues a command to change the ventilation requirement, estimates the new energy expenditure, and, through the intermediate and low-level controllers, correspondingly changes the state of the respiratory muscles and trachea. By controlling tidal volume and the duration of respiration, the system is restored to its optimal working state. At the same time, feedback signals from receptors in the respiratory muscles, trachea, and other structures are sent back to the controllers at all levels. The control commands are modified according to the specific execution results until the optimal working point is restored. This overall control concept is largely conjectural and still needs to be improved and verified through experimental observation.
IV. Changes in the Respiratory System during the Qigong State
Consciously controlling respiratory movements is one of the important means of attaining the qigong state. In the qigong state, the respiratory system undergoes relatively marked changes. These changes can in turn cause changes in other physiological processes in the body, placing the organism in a physiological state favorable to qigong. Some observations have now been made of the respiratory system before and after qigong practice. Generally, the volume of inhaled air and the oxygen and carbon-dioxide concentrations in exhaled gas are measured, while pulmonary ventilation and respiratory frequency are recorded. From these, oxygen consumption and carbon-dioxide output can be obtained, and the respiratory quotient, energy expenditure per minute, and the body’s metabolic rate can be calculated.
During qigong practice, the most obvious change is a slowing of respiration, generally decreasing to about 3–4 breaths per minute. During practice, practitioners can maintain this slowed breathing for a long time without discomfort. The Physiology Teaching and Research Group of Shanghai Medical University observed the respiration of young students before and after qigong training. The average respiratory frequency fell from 16.5 breaths per minute before practice to an average of 6.9 breaths per minute; 40% of the subjects could reduce it to fewer than 5 breaths per minute. Average tidal volume increased by 7.8%, while average minute ventilation decreased by 26%. After practice stopped, respiratory frequency first returned to its pre-practice level. Pulmonary ventilation recovered more slowly: 15–20 minutes after practice stopped, it was still 9% below the pre-practice average. In five practitioners who were relatively proficient, in addition to observing a marked reduction in oxygen consumption and carbon-dioxide output during practice, the concentration of alveolar gas was also measured, showing that the oxygen content of alveolar gas increased by 1%, while carbon dioxide decreased by 0.4%. At the same time, blood-lactate content was measured, and no marked change was observed. This shows that although breathing slows and ventilation decreases during practice, the body does not suffer from insufficient ventilation or intensified anaerobic metabolism. It indicates that, even with reduced ventilation, the respiratory system continues to meet the metabolic needs of the body at that time.
In addition to directly affecting the respiratory system, qigong practice also changes metabolic processes in the body through changes in respiration. During qigong practice, reduced oxygen consumption and carbon-dioxide output indicate that metabolic processes in the body have also slowed. The metabolic rate during practice was, on average, 19–21% lower than before practice. Some practitioners continued to show a further decrease for a period after stopping practice. Most practitioners began gradually recovering immediately after stopping, but 15–20 minutes after practice stopped, they still had not returned to their pre-practice level. Controlled experiments ruled out changes that might have been caused by experimental conditions (such as wearing a mask) and demonstrated that the reduction in metabolic rate during practice was indeed caused by the practice itself.
For subjects who did not know how to practice qigong, consciously reducing respiratory frequency could also markedly reduce pulmonary ventilation, but experimental observations showed that their metabolic rate did not decrease. Although slowing breathing reduces the energy expenditure generated by respiratory movements, when people who cannot practice qigong consciously slow their breathing, this may be accompanied by a certain degree of mental and muscular tension, thereby increasing energy expenditure. Therefore, consciously slowing respiration cannot immediately reduce the body’s total energy expenditure. Thus, the main reason total energy expenditure decreases during qigong practice is not the change in respiratory movements. The metabolic rate during practice is generally lower than the basal metabolic rate and also lower than the metabolic rate reported in the literature for deep sleep. These findings show that qigong practice differs from ordinary quiet rest: it results from coordinating regulated breathing with calmness and relaxation, thereby greatly reducing the body’s metabolic processes.
Foreign researchers have also observed the respiratory system before and after practicing TM (transcendental meditation, a type of yoga practice), obtaining similar results. In the qigong state, respiratory frequency is markedly reduced and ventilation also decreases. Respiratory frequency decreases by approximately 4–5 breaths per minute, and ventilation decreases by approximately 1 liter per minute. It recovers quickly after practice stops. Changes in respiratory frequency during practice are shown in Figure 4-15. Oxygen consumption and carbon-dioxide output also change markedly before, during, and after practice, as shown in Figure 4-16. After practice begins, oxygen consumption and carbon-dioxide output decrease significantly; compared with before practice, oxygen consumption
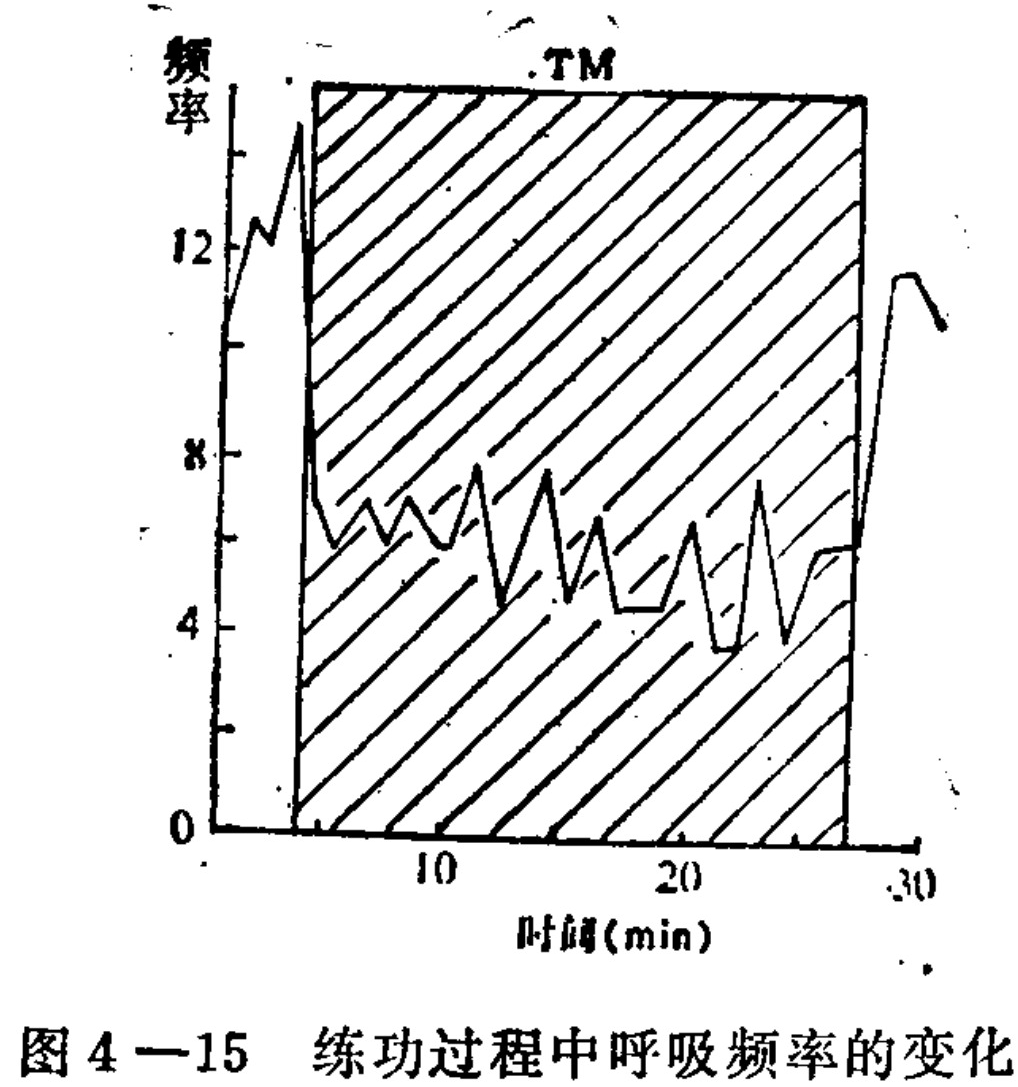
Figure 4-15. Changes in respiratory frequency during qigong practice
Translated labels: Frequency; Time (min); TM
Chart labels: before practice; during practice; after practice. Vertical axis: respiratory frequency (per minute). Horizontal axis: time (minutes).
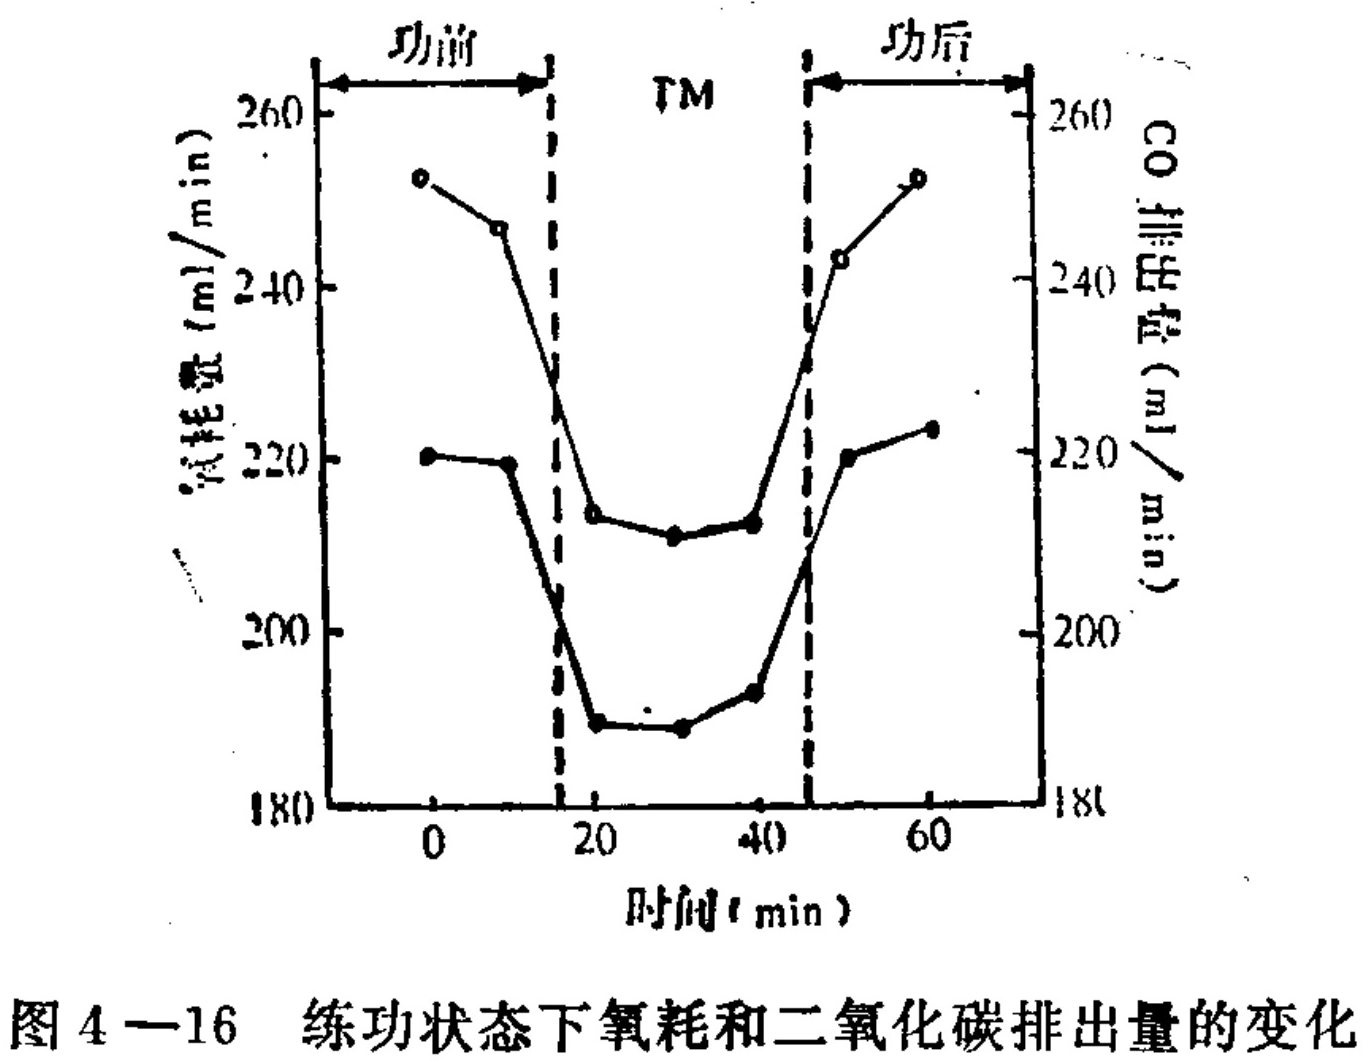
Figure 4-16. Changes in oxygen consumption and carbon-dioxide output in the qigong state
Translated labels: Before Practice; After Practice; Oxygen consumption (ml/min); CO2 output (ml/min); Time (min)
Oxygen consumption decreases by 16%, and carbon-dioxide output decreases by approximately 14.6%. The comparative results for changes in oxygen consumption in the qigong state, sleep state, and hypnotic state are shown in Figure 4-17. Oxygen consumption in the qigong state is 10% lower than in the sleep state.
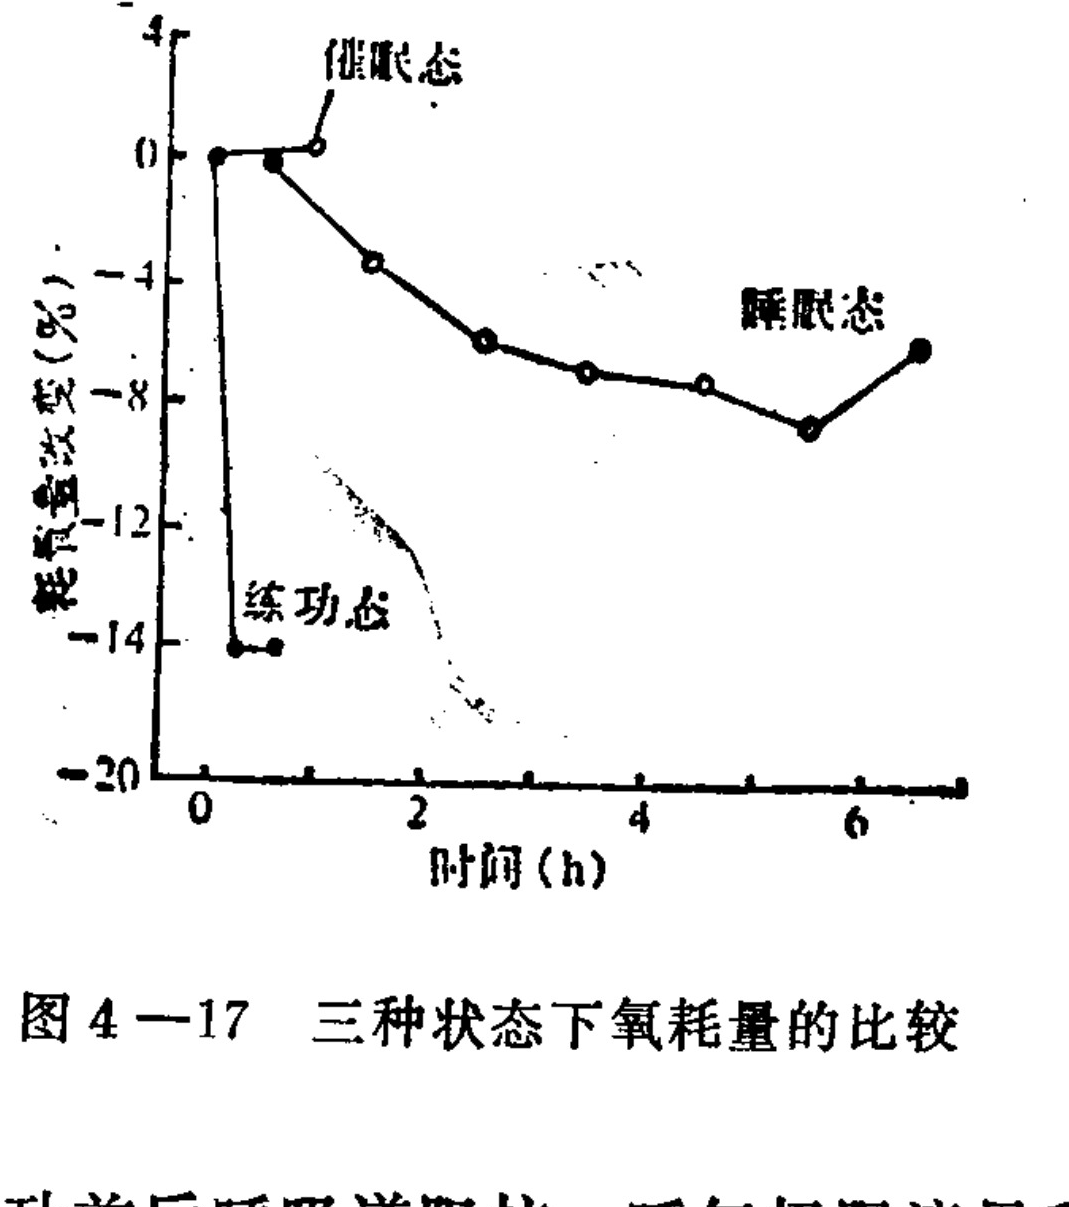
Figure 4-17: Comparison of oxygen consumption under three conditions. Graph labels: Oxygen consumption change (%) on the vertical axis, time (h) on the horizontal axis, with values 4, 0, -4, -8, -12, -14, -20 at 0, 2, 4, 6 hours.
Translated labels: Oxygen consumption change (%); Time (h); Hypnotic state; Sleep state; Meditation state
Foreign researchers also observed parameters related to respiratory-system function, including airway resistance before and after qigong practice, expiratory peak flow, and nitrogen exhaled during deep breathing. The changes in airway conductance—the reciprocal of resistance—are shown in Figure 4-18. It can be seen that there was a clear difference between the practice group and the control group: conductance increased in the former, while it remained basically unchanged in the latter.
Under tFor patients with stubborn bronchial asthma, forced expiratory volume (Vp), expiratory peak flow (Oa), and airway resistance were measured before practice and three months after practice. The results showed that during qigong
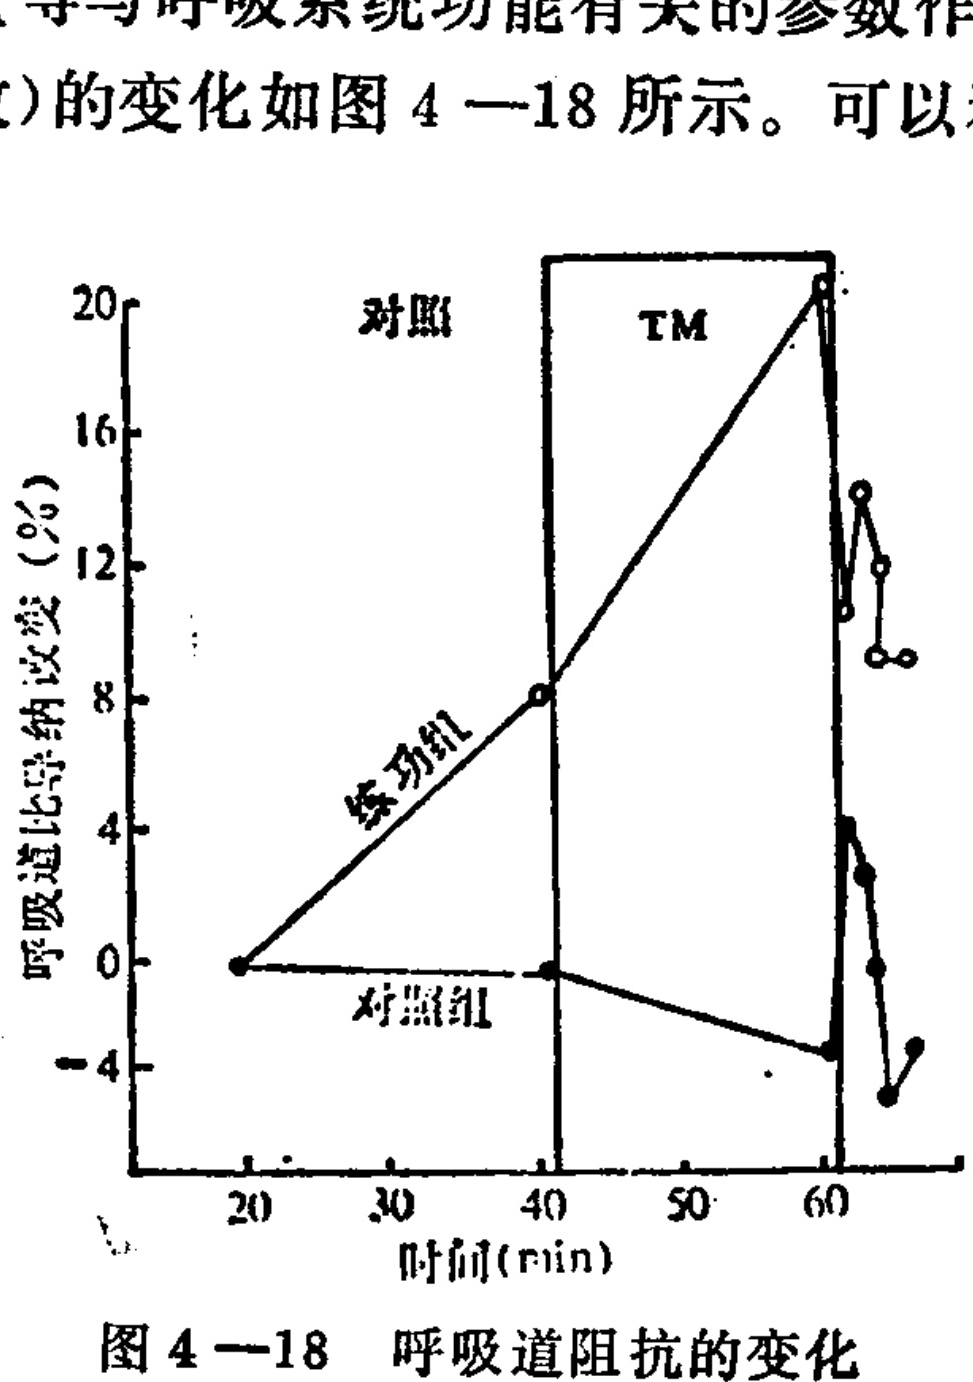
Figure 4-18. Changes in respiratory tract impedance over time.
Translated labels: Respiratory tract impedance change (%); Time (min); Control group; Training group; TM
practice, airway resistance fell significantly, while peak flow and deep-expiratory volume increased. This indicates that qigong practice can improve respiratory-system function.
The researchers randomly selected two groups of athletes: the control group received routine training, while the other group practiced qigong.y impulses from the cervical sympathetic nerve; with each exhalation, the phrenic nerve stops issuing impulses, and the sympathetic nerve likewise stops issuing impulses. This suggests that the inspiratory center may strengthen excitation of the sympathetic-nerve center.
Anatomically, moreover, the sympathetic-nerve center in the medulla is located very close to the neurons of the respiratory center, as well as to the neurons in the reticular formation of the brainstem that influence skeletal-muscle tone. Thus, functional interactions may also exist among them. Consequently, consciously slowing the breathing rate and relaxing skeletal-muscle tension may also inhibit the excitability of the sympathetic center, thereby possibly producing responses such as lowering arterial pressure and increasing gastrointestinal peristalsis, and achieving the therapeutic effects of qigong.
Because observations of respiration during the qigong state are still relatively preliminary, the available data remain insufficient to integrate with the respiratory-system control-theory model described in the preceding section. Nevertheless, the reduction in airway resistance and the decrease in the energy consumed by breathing indicate that the various control levels and subsystems of the respiratory system’s adaptive-control model may all undergo changes. At the very least, the airway-control subsystem shows clear improvement. Qigong may enable the human adaptive-control system to reach a higher-efficiency state.
Chapter Five: The Circulatory System and Qigong
The blood-circulatory system (cardiovascular system) is an important functional system of the human body. The function of blood circulation is to transport substances within the organism. During their life activities, the organism’s tissues and various cells continuously carry out metabolism. Therefore, the substances required for metabolism must also be transported continuously. Because the cardiovascular system bears a heavy workload, it is easily damaged. The quality of the circulatory system’s regulatory and control functions is an important factor determining whether the organism is healthy.
The “qi” of traditional Chinese medicine and qigong has broad meaning: it includes substances circulating within the body, as well as the functions of the various organs. Therefore, qigong exercise actually includes training the functions of the circulatory system. The cardiovascular system is crucial to human survival, and people have paid increasing attention to studying circulatory-system function and its control and regulatory processes. Numerous models of cardiovascular regulation and control have already been established. In this chapter, we will discuss the circulatory system’s principal functions, cardiovascular regulation and control, mathematical models of cardiovascular regulation and control, and the effects of qigong on the circulatory system.
I. The Principal Functions of the Circulatory System
The cardiovascular system is composed mainly of the heart and blood vessels. The heart is a propulsive organ, like a pump, driving blood through the entire body, while the blood vessels are the channels through which blood flows. The blood vessels include arteries, capillaries, and veins, forming a closed channel system. The principal function of blood circulation is to ensure the exchange and transport of substances within the organism and among its various parts. Oxygen and nutrients required for cellular metabolism are transported through the blood. Blood vessels are also important information channels: various hormones reach their target cells through the circulation. In addition, lymphocytes, antibodies, and other immune substances are distributed throughout the body through the circulation; therefore, the circulatory system also includes the lymphatic system. Thus, the circulatory system is of extremely vital importance to human survival. To ensure the supply of substances and energy and the transmission of information under different conditions, the heart and blood vessels are subject to well-developed systemic control. The human heart works without interruption throughout life, pumping approximately 2.6 million liters of blood each year; it can be said to be the most heavily burdened organ in the human body.
Blood circulation is divided into the systemic circulation (the greater circulation) and the pulmonary circulation (the lesser circulation). In systemic circulation, blood is ejected from the left ventricle and passes through the aorta and its branches to the arterioles, then through the capillaries of the various tissues, afterward through the venules to the large veins, collecting in the superior vena cava, inferior vena cava, and coronary sinus, and finally returning to the right atrium. During this circulation, oxygen and nutrients are delivered to all the tissues of the body, while carbon dioxide and metabolic products produced by the tissues during metabolism are transported to the lungs and various excretory organs for elimination from the body. Thus, during systemic circulation, blood changes from arterial blood containing relatively more oxygen to venous blood containing relatively less oxygen.
In pulmonary circulation, blood is ejected from the right ventricle and passes through the pulmonary artery and its branches, then through the capillaries in the alveolar walls, and finally returns through the pulmonary veins to the left atrium. During this process, carbon dioxide in the blood is expelled from the body through the alveoli, while fresh oxygen enters the blood through the alveoli, changing venous blood back into arterial blood. Blood then flows from the left atrium to the left ventricle, forming a closed system. The structure of the entire circulatory system is shown in Figure 5-1.
To propel the circulation of blood, the heart contracts periodically. The heart’s specialized conducting tissue contains autorhythmic cells that can become excited automatically and rhythmically through their own intrinsic changes. The highest center of this rhythm is the sinoatrial node. Under normal conditions, the sinoatrial node rhythmically generates excitation and conducts it outward, successively exciting the atria, the atrioventricular junction, the atrioventricular bundle and its branches, the Purkinje fibers, and the ventricles, thereby causing excitation and contraction of the entire heart. Therefore, the sinoatrial node is the normal site of origin of cardiac excitation and beating, and is called the normal pacemaker. The cardiac rhythm generated by it is called sinus rhythm.
Rhythmic excitation of the cardiac muscle causes the heart to beat rhythmically—that is, the heart operates according to a definite rhythm. When the heart contracts, blood is ejected from the left ventricle into the aorta. When the heart relaxes, the heart valves allow blood to flow in only one direction; blood cannot flow back into the left ventricle, but instead flows toward the various branching arteries. Cardiac rhythm can vary for various reasons; this is called arrhythmia. Causes of arrhythmia include abnormalities of automaticity and abnormalities of conduction. In normal adults, the heart is estimated to beat 75 times per minute. One heartbeat lasts an average of 0.8 seconds, of which the atrial contraction period
Superior vena cava
Pulmonary artery
Thoracic duct
Right atrium
Inferior vena cava
Right ventricle
Hepatic vein
Capillaries of the liver
Portal vein
Capillary network of the upper body
Capillary network of the lungs
Arteries of the upper body
Aortic arch
Pulmonary vein
Left atrium
Left ventricle
Descending aorta
Common hepatic artery
Gastric artery
Splenic artery
Intestinal artery
Anastomosis between the vena-cava system and the portal-vein system
Capillary network of the lower body
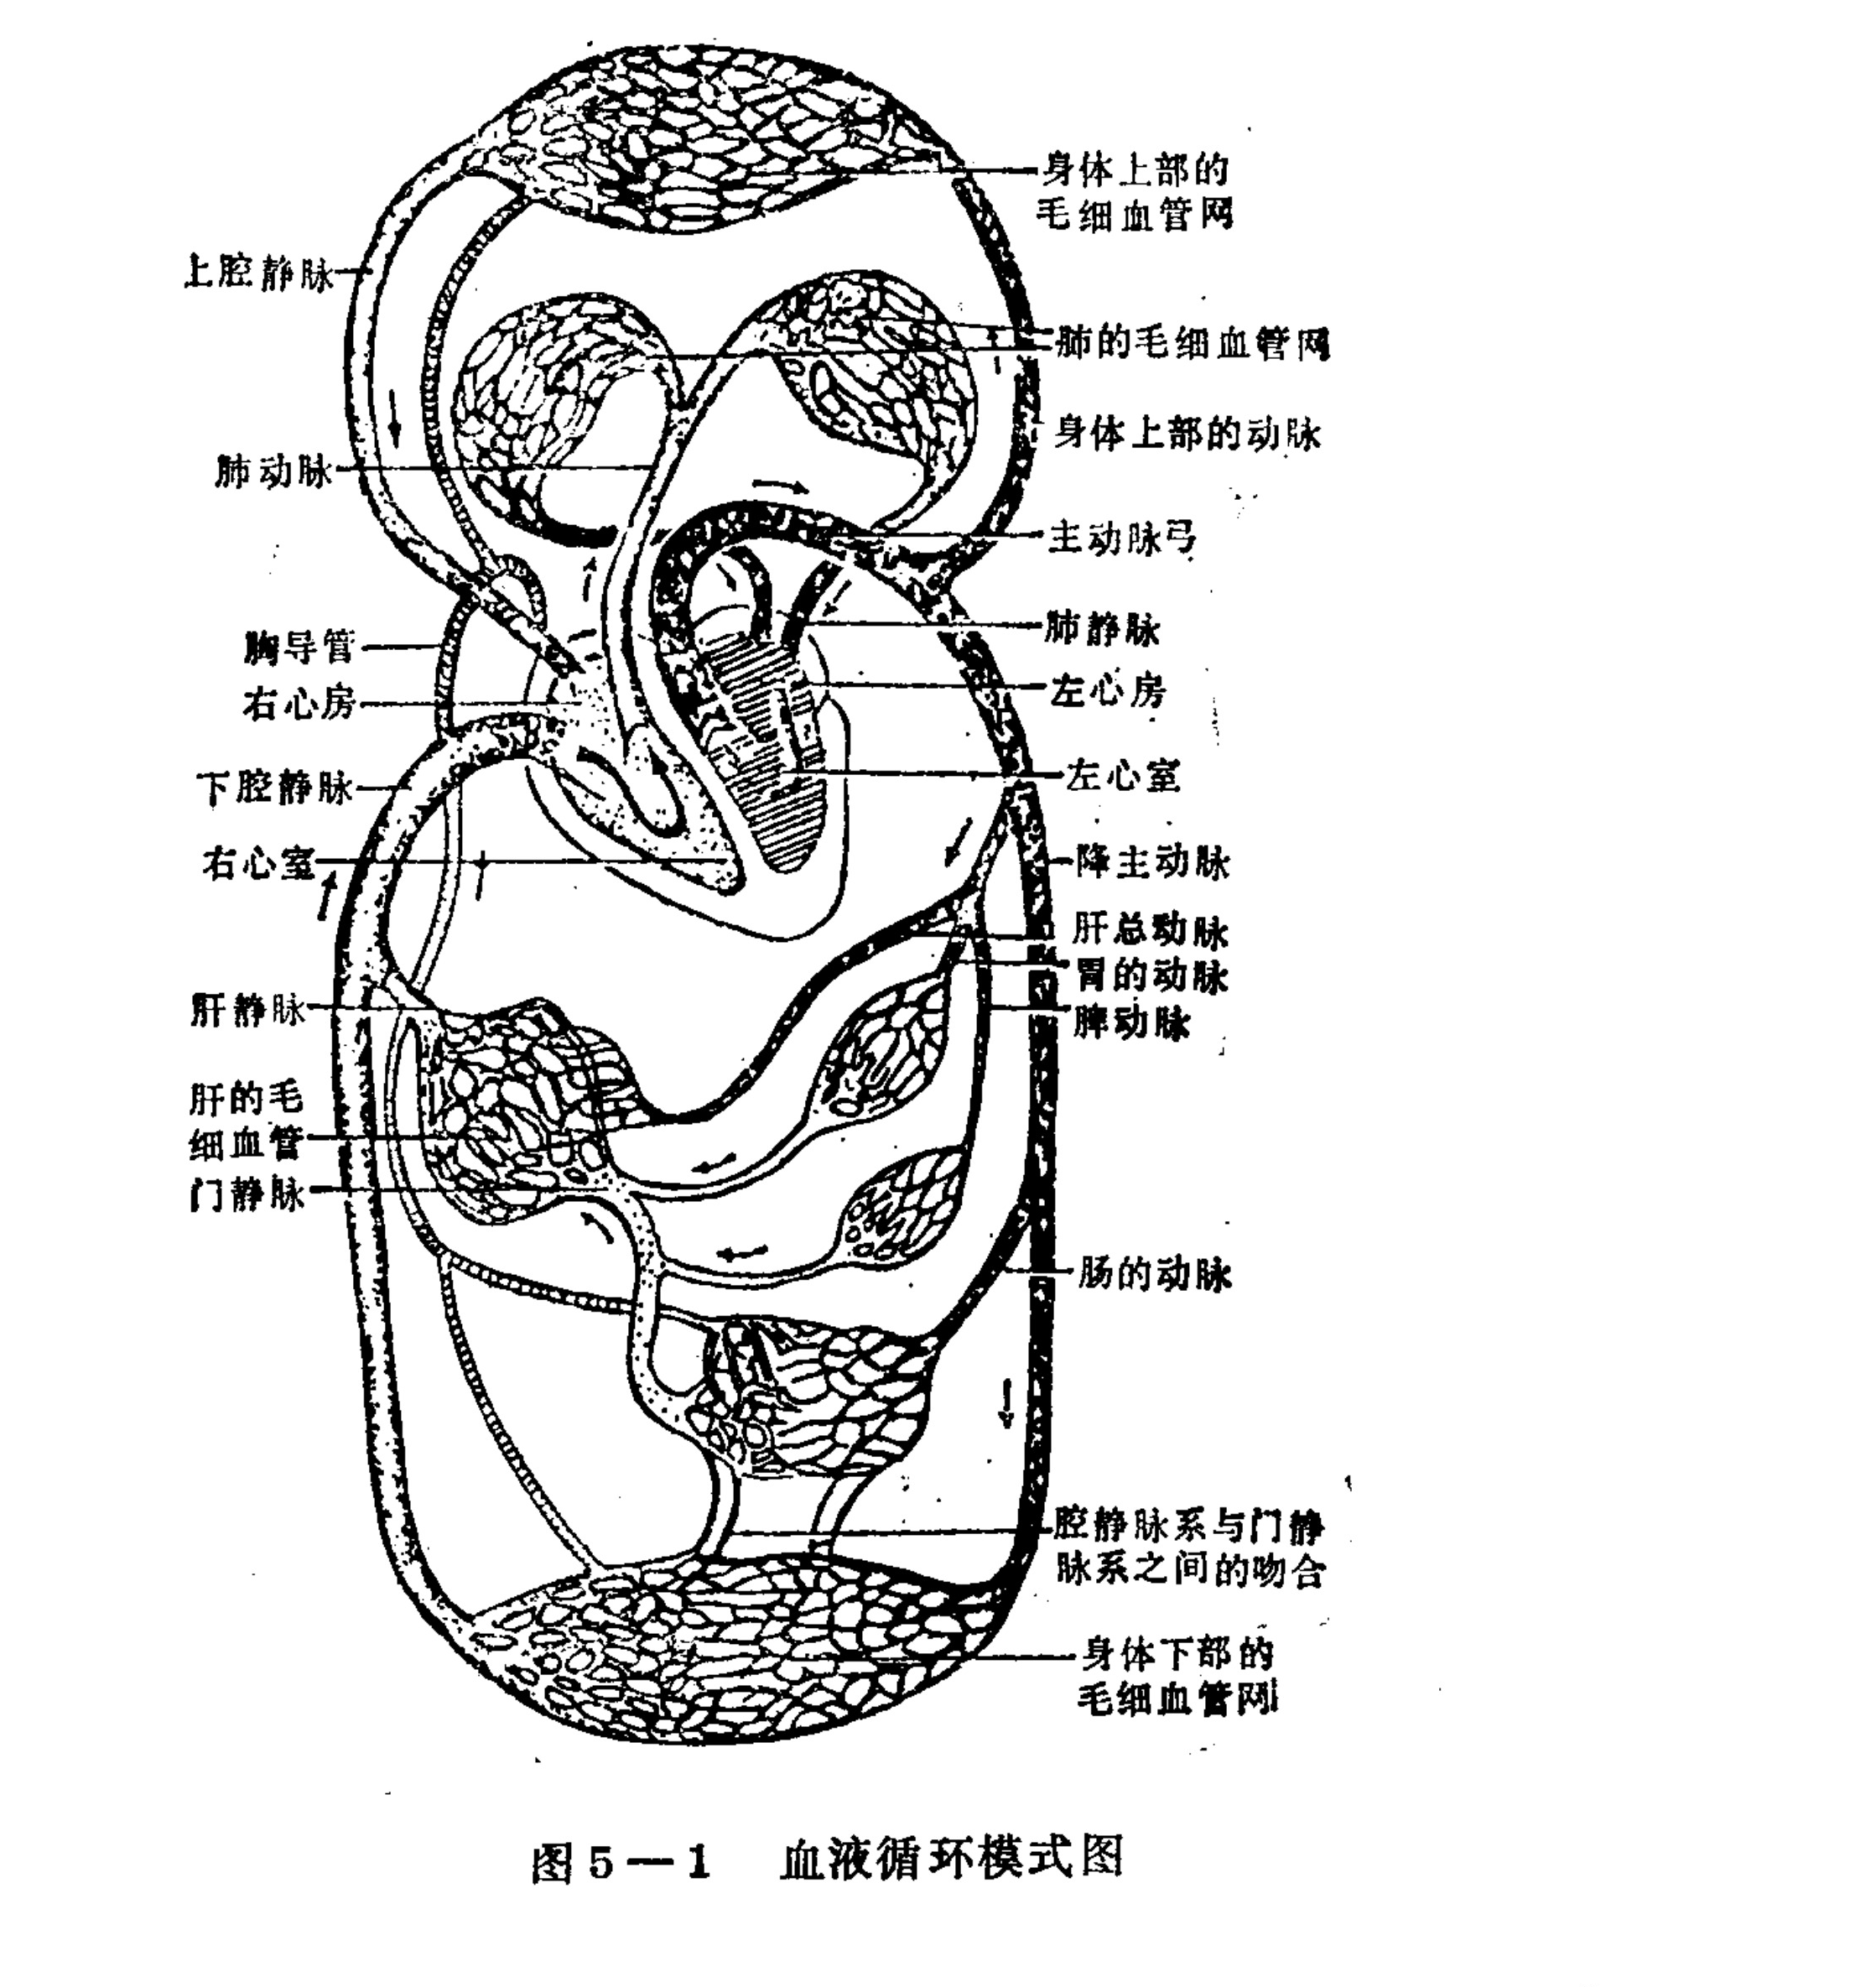
Figure 5-1. Schematic diagram of blood circulation
Translated labels: Superior vena cava; Pulmonary artery; Thoracic duct; Right atrium; Inferior vena cava; Right ventricle; Hepatic vein; Liver capillaries; Portal vein; Capillary network of the upper body; Pulmonary capillary network; Arteries of the upper body; Aortic arch; Pulmonary veins; Left atrium; Left ventricle; Descending aorta; Common hepatic artery; Gastric artery; Splenic artery; Intestinal arteries; Anastomosis between the caval and portal venous systems; Capillary network of the lower body
The atrial systolic period accounts for about 0.1 seconds, and the atrial diastolic period is about 0.7 seconds; the ventricular systolic period accounts for about 0.35 seconds, and the ventricular diastolic period about 0.45 seconds. When the heart rate increases, the cardiac cycle shortens. Both systole and diastole then shorten, but diastole shortens more markedly. Therefore, when the heart rate increases, the time during which the cardiac muscle works is relatively prolonged, while its resting time is relatively shortened.
The volume of blood ejected by the ventricle during one beat is called the stroke volume. In a person at rest, the stroke volume is approximately 60–80 milliliters. The volume of blood ejected by the heart per minute is called the cardiac output, or minute cardiac output. In a normal person, cardiac output is approximately 4,500–6,000 milliliters. Cardiac output is an important indicator of circulatory-system function. To a considerable extent, cardiac output is adapted to the metabolic rate of cells throughout the body’s tissues. In the body’s resting state, the metabolic rate is low and cardiac output is small; during physical labor and exercise, the metabolic rate increases, and cardiac output correspondingly increases. If cardiac output cannot meet the body’s metabolic needs, this constitutes insufficient circulatory function or circulatory failure and leads to various clinical symptoms. Cardiac output is determined by heart rate and stroke volume; both of these vary over time and adapt to the body’s metabolism and activity. There are two most basic factors affecting cardiac output: one is the heart’s ability or efficiency in ejecting blood; the other is venous return.
Arterial blood vessels are elastic structures. When filled with blood, they generate blood pressure. Arterial blood pressure drives blood through the capillaries, transporting various substances to all the body’s tissues. The potential energy in blood pressure is converted from the kinetic energy of blood pumped out by cardiac contraction. Maintaining stable arterial blood pressure is an important condition for ensuring normal blood circulation. As blood passes through the various branches of the vessels, vascular resistance causes blood pressure to fall. After the pressure passes through the arterioles, it drops sharply, and blood flow also changes from pulsatile to steady. Each arteriole branches into many capillary vessels, making the total cross-sectional area of the capillary bed very large. Therefore, blood flow in the capillaries is very slow, just as the flow of a river slows in a broad section. When blood returns from the capillaries to the heart, it passes through venules and then through veins of progressively larger size. Near the heart, the number of veins decreases, and their total cross-sectional area also gradually decreases, so the blood-flow velocity increases. The distribution of blood pressure, blood flow, and blood volume in the various sections of the systemic circulation is shown in Figure 5-2.
Normal blood pressure varies among individuals and also differs with age and sex. It is slightly higher in men than in women, and arterial pressure gradually rises with increasing age. In adults, systolic pressure is approximately 110–120 millimeters of mercury, and diastolic pressure is 70–80 millimeters of mercury. Excessively high blood pressure increases the resistance against ventricular ejection, increasing the burden on the cardiac muscle. This causes compensatory hypertrophy of the left ventricle and leads to thickening of the smooth-muscle layer, reduction of the vascular lumen, and increased resistance. If blood pressure is too low, the blood flow is insufficient to supply the tissues’ metabolic needs. In addition to being determined by blood pressure, blood flow is also related to vascular resistance. The diameter of the small blood
[Figure 5-2 is a distribution graph. X-axis (left to right): Aorta, Large arteries, Small arteries, Arterioles, Capillaries, Venules, Small veins, Large veins, Vena cava. Y-axes: Cross-sectional area (cm², range 0–5000), Blood flow velocity (cm·s, range 0–100), Mean blood pressure (mmHg, range 0–45), and Percentage of total blood volume. Curves shown: blood pressure, blood flow velocity, and cross-sectional area.]
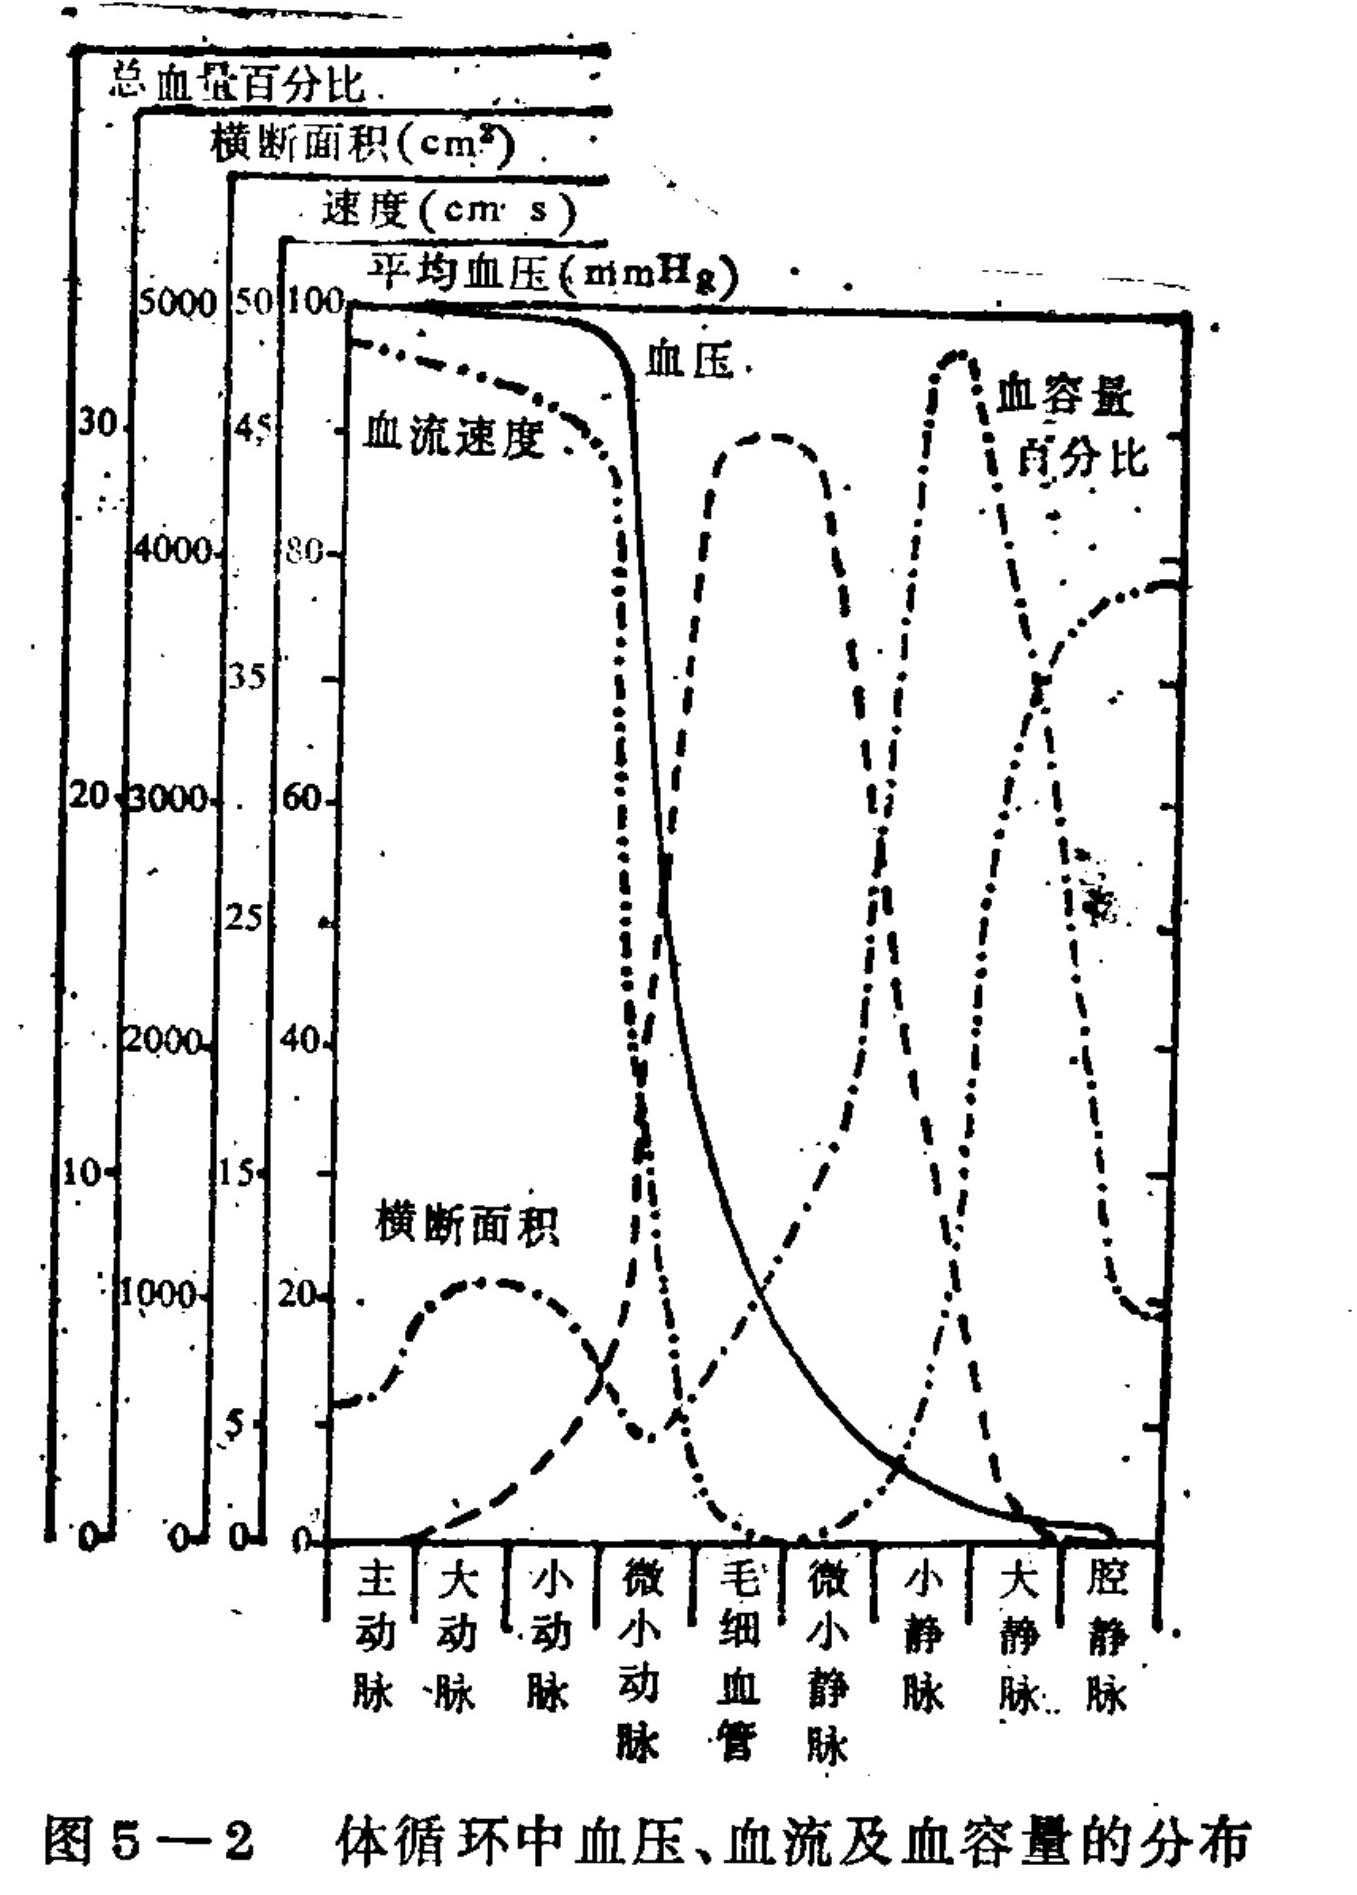
Figure 5-2. Distribution of blood pressure, blood flow, and blood volume in the systemic circulation
Translated labels: Total Blood Volume Percentage; Cross-sectional Area (cm²); Velocity (cm/s); Mean Blood Pressure (mmHg); Blood Pressure; Blood Flow Velocity; Cross-sectional Area; Blood Volume Percentage; Aorta; Large Arteries; Small Arteries; Arterioles; Capillaries; Venules; Small Veins; Large Veins; Vena Cava
vessel diameter is the most important factor affecting resistance. Resistance is approximately inversely proportional to the fourth power of the vessel radius. The heart and the large blood vessels near it constitute the “central” part of the circulatory system, while the small blood vessels constitute its peripheral part; therefore, the resistance of the small arterial vessels is called “peripheral resistance.” The total peripheral resistance of a healthy human circulatory system is approximately 0.45–1.5 peripheral-resistance units, or approximately 600–2,000 dyn·s/cm⁵. At rest, the distribution of peripheral resistance and blood flow among the organs of adults is shown in Table 5-1.
Table 5-1. Distribution of peripheral resistance and blood flow in adults at rest
| Organ | Blood flow (liters/minute) | Peripheral resistance (units) |
|---|---|---|
| Brain | 0.75 | 8.0 |
| Heart | 0.3 | 20.0 |
| Gastrointestinal tract | 1.4 | 4.3 |
| Kidneys | 1.1 | 5.4 |
| Skin | 0.5 | 12.0 |
| Skeletal muscle | 1.2 | 5.0 |
| Other | 0.6 | 10.0 |
| Total | 5.85 | 1.0 |
Note: The estimated figures for organ blood flow vary somewhat. The reciprocal of total peripheral resistance is the sum of the reciprocals of the resistances of the individual organs.
I. Regulation and Control of the Cardiovascular System
Through the development of a long process of evolution, the human circulatory system and its regulatory mechanisms have become quite sophisticated. Under different physiological conditions, they enable the blood flow to each organ and tissue to meet its metabolic needs. In terms of regulatory pathways, the cardiovascular system is mainly regulated in two ways. One is humoral regulation, meaning regulation of the cardiac muscle and vascular smooth muscle by certain chemical substances in the blood and tissue fluid. This includes local regulation by metabolic products and systemic humoral regulation. Systemic humoral regulation acts mainly through hormones. It includes regulation of blood volume by the adrenal mineralocorticoids, regulation of cardiac output and peripheral resistance by the adrenal medullary hormones, and regulation of peripheral resistance and blood volume by renin, a special product of the kidneys.
The other is neural regulation. Both the cardiac muscle and vascular smooth muscle are innervated by sympathetic and parasympathetic nerve fibers. The spinal cord contains the primary center for the sympathetic nerves, but the medulla oblongata is the important neural center regulating cardiovascular activity. However, stimulation of the hypothalamus and the
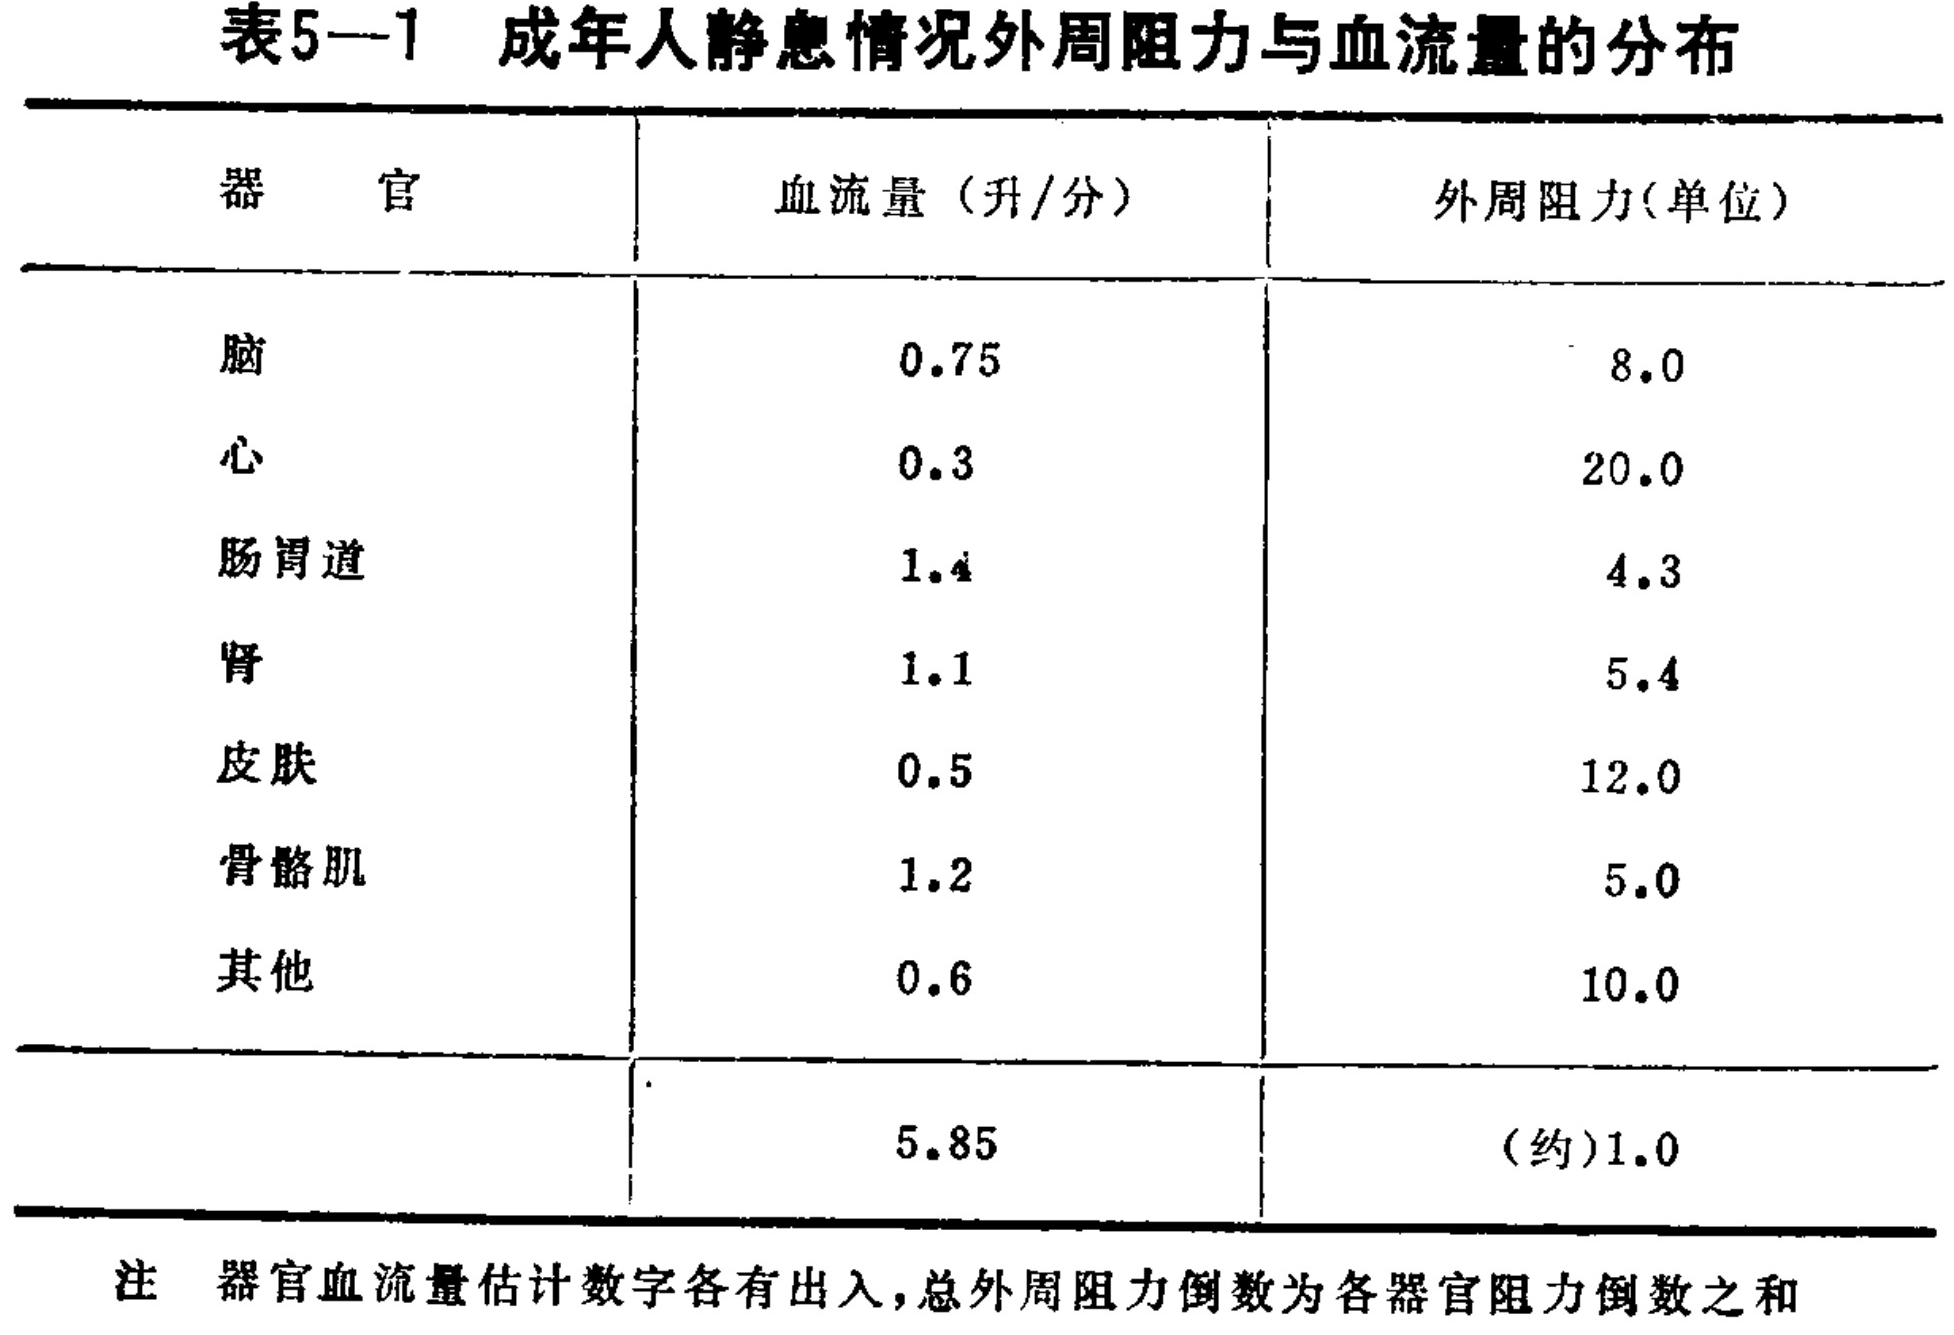
Table 5-1 Distribution of peripheral resistance and blood flow in resting adults
Translated labels: Table 5-1; Distribution of peripheral resistance and blood flow in resting adults; Organ; Blood Flow (L/min); Peripheral Resistance (units); Brain; Heart; Gastrointestinal tract; Kidney; Skin; Skeletal muscle; Others; Note: Estimated organ blood flow figures vary; the reciprocal of total peripheral resistance is the sum of the reciprocals of individual organ resistances
midbrain also produces a pressor response; therefore, in the broad sense, the cardiovascular center exists at all levels of the hypothalamus and brainstem.d.
At the carotid sinus there are pressure receptors that provide information about changes in blood pressure. When carotid-artery blood pressure falls, the firing of the sinus pressure receptors decreases. Through the sinus nerve, information about the reduced blood pressure is transmitted to the cardiovascular center in the medulla, causing the sympathetic center to become excited and the vagal center to be inhibited. As a result, cardiac output increases and the blood vessels constrict, causing blood pressure to rise again. Conversely, when pressure in the carotid sinus rises, receptor firing increases, inhibiting the sympathetic center and exciting the vagal center. The heartbeat then becomes weaker, the blood vessels dilate, and blood pressure falls, thereby maintaining its stability.
This is therefore a negative-feedback system, represented in Figure 5–3. Pressure receptors are also present in the aortic arch and likewise exert a pressure negative-feedback effect together with the carotid-sinus pressure receptors; both are closed-loop systems. The gain of the carotid-sinus loop is relatively high, so its control over blood pressure is also strong. Pressure-receptor feedback is the principal mechanism ensuring stable blood pressure under normal conditions. A method that imitates the dynamic characteristics of pressure receptors has been used to improve the control characteristics of treating hypertension by stimulating the carotid sinus.
To ensure the brain’s blood supply, the cardiovascular center contains cells sensitive to ischemia. These serve as the feed
Input + Controller (cardiovascular center) → Control object (heart and blood vessels) → Output (blood pressure) Feedback element (pressure receptors)
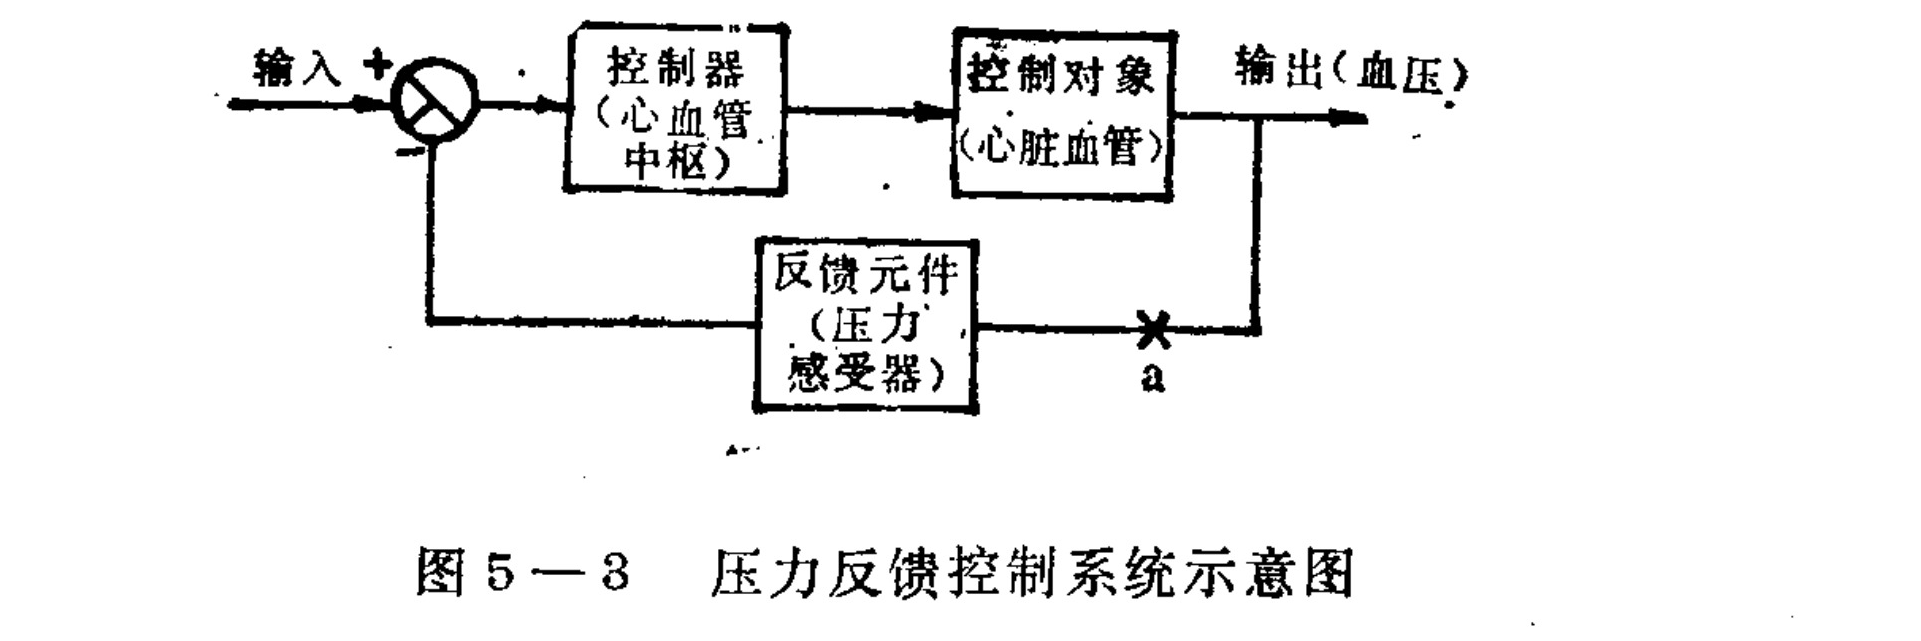
Figure 5–3. Schematic diagram of the pressure-feedback control system
Translated labels: Input; Controller (Cardiovascular Center); Control Object (Heart and Blood Vessels); Output (Blood Pressure); Feedback Element (Pressure Receptors)
back variable forming the cerebral-ischemia feedback loop. Experiments have shown that when cerebral ischemia is equivalent to a blood pressure of 30–40 mmHg, the gain of this feedback system increases greatly—more than eight times higher than that of the carotid-sinus pressure-feedback loop—forming a strong pressor effect. This feedback loop is an emergency measure for ensuring the brain’s blood supply. However, when the gain of a closed-loop system is too high, it is liable to produce self-sustained oscillation. In fact, the phenomenon observed clinically in brain-tumor patients during the last century—third-order waves in systemic blood pressure (blood-pressure fluctuations with a period shorter than the respiratory cycle)—was the result of an excessively strong response in the cerebral-ischemia loop.
Oxygen in the blood is the source of the oxygen required for the organism’s metabolism. Metabolic processes continually consume oxygen. To ensure the oxygen supply needed for metabolism, not only must there be a certain blood flow to perfuse the organs and tissues, but the blood-oxygen concentration must also reach a certain level, while the blood carbon-dioxide concentration must not become too high. If blood flow cannot meet metabolic oxygen demand because blood pressure is too low, the blood-oxygen concentration falls. The circulatory system should be able to use this information. Chemoreceptors are present in the aortic bodies and carotid bodies. When blood oxygen decreases and blood carbon dioxide increases, the firing of the chemoreceptors increases; this information is transmitted to the medulla, which acts to restore the blood oxygen level. This too is a negative-feedback system.
The responses of the three feedback systems described above can be completed in ten-odd seconds to several tens of seconds. They constitute the rapid-response component of blood-pressure regulation, but they operate over different pressure ranges. The pressure-receptor loop mainly operates at normal blood pressure, in the range of 90–150 mmHg; the chemoreceptor loop mainly operates in the range of 70–80 mmHg; and the cerebral-ischemia loop operates in the range of 30–50 mmHg. Working together, they ensure blood-pressure stability.
All three feedback loops are proportional-control systems: they act only after a deviation occurs, and therefore produce a static error. When a disturbance occurs, they cannot eliminate it completely, but only reduce its effect. The circulatory system also contains other feedback systems that can eliminate static error. Among these, the kidney–body-fluid system is the most important. Changes in blood pressure can cause marked changes in the renal excretion rate, thereby changing the body-fluid volume; the resulting change in blood volume in turn controls arterial pressure. This is an integral control system, because blood pressure changes the excretion rate, while blood volume is the integral function of the excretion rate. Thus this system does not produce a static error. Because its response is slow, however, the regulatory process requires several hours or even several days to complete. In addition to the four feedback systems mentioned above, there are the renin–angiotensin system, the antidiuretic-hormone and osmoreceptor system, the aldosterone system, the capillary and capillary-filtration systems, the vascular-capacitance system, and others.
The antidiuretic-hormone and osmoreceptor system, the aldosterone system, the capillary and capillary-filtration systems, the vascular-capacitance system, and others all participate in blood-pressure regulation. These systems all involve humoral regulation, respond slowly, and have their own operating ranges. Under normal conditions, for example, the renin–angiotensin system secreted by the kidneys is insufficient to produce a pressor response. When blood pressure falls because of blood loss, shock, or a similar condition, however, renin secretion increases, forming angiotensin, which constricts the blood vessels and changes the body-fluid volume, causing blood pressure to rise.
These nine systems interact with one another. Their relationships are shown approximately in Figure 5–4. By operating over different pressure ranges, with different response speeds and different types of control action, the systems cooperate to maintain blood pressure at an appropriate level under different conditions.
- Central nervous system / cardiovascular center
- Chemoreceptors
- Pressure receptors
- Sympathetic nerves
- Hormones and ions
- Renal–body-fluid system
- Blood volume / venous return
- Osmotic pressure
- Capillary blood pressure
- Vascular capacitance
- Resistance
- Circulating blood volume
- Capillary filtration
- Active vascular dilation / stress relaxation
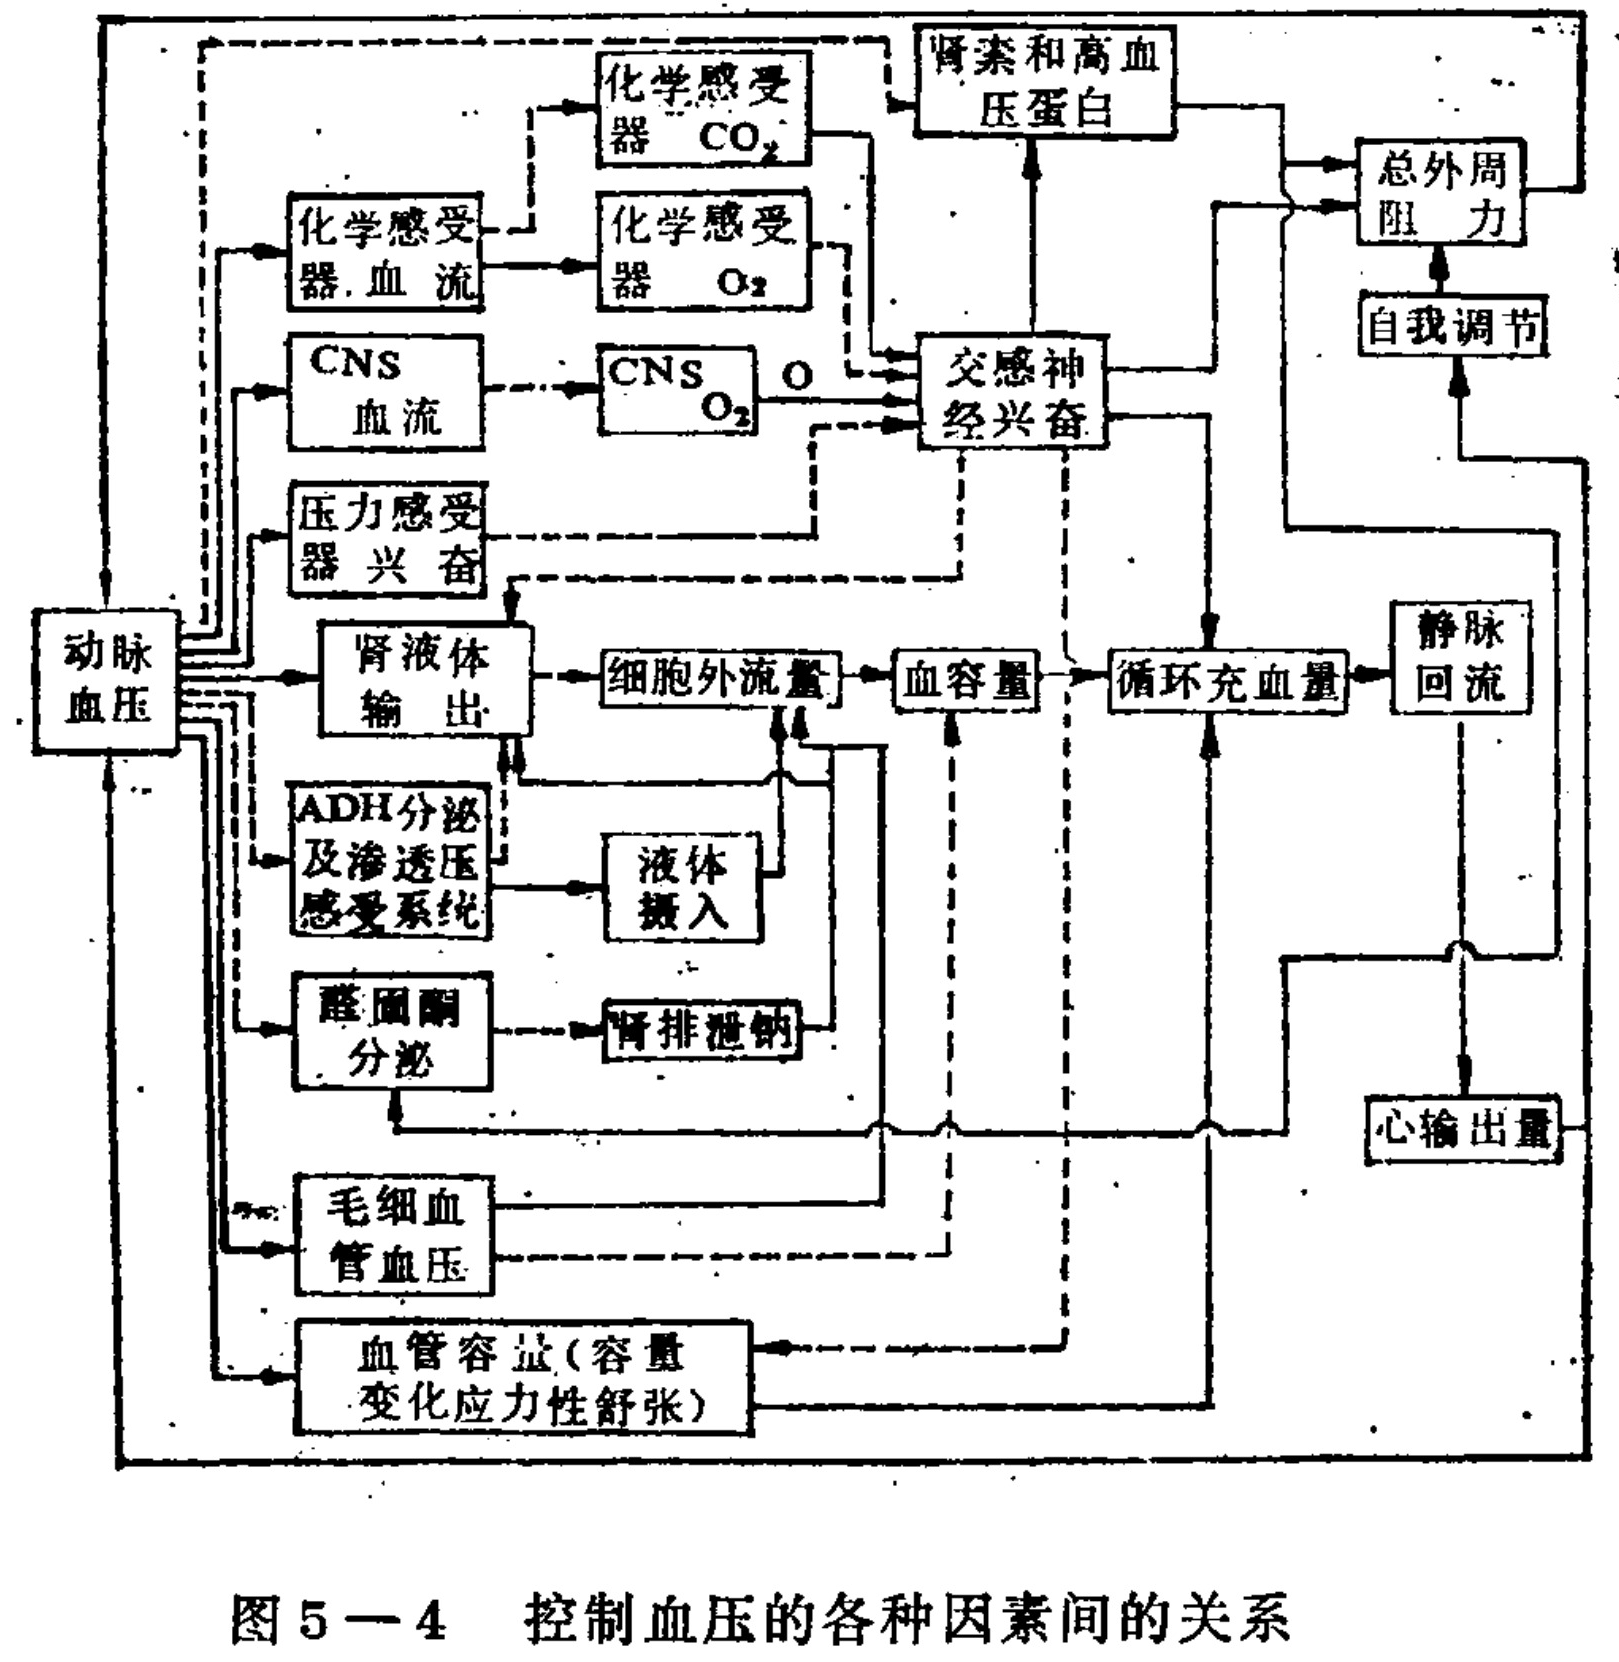
Figure 5–4. Relationships among the various factors controlling blood pressure
Translated labels: Arterial Blood Pressure; Chemoreceptor CO2; Chemoreceptor O2; CNS Blood Flow; Baroreceptor Excitation; Sympathetic Nerve Excitation; Renin and Angiotensin; Total Peripheral Resistance; Autoregulation; Renal Fluid Output; Extracellular Volume; Blood Volume; Circulating Blood Volume; Venous Return; Cardiac Output; ADH Secretion and Osmoreceptor System; Liquid Intake; Aldosterone Secretion; Renal Sodium Excretion; Capillary Pressure; Vascular Capacity
The relative stability of blood pressure provides the necessary conditions for supplying blood to all parts of the organism, but stable blood pressure alone cannot meet the organism’s needs under different circumstances.
Under different levels of activity, the distribution of material and energy metabolism among the various parts of the organism differs. The circulatory system must therefore change the total blood flow and its distribution among the different regions according to actual need. For example, at rest, the human body’s total blood flow is approximately 5 liters per minute. During strenuous exercise, it can reach 30 liters per minute. The metabolic rate of the same tissue can differ greatly under different conditions; muscle tissue in particular may show a fifty-fold increase in metabolic rate, and the required blood supply therefore differs as well. In practice, the blood flow to some muscles can increase twenty-fold.
The circulatory system can control blood flow, including both global control (total blood volume) or control over blood volume in a relatively large region, and local blood-flow control. Global control is achieved mainly through the nervous system and hormones and ions in the body fluids. The cardiovascular center integrates various kinds of information and controls the strength of cardiac activity as well as the dilation and constriction of the arterial vessels, ensuring the requirements of total blood flow.
Local blood-flow control ensures the blood supply required by different tissues under particular conditions. The small arteries and capillaries have little or no nerve supply; control is exerted mainly by oxygen, carbon dioxide, adenosine, lactic acid, and other metabolic products in the local body fluid. Thus, when local hypoxia occurs and metabolic activity increases, the local blood vessels can dilate and blood flow can increase.
Inflammatory agents, such as bacteria, viruses, and toxins, acting on local tissue can also cause the small arteries and capillaries to dilate actively and accelerate local blood flow. Consequently, more white blood cells and immune substances can reach the site of inflammation, helping eliminate the inflammatory agents and allowing the organism to return to normal more quickly.
Blood flow in the microcirculation is automatically regulated under the action of body fluids, mainly through control of the precapillary sphincters. The body fluids contain vasoconstrictor substances, principally catecholamines, and vasodilator substances, such as metabolic products. At rest, the concentration of vasoconstrictors changes little, while the concentration of vasodilators changes with blood flow. When a sphincter relaxes, the capillary opens and local metabolites are rapidly carried away, so their concentration falls. Under the action of vasoconstrictors, the sphincter then contracts, reducing or closing capillary blood flow. But tissue metabolism continues, causing nearby metabolites to increase again; the sphincter relaxes once more, and the capillary opens again, forming a negative-feedback loop.
Capillary dilation and constriction alternate: dilation leads to constriction, and constriction in turn leads to dilation, so the mean blood flow meets the needs of local metabolism. Blood-flow control also plays an important role in thermoregulation. When body temperature rises, the hypothalamic thermoregulatory center becomes excited and, through the sympathetic nerves, cause the blood vessels of the skin to dilate, thereby dissipating heat from inside the body through the body surface and lowering body temperature. In general, blood flow in every part of the body can be automatically regulated as needed. Because the cranial-cavity volume is relatively fixed, the range of cerebral-vascular constriction and dilation is limited, and changes in cerebral blood flow are not as great as those in other organs. Animal experiments show that when the central nervous system is strongly excited, cerebral blood flow increases by only 50%, whereas when brain activity is deeply suppressed by drug anesthesia, blood flow decreases by only 30–40%. Myocardial blood flow, however, may increase 4–5 times, and skeletal-muscle blood flow may increase 15–20 times. Within the normal arterial-pressure range, cerebral blood flow is mainly regulated by the concentration of carbon dioxide (or hydrogen ions). When a certain cerebral center is excited, the local cerebral blood vessels dilate and blood flow increases. Brain cells have a high metabolic rate, and their blood flow is correspondingly large. Because the range of cerebral-blood-flow variation is not great, mutually inhibitory connections have been established within the nervous system: when one part of the nervous center is excited, other nervous centers are inhibited, enabling cerebral blood flow to adapt to the brain’s overall metabolic requirements.
To propel blood through the vessels, the heart must perform work to overcome vascular resistance. As a result of long-term evolution, the branching arrangement of the blood vessels in the human body is highly rational. Calculations have demonstrated that, for a given blood flow, the form of the vascular branches and the distribution of their diameters minimize the energy loss caused by resistance.
3. Models of Cardiovascular-System Regulation
The cardiovascular system is an important physiological system in the human body. Cardiovascular disease is an important disease endangering public health, and regulating and controlling the cardiovascular system is a complex dynamic-system problem. Consequently, research on mathematical models of the cardiovascular system has received considerable attention. Various mathematical models of differing complexity have now been established to address different problems in cardiovascular regulation and control. Some concern regulation of the entire circulatory system, while others discuss the regulation and control of individual control loops. Some are black-box models that consider only the relationship between output and input; others consider the details of many anatomical structures in the circulatory system. The following examples briefly illustrate the application of mathematical models and mathematical simulation methods in cardiovascular research. Because of space limitations, further models and detailed descriptions are not introduced here.
Interested readers may consult relevant monographs.
1. Model of the Baroreceptor Feedback System
As noted above, within the normal blood-pressure range, the baroreceptor feedback loop is the main factor ensuring relative blood-pressure stability. It is a typical negative-feedback system, as shown in Figure 5–3, and can be analyzed using classical control theory. To obtain quantitative data for this system, we first study its open-loop static characteristics. We open the loop at point a in the figure—that is, at the carotid sinus—and separate the carotid sinus from the systemic circulation.
The pressure in the carotid sinus is freely controlled by an external force, but the sinus nerve should remain intact and normal circulation of carotid-sinus blood should be maintained. Different constant pressures, Ps, can be applied successively to the carotid sinus. The blood pressure of the entire system (the whole body) then changes accordingly, because the afferent nerve impulses from the sinus nerve change, producing corresponding changes in the cardiovascular center. The corresponding mean arterial pressures, PA, are recorded. Plotting Ps against PA with carotid-sinus pressure as the horizontal coordinate and mean arterial pressure as the vertical coordinate, and connecting the points, gives the open-loop static characteristic of the carotid sinus.
The change in mean arterial pressure caused by a change in carotid-sinus pressure can be regarded as the open-loop amplification factor (or gain). To obtain the open-loop frequency characteristics, sinusoidal pressure inputs of different frequencies should be added to the isolated carotid sinus. The frequency of the added sinusoidal pressure, based on the system’s dynamic response, ranges from 0.01 to 0.5 cycles per second. The pressure’s
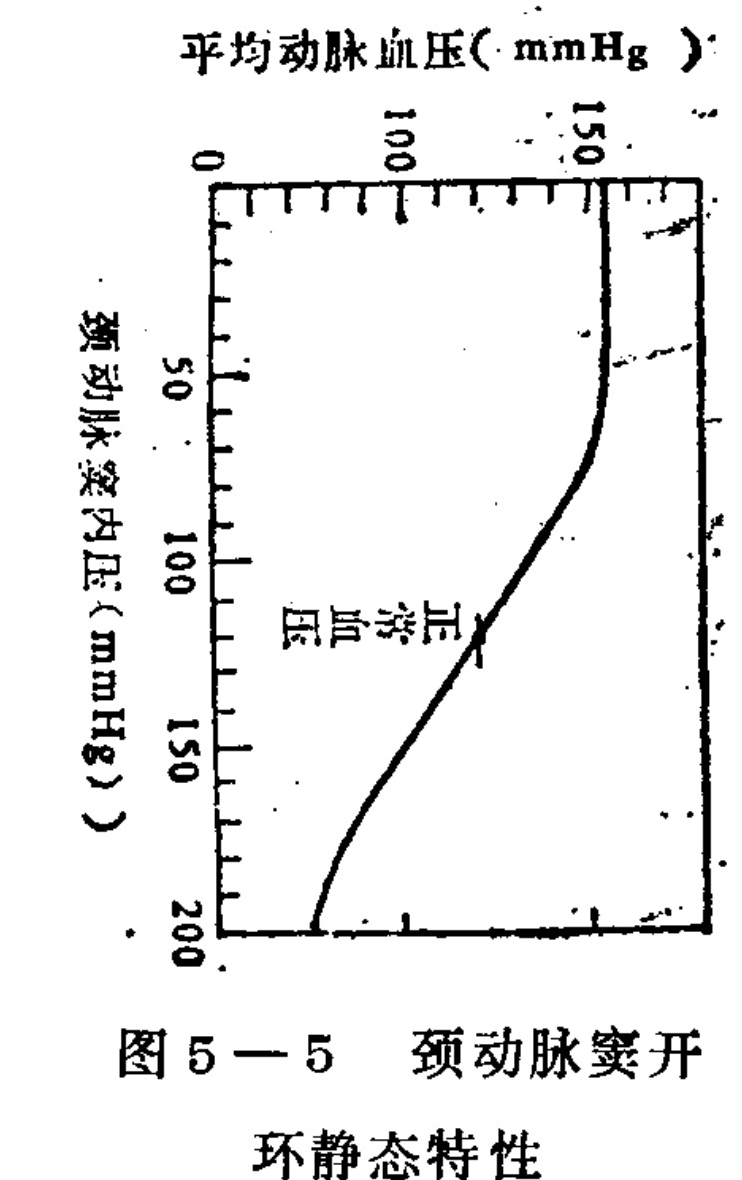
Figure 5-5 Static characteristics of the carotid sinus open-loop system.
Translated labels: Mean Arterial Pressure (mmHg); Carotid Sinus Intraluminal Pressure (mmHg); Normal Blood Pressure
amplitude is within the linear range: in the low-frequency band the amplitude is 5–30 mmHg, and in the high-frequency band it is 25–40 mmHg.pen-loop frequency-characteristic curves for the carotid sinus obtained in experiments on three animals.
The figure shows the following: (1) The amplitude-frequency characteristic has a peak between 0.03 and 0.05 cycles/second, indicating that the system has resonance characteristics in this frequency range. (2) Near 0.1–0.2 cycles/second, the phase reaches 180°, but the system gain is then less than 1; therefore, the closed-loop system is stable. (3) The amplitude-frequency characteristic decreases at 30–40 dB per tenfold increase in frequency, indicating that the system approaches a second-order oscillatory system. (4) The maximum gain is approximately 2–4.4.
When the arterial-blood-pressure output waveforms are examined closely, it can be found that they are asymmetric: the descending portion is relatively steep while the ascending portion is relatively flat, reflecting nonlinearity in the system. Therefore, square-wave or pulse-wave pressure inputs can further be applied to the isolated carotid sinus. Figure 5–7 shows the recorded input and output waveforms when a square-wave input with an amplitude of 2–20 mmHg and a frequency of 0.01 cycles/second is applied.
All animals used in these experiments
156
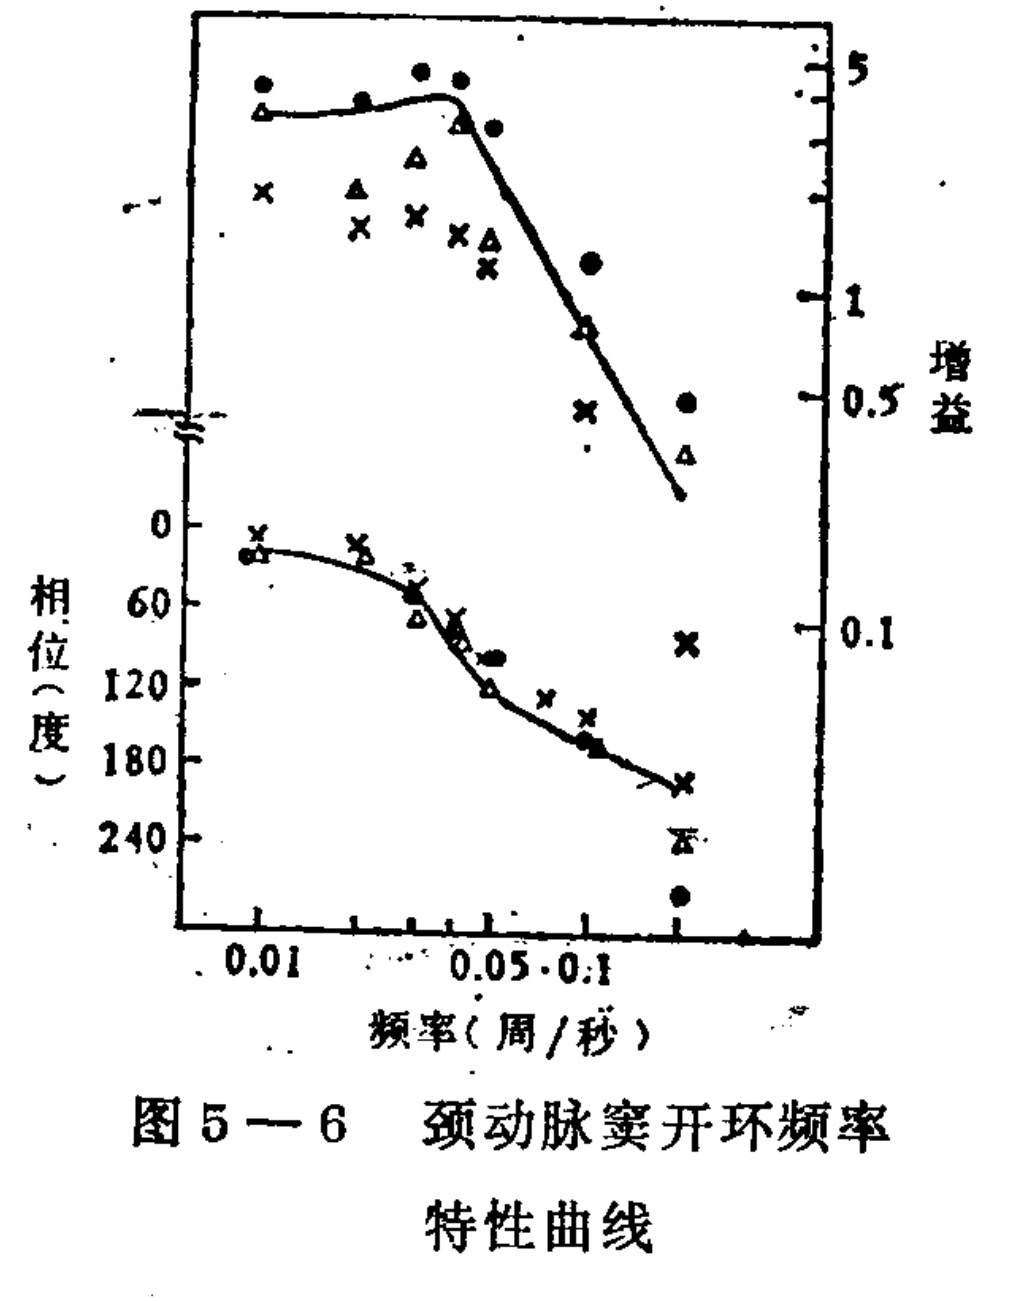
Figure 5–6. Open-loop frequency-characteristic curves.
Translated labels: Phase (degrees); Frequency (cycles/second); Gain
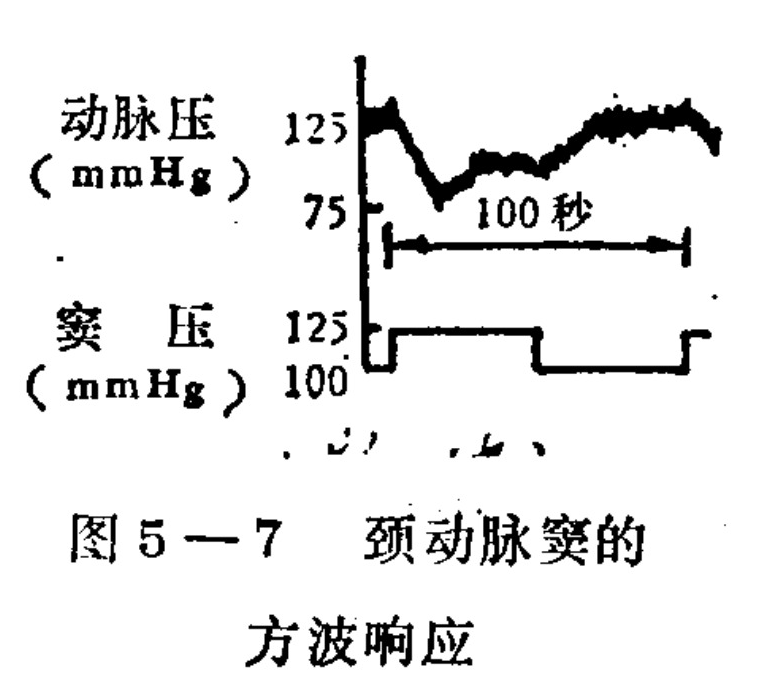
Figure 5–7. Square-wave response.
Translated labels: Arterial pressure; Sinus pressure; 100 seconds
showed similar results: the output responses were asymmetric.
When the sinus pressure rises, the arterial pressure drops sharply and overshoot occurs in every case, although the overshoot values differ. When the sinus-pressure step rises, the arterial pressure rises more gradually and no overshoot occurs. Figure 5–8 shows the situation when a pulse-pressure input is applied to the carotid sinus; the pulse width is 1 second and the amplitude is 25 mmHg. Whether the pulse is positive or negative, it causes blood pressure to fall. During the first 10 seconds, the pressure falls to its minimum; after approximately 100 seconds, it rises back to its original blood-pressure level. The maximum amplitude of the arterial-pressure decrease caused by a positive pulse is 1–1.5 times that caused by a negative pulse. These facts show that the baroreceptor system has a unidirectional rate-sensitive characteristic. This characteristic exists in many biological feedback systems and helps improve their dynamic characteristics.
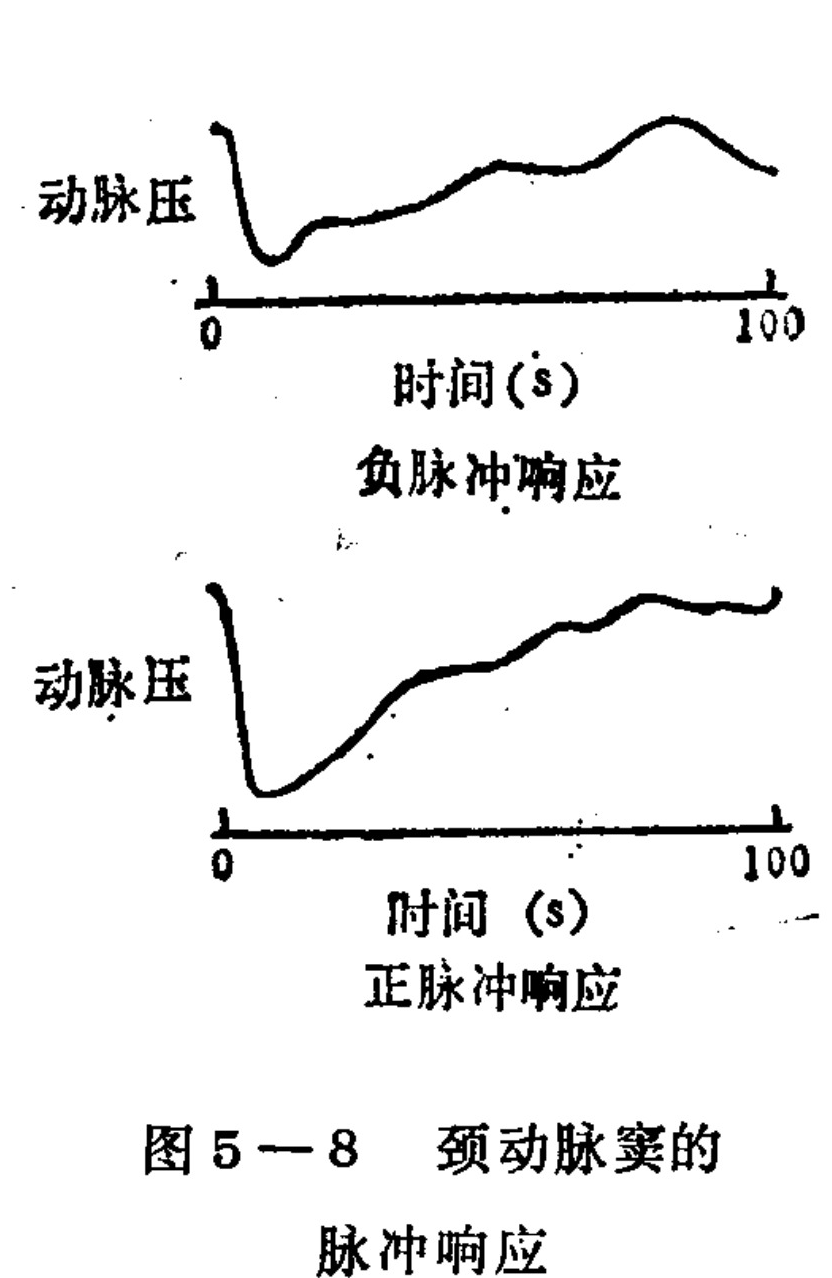
Figure 5–8. Pulse response.
Translated labels: Arterial Pressure; Time (s); Negative pulse response; Positive pulse response
The above experimental results yield the following basic characteristics of the carotid-sinus baroreceptor feedback system: (1) If secondary factors are ignored, the entire system can approximately be represented by a linear second-order system with a delay of about 2 seconds, a time constant of 20 seconds, and a static gain of approximately 1–2. (2) The closed-loop system is stable and has a relatively large stability margin. (3) The responses of the carotid-sinus baroreceptors to positive and negative pressure changes are asymmetric; within the normal pressure range, the response to positive pressure is stronger—that is, it has a stronger pressure-lowering effect.
2. Study of the Effect of Acupuncture on the Blood-Pressure Regulation System
Acupuncture improves cardiovascular-system function, and qigong also improves cardiovascular function. The results of acupuncture research can therefore provide insight for qigong research. During acupuncture anesthesia, we observe that the patient’s blood pressure, respiration, and other physiological parameters are more stable under acupuncture anesthesia than under drug anesthesia. This phenomenon can be explained by acupuncture’s improvement of the internal-environment regulation system.
…performance, but it also cannot be ruled out that this was the result of drug anesthesia blocking normal physiological regulatory functions, while acupuncture anesthesia merely preserved normal physiological regulation. To prove that acupuncture indeed improves regulation of the internal environment, we conducted the following experimental study. First, we regarded the blood-pressure regulation system as a “black box”; we deliberately perturbed it, producing dynamic changes in blood pressure. These were respectively the system’s input and output, from which its transfer function could be calculated, and the quality of the regulatory system could be judged from the properties of this dynamic process. We used dogs as experimental animals, using the cessation of artificial respiration for 5 seconds as the disturbance. We recorded the dynamic fluctuations in blood pressure caused by the same disturbance before acupuncture, 20 minutes after acupuncture, and 20 minutes after stopping acupuncture. Figure 5–9 shows a typical set of experimental results. It can be seen that acupuncture reduced the amplitude of blood-pressure fluctuations, and the process of returning to normal was accelerated; after acupuncture was stopped, this effect partially receded.
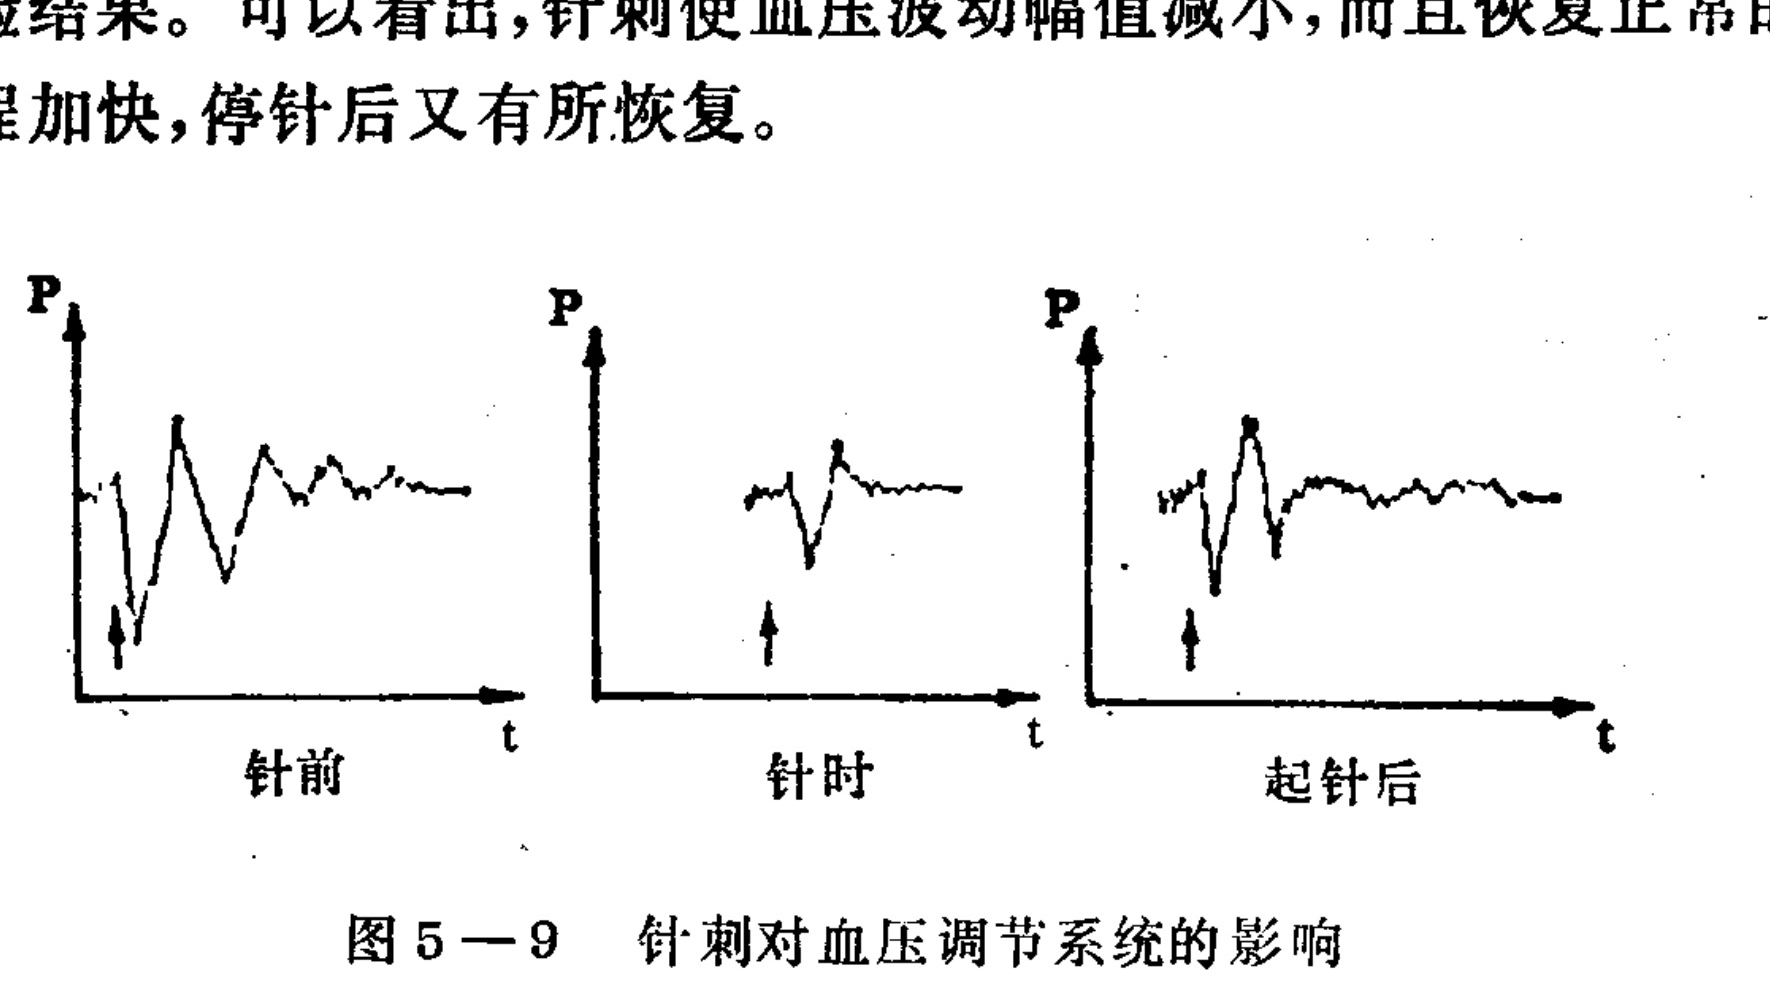
Figure 5–9: Effect of acupuncture on the blood-pressure regulation system. Curve labels: before acupuncture, during acupuncture, after needle removal.
Translated labels: Before needle; During needle; After needle; P; t
“Because the characteristics of the organism itself may change over time, we observed 42 instances without acupuncture in which a disturbance was introduced at 20-minute intervals. The amplitude of the resulting dynamic process generally tended to increase, and the recovery time also tended to increase, but the changes were not large. To quantify the effect of acupuncture, we used the fluctuation amplitude P of mean blood pressure, the transition-process time T, and the number of oscillations as indices, as shown in Figure 5–10. Cases in which all three indices improved were classified as excellent; cases in which two improved were classified as good. Among 30 experiments, there were
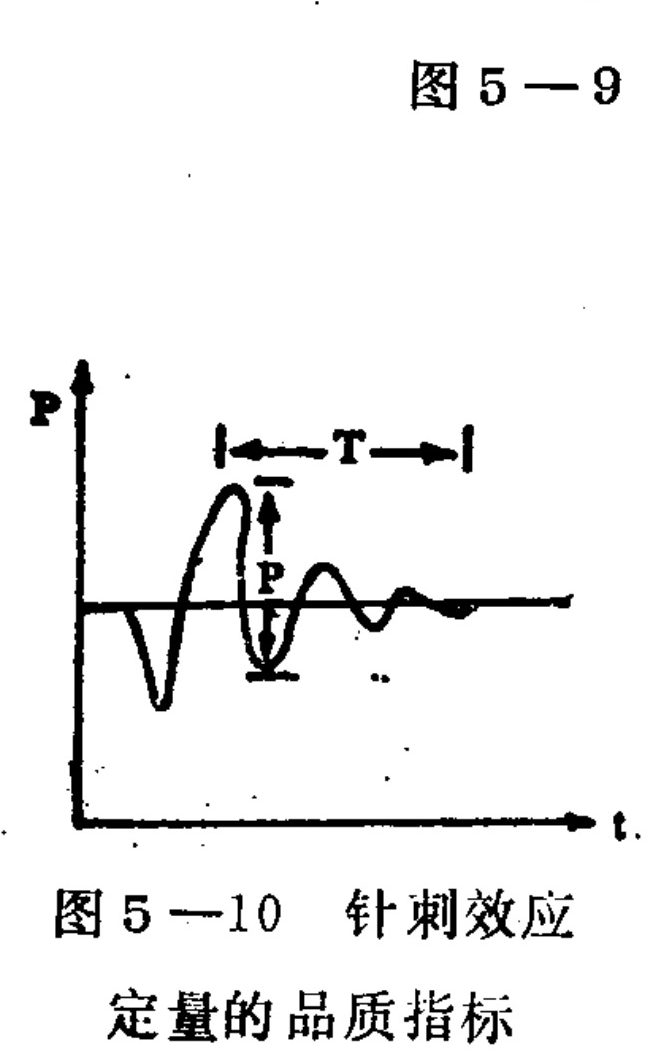
Figure 5–10: Quantitative quality indices of the acupuncture effect.
Translated labels: P: Vertical axis variable; T: Period between peaks; t: Horizontal axis (time)
10 excellent cases and 11 good cases; that is, the dynamic characteristics of the blood-pressure regulation system improved under acupuncture in the majority of the animals. Further statistical processing produced the results shown in Figure 5–11. It can be seen that the improvement in recovery time was more pronounced with acupuncture. In other words, acupuncture mainly accelerated the dynamic response of blood pressure.
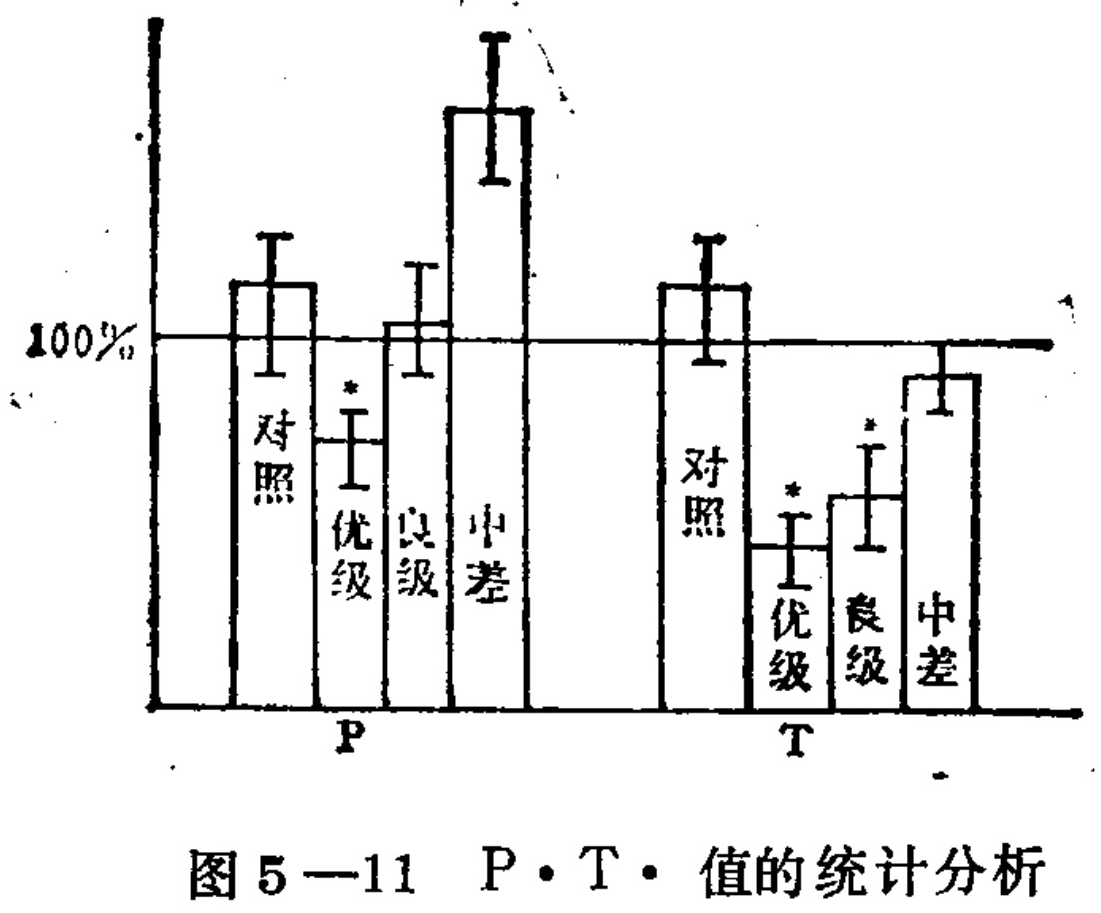
Figure 5–11: Statistical analysis of P and T values.
Translated labels: 100%; P; T; Control; Excellent grade; Good grade; Medium-Poor
For the dynamic processes of 21 animals rated excellent or good, we used methods from control theory to calculate the frequency-response characteristics of the closed loop. Applying the Mikhailov criterion, we found that the stability index had increased on average by a factor of two compared with before acupuncture. This proves that acupuncture increased the stability and disturbance-rejection capability of the blood-pressure regulation system and accelerated its dynamic response.
Using the same method, we studied six dogs with hemorrhagic hypotension. All six showed a marked improvement in their P and T values; the mean P value was only 58% of the pre-acupuncture value, while the T value was only 48.6% of the pre-acupuncture value. Thus, the effect of acupuncture in improving the cArtificial open-loop control of carotid-sinus pressure was achieved with the apparatus shown in Figure 5–12. The external carotid artery was ligated so that the carotid sinus would not be affected by systemic blood pressure; a thin membrane sac was placed in the carotid sinus, and the pressure inside it was determined by the height of the mercury column in a mercury vessel suspended from an arm of a motor rotating at constant speed. When the motor rotated at different constant speeds, sinusoidal pressure changes of different frequencies were applied to the carotid sinus. We used sinusoidal pressure waves from 0.01 to 0.1 cycles [per second] as the input and recorded the changes in systemic blood pressure (the output). These were also sinusoidal; their amplitude varied with frequency, and they had different phase differences from the input. The changes in amplitude and phase with frequency can be used to plot the open-loop frequency-response characteristic curve. Figure 5–13 shows the
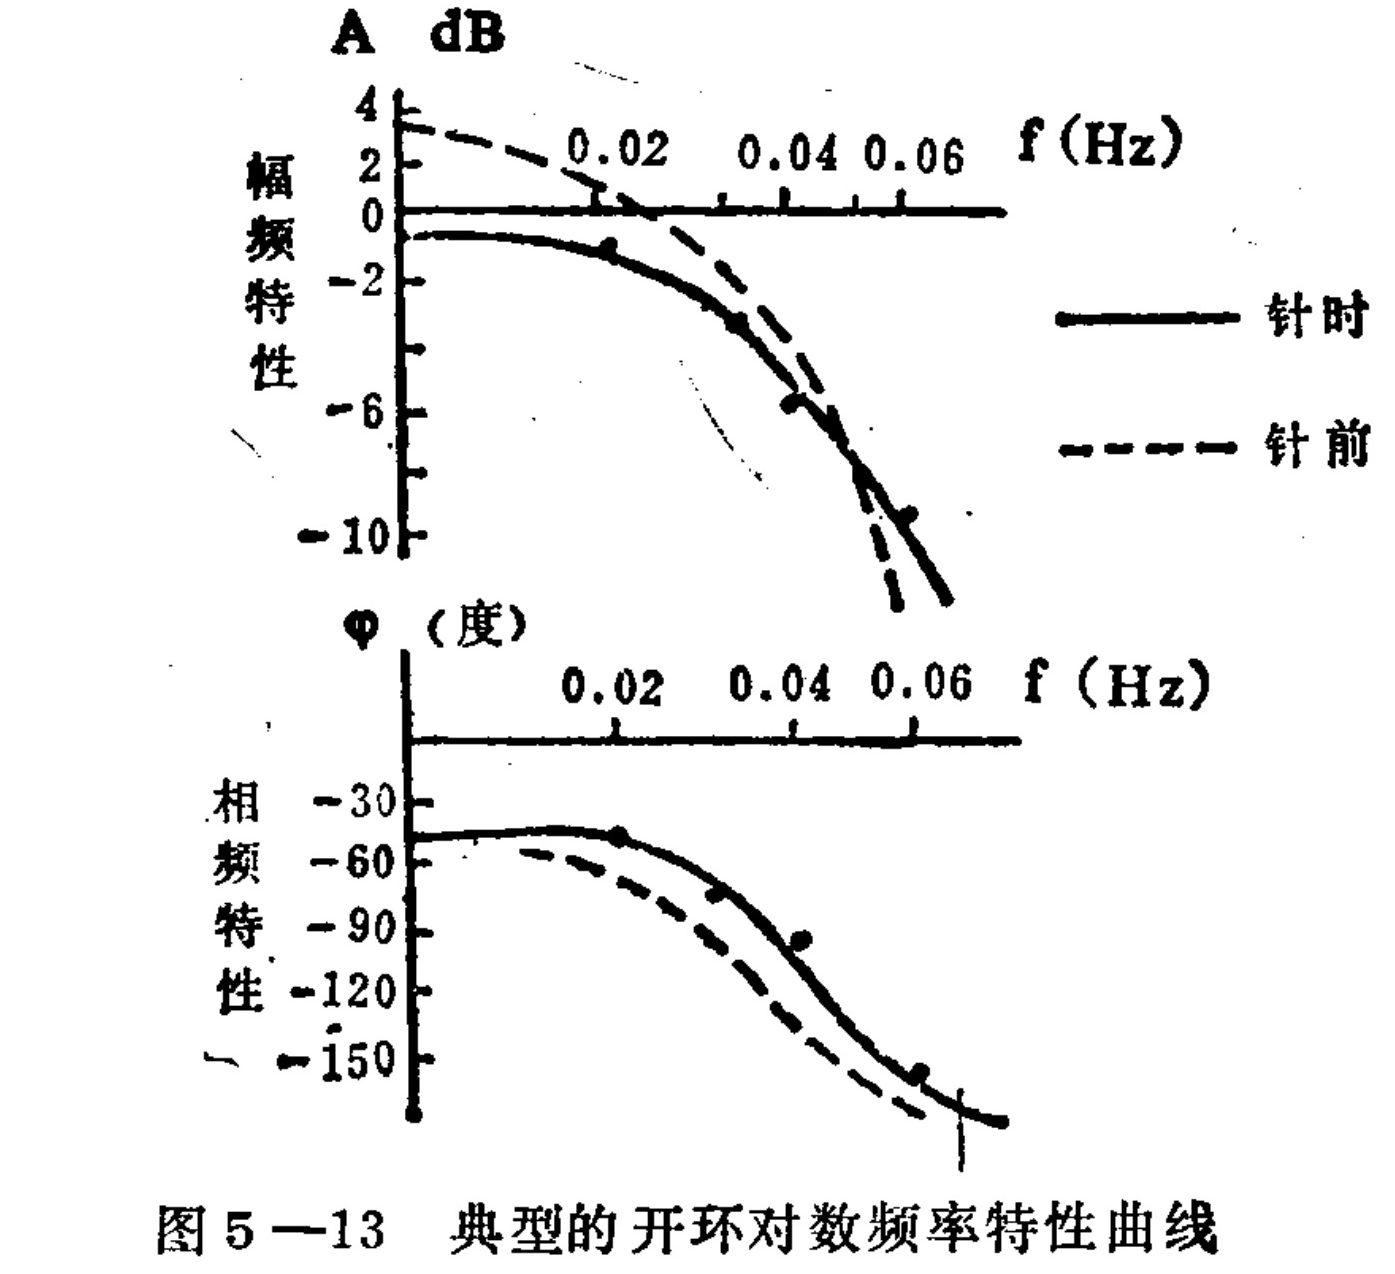
Figure 5–13: Typical open-loop logarithmic frequency-response characteristic curve. Amplitude-frequency characteristic: A dB, 4, 2, 0, -2, -4, -10, f (Hz) 0.02, 0.04, 0.06; solid line for during needling, dashed line for before needling. Phase-frequency characteristic: φ (degrees), f (Hz) 0.02, 0.04, 0.06, -30, -60, -90, -120, -150.
Translated labels: Amplitude characteristic; Phase characteristic; A dB; f (Hz); φ (degrees); During needle; Before needle
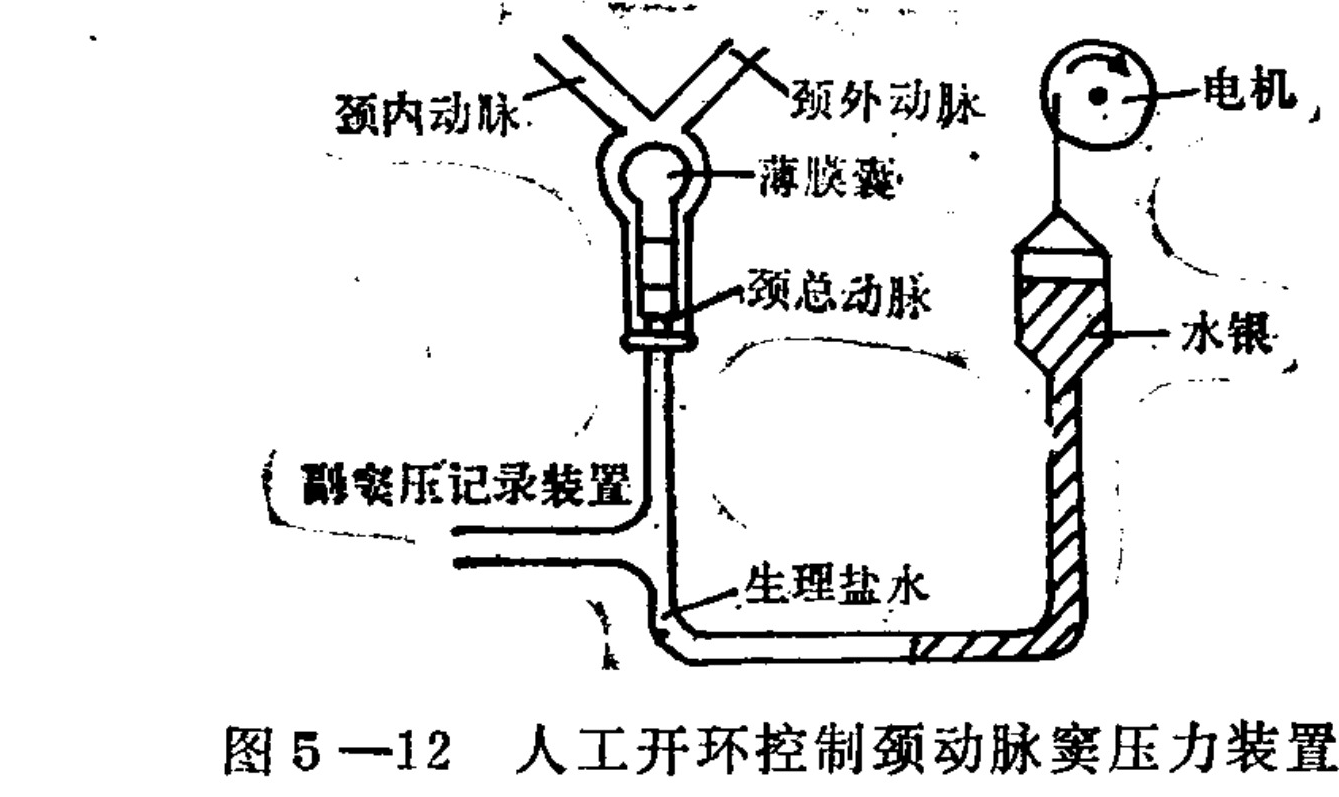
Figure 5-12. Artificial open-loop control device for carotid sinus pressure.
Translated labels: Internal carotid artery; External carotid artery; Thin-film sac; Common carotid artery; Motor; Mercury; Physiological saline; Sinus pressure recording device
logarithmic frequency response obtained in one experiment. In 10 experiments, 8 showed an increase in frequency-response bandwidth after acupuncture and a decrease in phase shift, indicating that the response speed of this feedback loop had increased and its stability had improved to some extent. The parameters of the transfer function, calculated separately from 5 cases, were as follows: W(s) = K / (T²s² + 2ξTs + 1). The mean time constant T decreased from 4.412 before acupuncture to 3.595 during acupuncture, while the damping coefficient ξ increased from 0.409 to 0.433, reflecting an improvement in the dynamic characteristics of this loop. Through the carotid-sinus open-loop frequency-characteristic experiment, we may conclude that the effect of acupuncture on the blood-pressure regulation system was mediated, at least in part, through the carotid-sinus pressure feedback loop.
3. Model and Simulation of the Entire Circulatory System
It was mentioned earlier that at least nine feedback systems control blood pressure. Each feedback loop has its own operating pressure range and a different response speed: some loops respond within several tens of seconds, while others take several hours to several days. These systems coordinate with one another to provide complete and effective control of the circulatory system as a whole. A mathematical model of this complex circulatory system has already been established. The model contains approximately 400 equations, most of them nonlinear functional relationships, and 38 integrating elements. The dynamic processes of the various variables differ greatly in speed, with time scales ranging from fractions of a second to several weeks. Such a complex model can no longer yield quantitative results by analytical methods. Therefore, an electronic computer was used to simulate this mathematical model, and the model system was used to study the dynamic responses of the circulatory system under different conditions. This produced many quantitative results concerning the dynamics of the circulatory system. For example, with respect to long-term regulation, it confirmed that the renal–body-fluid system occupies the leading position.
Because the entire system is too large, here we show only the principal components related to the renal–body-fluid regulatory system, in Figure 5–14. In this system, the key components are the kidneys and blood vessels. The rate of urine excretion is closely related to blood pressure. Under normal conditions, a small change in blood pressure causes a large change in the urine-excretion rate. For example, a slight rise in blood pressure causes urine excretion to increase markedly, thereby producing a significant reduction in the volume of extravascular fluid. Because the blood vessels automatically regulate the fluid inside and outside them in order to maintain the relative balance of water, a change in extravascular-fluid volume will affect the total blood
The quantity of blood. Total blood volume, together with the mean systemic pressure, right atrial pressure, venous resistance, and so on, jointly determines cardiac output. Blood pressure is P = Q·R; Q is cardiac output, and together with total peripheral resistance it determines blood pressure. Total peripheral resistance, however, is also regulated by other feedback loops (not shown in the figure), thereby forming a closed-loop system with an integral element. The integration occurs because the change in extracellular fluid volume is the integral of the urine output. Because an integral element is present, the closed-loop system has no steady-state error; that is, blood pressure does not exhibit a long-term deviation (provided that the relationship between renal blood pressure and urine output remains unchanged). On this basis, some people have argued that hypertension is caused by a malfunction of this system. That is, regardless of the cause of hypertension, it must ultimately manifest itself
The long-term blood-pressure regulation diagram shows blood pressure acting on kidney function, which determines urine output. Water intake and urine output enter a summing point; the difference is integrated to obtain extravascular fluid. This acts through the blood-vessel relation to determine blood volume and then mean systemic blood pressure. Mean systemic blood pressure and right atrial pressure, together with venous resistance, determine cardiac output. Cardiac output combines with total peripheral resistance to determine blood pressure, closing the feedback loop.
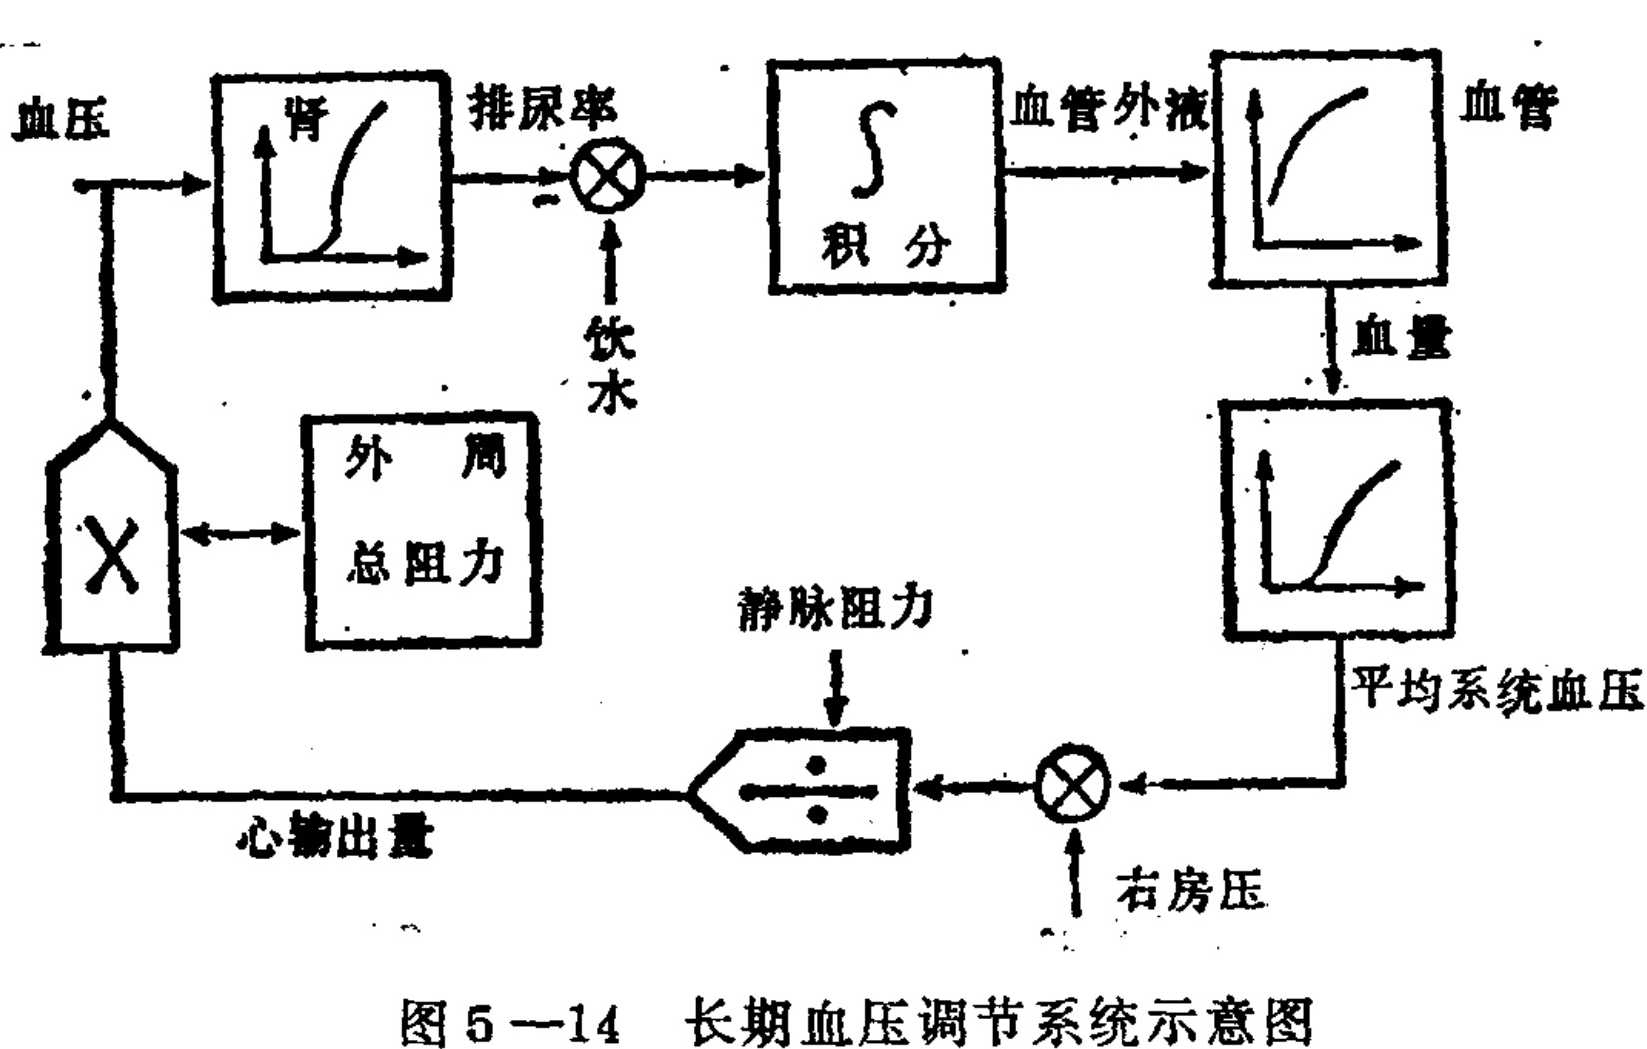
Figure 5-14. Schematic diagram of the long-term blood-pressure regulation system
Translated labels: Blood Pressure; Kidney; Urine Rate; Water Intake; Integration; Extracellular Fluid; Blood Vessels; Blood Volume; Mean Systemic Filling Pressure; Venous Resistance; Right Atrial Pressure; Cardiac Output; Total Peripheral Resistance
as a change in renal function. On the basis of repeated validation through animal experiments, the parameters of the entire circulatory-system model were established. A computer simulation was carried out on a model containing 400 equations. Since parameters can easily be changed on a computer, computer simulation can readily be used on the basis of the model to study physiological response processes under different conditions in living organisms and to obtain dynamic data for the corresponding conditions. For example, simulation was used to model removal of two-thirds of the kidneys, and the changes in animal blood pressure, cardiac output, and blood volume are shown in Figure 5-15. It can be seen that blood pressure rises, while cardiac output and total blood volume increase in the short term and then return to normal. On this basis, a simulation was also performed in which salt intake was increased 2½-fold after kidney removal, causing the circulatory-system parameters to change. In this case, blood pressure rose markedly, while cardiac output and total blood volume also changed markedly for a short time and then increased slightly. The simulated results were consistent with the results of actual animal experiments, showing that, after a model has been established, mathematical simulation can yield many meaningful results in complex biological systems. The simulation experiments above also helped clarify the roles of renal function and excessive salt intake in the formation and development of hypertension.
Figure labels: “normal”; “1/3 kidney function”; “then add 2 1/2 times the salt intake”; blood pressure (mmHg): 200, 150, 100; cardiac output (L/min): 6.0, 5.0; blood volume (L): 6.0, 5.0; 0 8 16 24 32 40 (days)
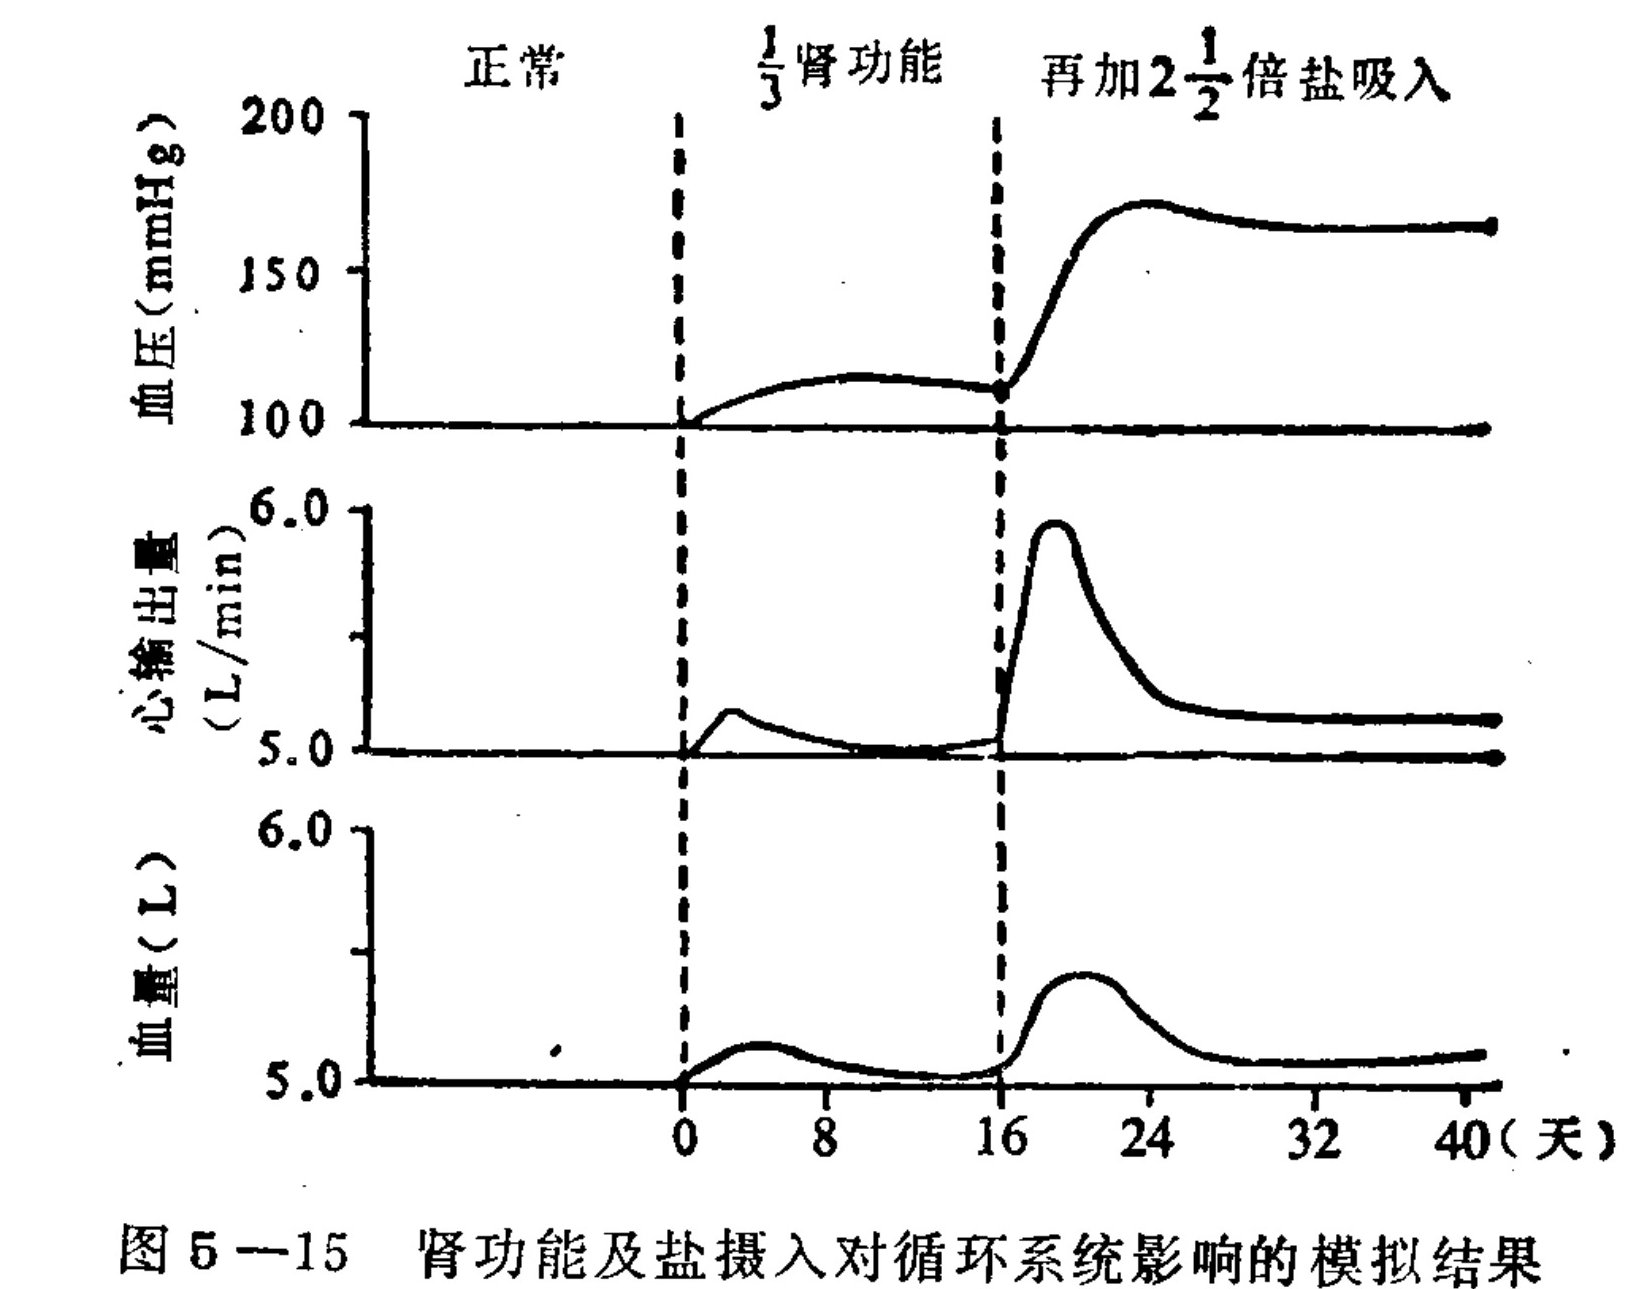
Figure 5-15. Simulated results of the effects of renal function and salt intake on the circulatory system
Translated labels: Blood Pressure (mmHg); Cardiac Output (L/min); Blood Volume (L); Normal; 1/3 Renal Function; Plus 2 1/2 times salt intake; Days
IV. The Effects of Qigong on the Circulatory System
Chapter Two discussed how qigong changes the function of the autonomic nervous system. Many parts of the cardiovascular system, such as the heart and blood vessels, are governed by the autonomic nerves; therefore, qigong training must affect the function of the circulatory system. The effects of qigong on the circulatory system are multifaceted, but so far only some of them have been observed and tested. Outside China, tests have been conducted on the heart rate, cardiac output, systolic and diastolic arterial pressure, fingertip blood volume, and other effects caused by TM practice. For example, an electrocardiograph was used to record changes in the heart rate of 11 healthy people during practice, producing the results shown in Figure 5-16. It can be seen that during practice the heart rate falls by an average of about 5 beats per minute, and rises again to some extent after practice stops. The course of this change is consistent with the decreases in oxygen consumption and basal metabolism. Cardiac output was measured by the dye-dilution method. The changes in cardiac output during practice were tested in five TM practitioners; the results are shown in Figure 5-17. During practice, cardiac output fell by an average of 23.7%; 15 minutes after practice stopped, cardiac
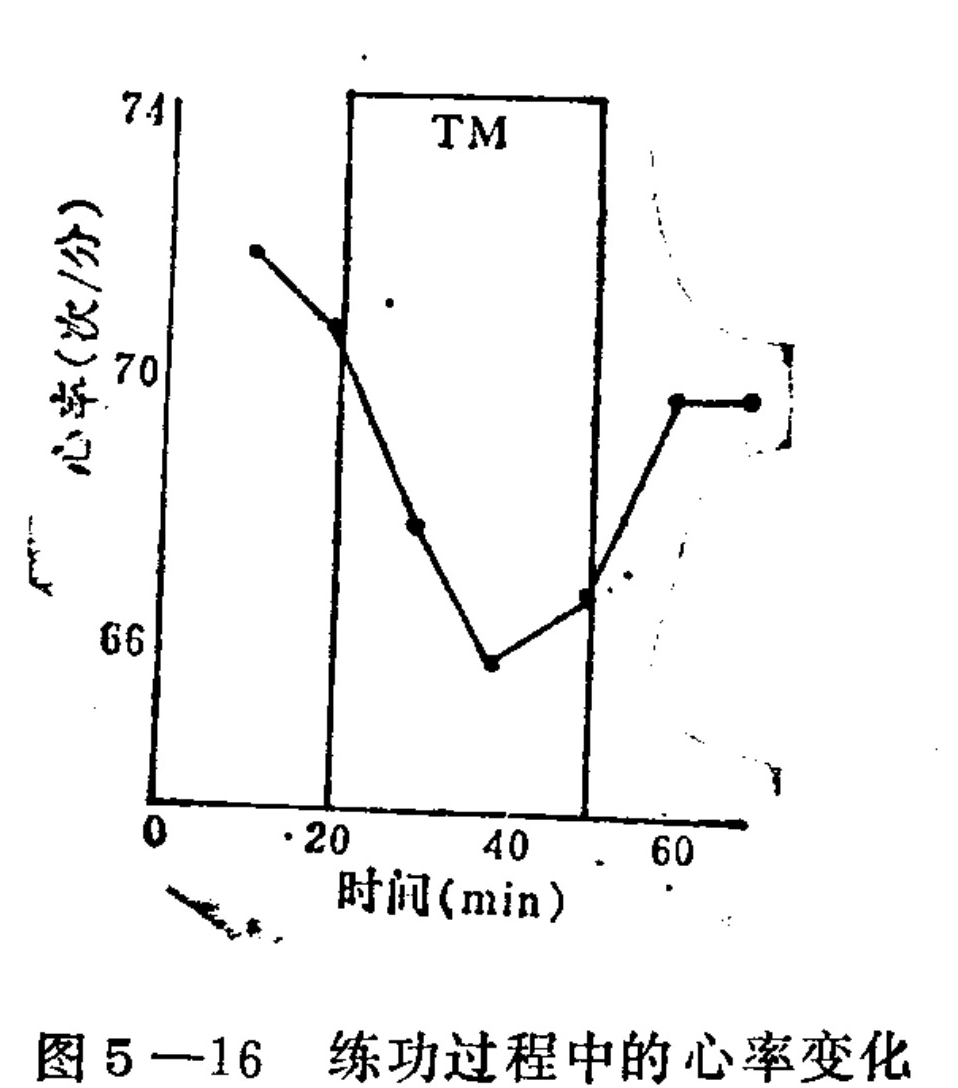
Figure 5-16 plots heart rate in beats per minute against time in minutes. The vertical scale marks 66, 70, and 74 beats per minute; the horizontal scale marks 0, 20, 40, and 60 minutes. The TM practice interval extends from approximately 20 to 50 minutes. The plotted heart rate falls from about 71 before practice to about 66 near 40 minutes, then rises to just under 70 after practice.
Translated labels: Heart rate (beats/min); Time (min); TM
Figure 5-16. Changes in heart rate during practice
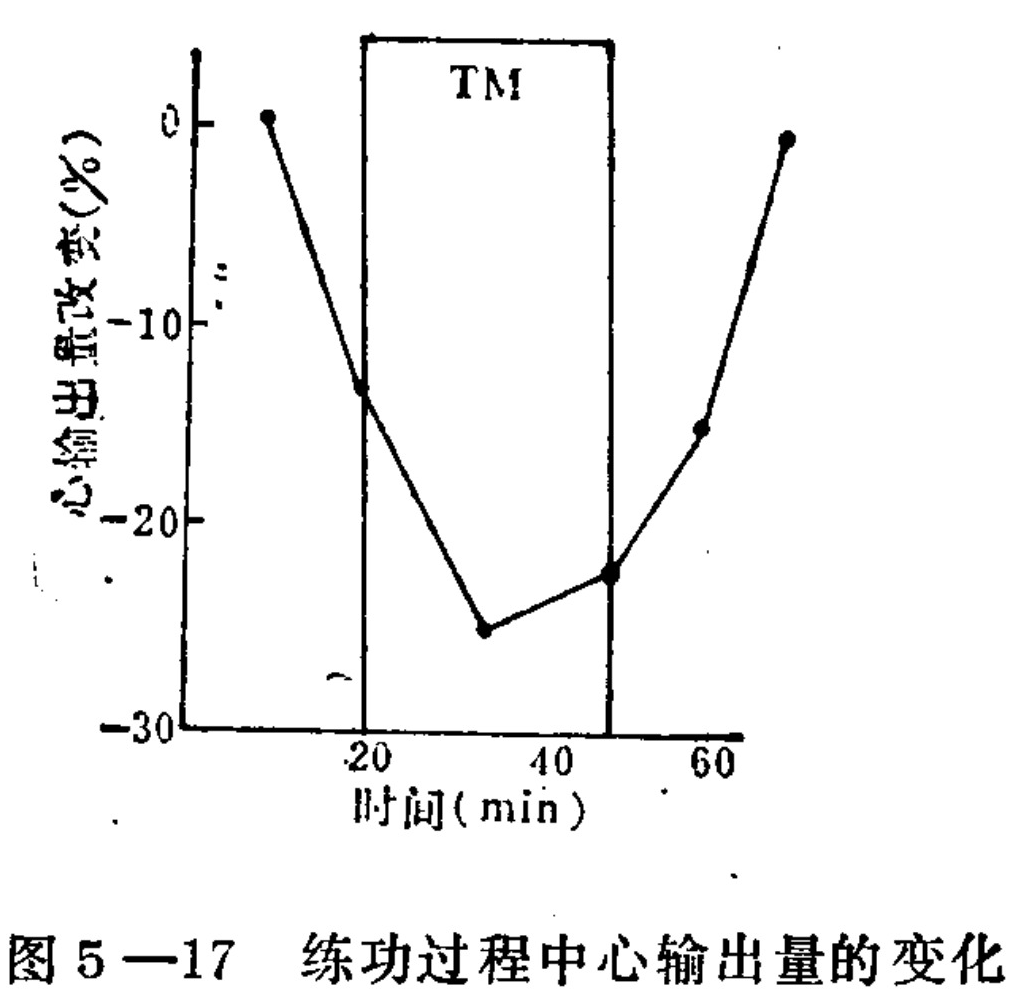
Figure 5-17 plots change in cardiac output, in percent, against time in minutes. The vertical scale marks 0, −10, −20, and −30 percent; the horizontal scale marks 20, 40, and 60 minutes. The TM practice interval extends from approximately 20 to 50 minutes. The plotted change falls from near 0 before practice to approximately −25 percent during practice, then rises toward 0 after practice.
Translated labels: Percentage change in cardiac output (%); Time (min); TM
Figure 5-17. Changes in cardiac output during practice
output was still approximately 15% lower.
The brain is the organ with the highest metabolic rate in the human body, and cerebral blood flow occupies an important position in the circulatory system.
Liu Yuanliang and others observed the effects of qigong on the characteristics of cerebral blood flow and obtained some meaningful results. The experiment was conducted among patients. The patients (with different diseases) were randomly divided into two groups: the qigong-training group consisted of 72 people, with an average age of 49.6 years; the control group consisted of 27 people, with an average age of 46.9 years. The qigong group practiced the Daoyin Tuna method for 4–5 hours every day. Cerebral blood flow was measured by the impedance method. The probe electrodes were placed on the left and right forehead and on the left and right sides of the occipital protuberance; the reference electrodes were placed at the left and right mastoid processes. Amplitude was used as the characteristic parameter to represent cerebral blood flow. Its reference value was between 0.10 and 0.18 ohms. A value below 0.10 ohms indicated insufficient cerebral blood flow; above 0.18 it was considered relatively high. According to this standard, the patients in each group were further divided into a normal-amplitude group, a low-amplitude group, and a high-amplitude group. Cerebral blood flow was measured in the qigong group before training and after three months of training; the control group was tested on admission and at discharge, with an average interval of 88 days. The measured results are listed in Table 5-2.
The table shows that, for normal people (with normal cerebral blood flow), qigong did not cause a change in blood-flow volume (P > 0.05). Qigong improved cerebral-blood-flow supply and this improvement was bidirectional: it increased blood flow in people whose cerebral blood flow was low, while reducing it in people whose cerebral blood flow was high. This suggests that qigong acts by improving the function of the body’s regulatory systems, bringing the body into an optimal state, rather than, like ordinary drugs, simply increasing or decreasing blood flow in one direction.
Table 5-2. Effects of qigong on the amplitude of the cerebral rheogram (10⁻²)ᵃ
| Group | Measurement | Left forehead–mastoid | Right forehead–mastoid | Left occiput–mastoid | Right occiput–mastoid |
|---|---|---|---|---|---|
| Amplitude below normal — qigong group | Before training | 7.13 ± 1.64 | 7.65 ± 1.50 | 6.61 ± 1.70 | 6.72 ± 1.68 |
| Amplitude below normal — qigong group | After training | 9.38 ± 2.29* | 9.72 ± 2.42* | 8.52 ± 2.29* | 8.78 ± 2.59* |
| Normal amplitude — qigong group | Before training | 11.80 ± 1.78 | 12.45 ± 1.97 | 11.23 ± 1.07 | 12.05 ± 1.39 |
| Normal amplitude — qigong group | After training | 12.12 ± 1.59 | 13.22 ± 2.20 | 11.95 ± 2.48 | 12.27 ± 2.78 |
| Amplitude above normal — qigong group | Before training | 21.14 ± 3.44 | 20.43 ± 2.57 | 20.66 ± 3.01 | 24.00 ± 6.68 |
| Amplitude above normal — qigong group | After training | 16.00 ± 2.89* | 15.71 ± 2.93* | 17.00 ± 4.47** | 16.00 ± 4.08* |
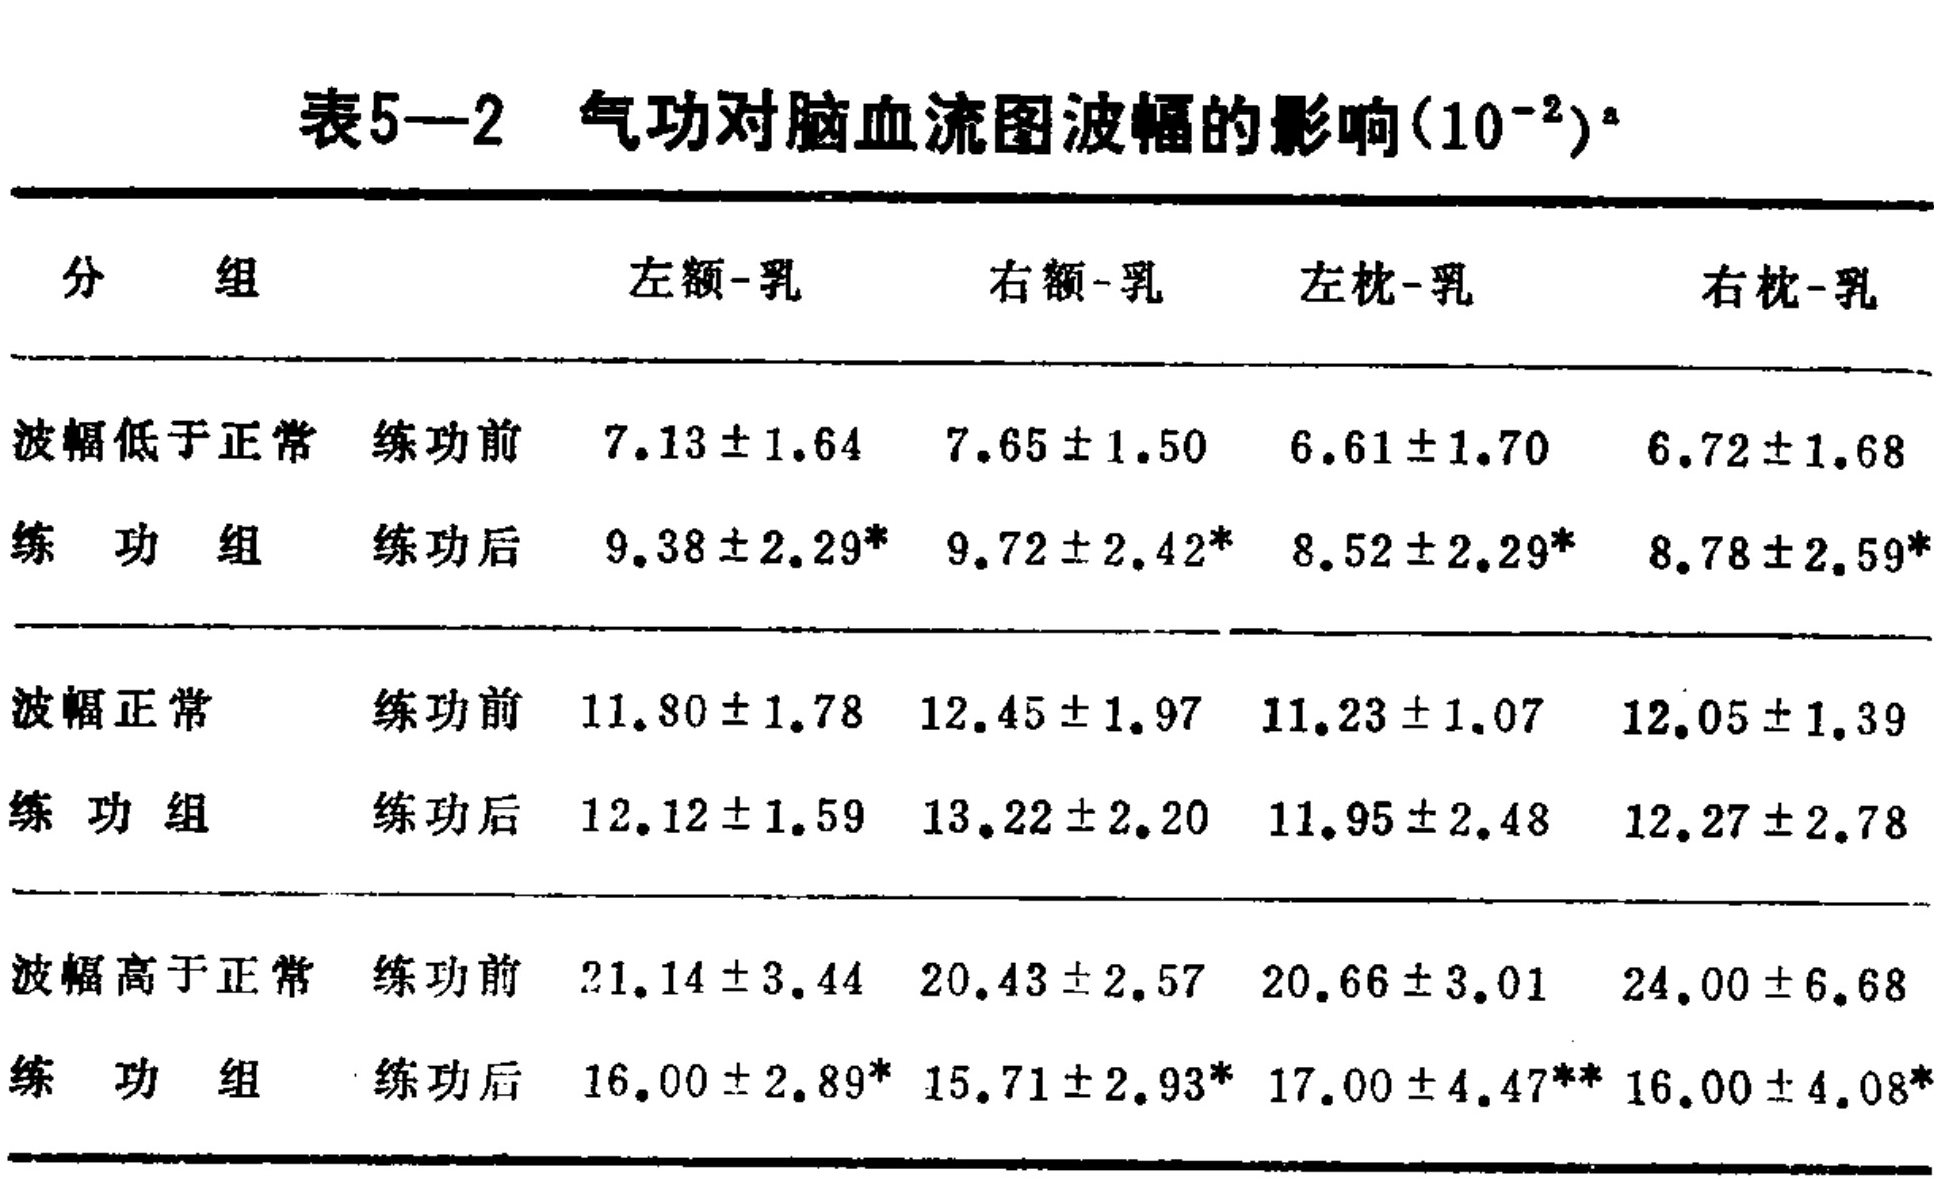
Table 5-2: The effect of Qigong on the amplitude of electroencephalogram waves (10^-2).
Translated labels: Group; Left Frontal-Mammary; Right Frontal-Mammary; Left Occipital-Mammary; Right Occipital-Mammary; Wave amplitude below normal Qigong group; Before practice; After practice; Wave amplitude normal Qigong group; Wave amplitude above normal Qigong group
| Group | Status | Left frontal–mastoid | Right frontal–mastoid | Left occipital–mastoid | Right occipital–mastoid |
|---|---|---|---|---|---|
| Amplitude below normal | Admission | 7.67±1.23 | 7.93±1.16 | 7.08±1.50 | 7.33±1.56 |
| Control group | Discharge | 8.00±1.25 | 8.20±1.37 | 7.01±1.44 | 7.58±1.98 |
| Amplitude normal | Admission | 11.83±1.49 | 12.67±1.72 | 12.60±1.80 | 13.73±3.13 |
| Control group | Discharge | 11.92±1.83 | 12.33±2.10 | 12.33±2.06 | 13.86±3.09 |
*P<0.01; **P<0.02; a: the numbers in the table are x̄±s.
Sun Fuli and others observed the effect of qigong on respiratory sinus arrhythmia. Respiratory sinus arrhythmia means that the instantaneous heart rate undergoes periodic changes with respiration. The amplitude of this periodic fluctuation gradually decreases as age increases. Research indicates that at approximately 65–70 years of age, this amplitude decreases to zero. The cause of respiratory sinus arrhythmia is not yet entirely clear. It may be the result of afferent signals from many receptors in the heart, lungs, and chest wall being integrated and coordinated through the central nervous system. In analyzing changes during aging, some people have argued that coordination among organs declines more quickly than the aging of the organs themselves. The decrease in the amplitude of respiratory sinus arrhythmia may reflect a gradual weakening of the coordination among the body’s organ systems, and this decrease may become a sign of the onset of aging.
Because respiratory sinus arrhythmia is more apparent during slow breathing, the experiment specified one inhalation for every six heartbeats and one exhalation for every six heartbeats; twelve heartbeats constituted one respiratory cycle, and the breathing rate was adjusted accordingly. The instantaneous heart rate during this process was recorded, and the resulting waveforms were processed. The amplitude of the fundamental wave of the periodic fluctuation was divided by the mean heart rate and used as the variable X. X varies with age. The relationship between X and age Y was fitted by the least-squares method to obtain the parameters of its linear regression equation. The experimental group (people well trained in qigong) and the control group (normal people who had not practiced qigong) were processed separately, yielding the following linear regression equations:
Experimental group: X = 17.23 − 0.210Y
Control group: X = 19.75 − 0.316Y
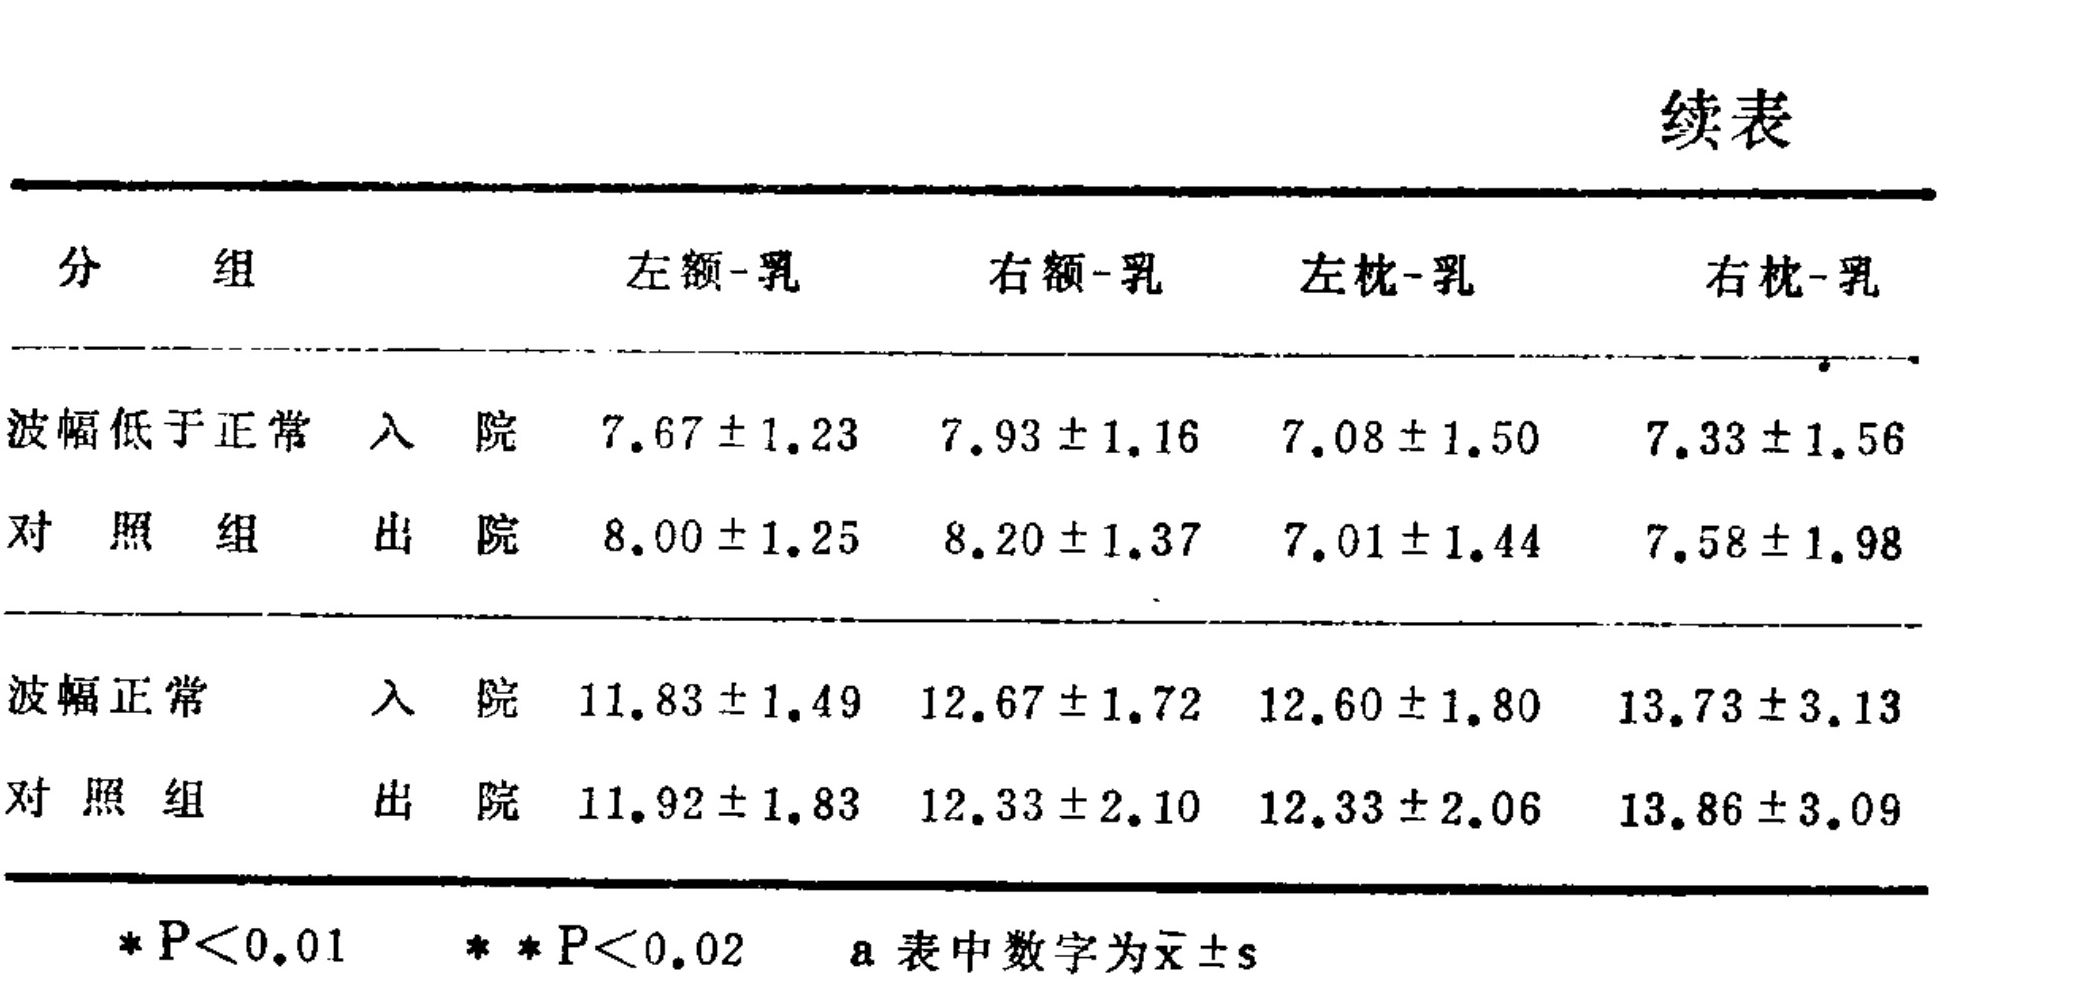
Continued table
Translated labels: Continued Table; Group; Left Frontal-Mammary; Right Frontal-Mammary; Left Occipital-Mammary; Right Occipital-Mammary; Amplitude below normal control group; Admission; Discharge; Normal amplitude control group; * P<0.01; ** P<0.02; a Numbers in the table are x̄ ± s
Statistical analysis showed that the difference between the two was significant (P<0.01). If the expected lifespan is calculated from the regression equations (the age value when X = 0), then for the control group Y₁ = 62.5, and for the experimental group Y₂ = 81.1 years. This result suggests that long-term qigong training has the effect of delaying the aging process.
Hypertension is the most common cardiovascular disease, and the use of qigong to treat hypertension has achieved some results. For example, Beijing Second Hospital and the Institute of Epidemiology of the Chinese Academy of Medical Sciences once used epidemiological methods to observe qigong’s therapeutic effect on hypertension. Compared with the control group, people who persisted in qigong practice for three months showed decreases in systolic pressure, diastolic pressure, and mean pressure, with statistically significant differences (P<0.05). However, three months after they stopped practicing, their blood pressure rose again; compared with the control group, the difference was no longer significant. In addition, whether patients could persist in practicing and how skilled they were in the techniques had a clear influence on the therapeutic effect. This indicates that qigong has a clear influence on cardiovascular function.
One important factor in hypertension is prolonged stimulation from tension. Qigong may reduce the harm caused by tense stimulation to the organism, lowering the level of tension in the central nervous system—especially in the sympathetic nervous system—and thereby benefiting the stability of blood pressure.
Chapter Six: Body-Temperature Regulation and Qigong
The body-temperature regulation system was formed during the course of evolution. Lower animals do not have a body-temperature regulation system; their body temperature changes with the environment. When the Earth’s climate became colder, these animals could be eliminated. For example, at the end of the Mesozoic Era, when the temperature became colder, most reptiles were unable to adapt to this environmental change and became extinct. Birds and mammals, however, developed body-temperature regulation systems that enabled them to withstand cold climates, and consequently they replaced reptiles in the struggle for survival.
A constant body temperature is important to the survival and development of living organisms. The life activities of an organism are related to the proteins in its body, especially the activity of enzymes; all biochemical reactions in the body take place under the catalysis of various enzymes. Enzyme activity changes with temperature. When body temperature is too low, enzyme activity is low, biochemical reactions are slow, and the organism’s growth and development are also slow. When the temperature is too high, however, proteins become denatured and may even coagulate. Mammals generally die at temperatures above 42°C. Maintaining body temperature at an appropriate level keeps the organism’s metabolism generally at a relatively high level and benefits its survival and development. Therefore, body temperature is an important factor determining the overall activity capacity of the organism. Normal operation of the body-temperature regulation system is an important guarantee of healthy development.
Qigong is a process in which self-awareness activity puts the organism into a certain advantageous state. Therefore, qigong training will cause changes in the body-temperature regulation system and, through its influence on that system, improve certain functions of the organism. In this chapter we will discuss the mechanisms of body-temperature regulation, models of body-temperature regulation, and the influence of the qigong process on the body-temperature regulation system, among other issues.
1. Regulation of Body Temperature
Human body temperature (core temperature) is quite stable, usually remaining around 37°C. When the deviation in body temperature exceeds plus or minus 0.5°C, the person is considered ill; if the deviation exceeds 5°C, death is imminent.
At 5°C, death will be imminent. In order for the body’s various biochemical reactions to proceed with high efficiency, humans need a body-temperature regulation system that keeps body temperature relatively stable. A naked human being can maintain approximately the same body temperature at an ambient temperature of 12–15°C or as high as 67°C. This shows that the human body’s temperature-regulation system is a quite well-developed automatic regulation system.
The human body is composed of matter. Like all matter, it has a certain heat capacity, and the amount of heat it can store is proportional to its temperature. At the same time, when the organism carries out metabolic activity, heat is always produced. Thus, the human body is producing heat at every moment, and the amount of heat produced is related to the organism’s activity. On the other hand, the human body exchanges heat with the environment through its surface and can dissipate or absorb heat through convection, radiation, conduction, evaporation, and other means. Generally speaking, when the environmental temperature is lower than body temperature, the human body mainly dissipates heat through its surface, and the amount of heat dissipated is related to the environmental temperature. Maintaining human body temperature depends on a dynamic balance between heat production inside the body and heat dissipation. The task of the body-temperature regulation system is, under conditions in which environmental temperature and the intensity of bodily activity differ and the amounts of heat production and dissipation constantly change, to maintain the balance between them. Body temperature is an important internal environment of the human body. Like other internal-environment regulatory mechanisms, the body-temperature regulation system is an automatic negative-feedback control system.
In the body-temperature regulation system, the organism serving as the controlled object is first of all an object with a certain heat capacity and a certain heat-conduction coefficient. According to the requirements of the problem we want to solve, the human body can be divided into several parts. The simplest approach is to regard the entire human body as a uniform object with only one heat capacity and one heat-conduction coefficient. In reality, different parts of the organism have different heat capacities and heat-conduction coefficients. Therefore, average specific heat capacity and heat-conduction coefficient values are used to replace the actual values. The human body can also be divided into several parts according to differences in specific heat capacity and conduction coefficient. For example, the human body can be divided into six blocks, namely the head, trunk, upper limbs, lower limbs, hands, and feet, as shown in Figure 6-1. Each part is further divided into four layers: muscle, fat, core, and skin; together with the blood compartment, this gives a total of 25 blocks. Each block can be regarded as having the same specific heat capacity and heat-conduction coefficient. This division is already comparatively close to the actual situation.
Whether body temperature rises or falls depends on the relationship between heat production and heat dissipation inside the body. Therefore, the organism’s various heat-producing and heat-dissipating links should be analyzed. When the organism carries out vital activities, all its energy depends on what it takes in from food. The energy in food
Before it is converted into ATP, the energy source available for biochemical reactions, 55% has already become heat. Apart from muscle contraction, which can perform external work, almost all energy ultimately becomes heat. The rate of heat production in the human body differs under different conditions: after entering sleep, it is only about 50 kilocalories per hour; during slow walking, 150 kilocalories per hour; and during heavy physical labor, it can reach 450 kilocalories per hour. Thus, the rate of heat production can vary across a wide range. The body’s heat dissipation is mainly carried out through physical processes such as radiation and conduction through the skin, convection of air, and evaporation of sweat. About 90% of the body’s heat is dissipated through the skin. A small amount of heat is lost through breathing, urination, and defecation.
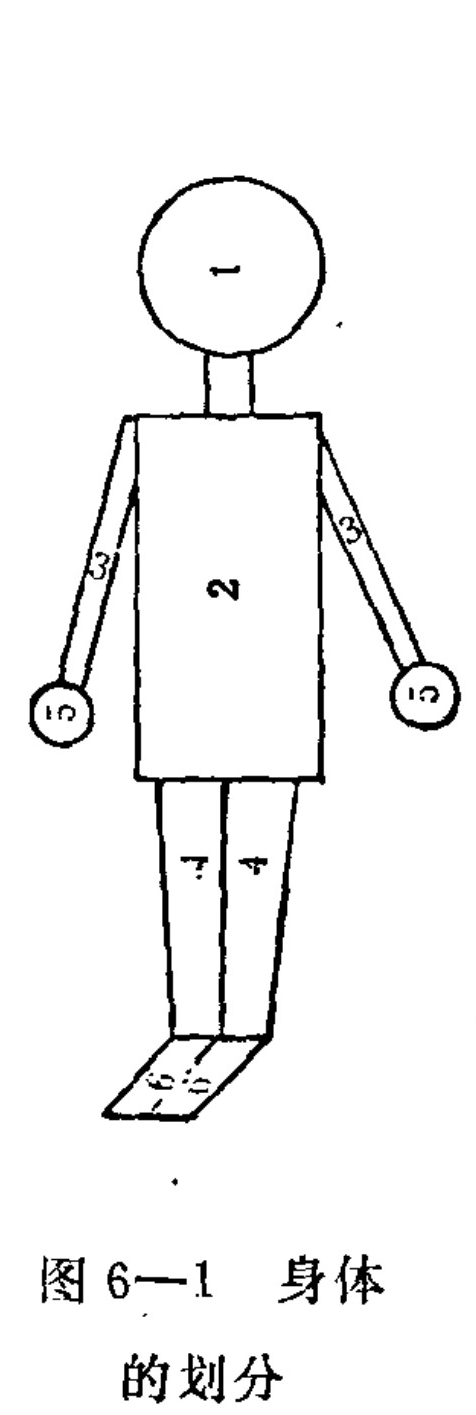
Figure 6-1: Division of the body
Translated labels: head; torso; upper arm; lower leg; hand
Except at absolute zero, all objects in the universe emit infrared radiation. About 40% of the body’s heat is lost by emitting infrared rays toward its surroundings. The amount of radiative heat loss depends on the difference between body-surface temperature and environmental temperature. Even a slight change in skin temperature can produce a large change in radiative heat loss. Conductive and convective heat loss through contact with objects outside the body likewise depends on the temperature difference. When the environmental temperature is higher than skin temperature, evaporation is the body’s only means of dissipating heat.
Evaporation includes insensible evaporation and sweating. Insensible evaporation occurs when interstitial fluid reaches the surface of the skin or the surface of the pulmonary alveoli and evaporates. In a healthy person, this evaporation is approximately 1,000 milliliters per day. It is not controlled by thermoregulation, but it can vary with the body’s activity and environmental temperature. Normally, when body temperature rises by 1°C, insensible evaporation increases by 15%. Sweating is an important means by which the human body adapts to a hot environment: sweat glands secrete sweat, whose extensive evaporation lowers body temperature. Sweat glands operate under nervous regulation. All forms of heat dissipation are strongly influenced by environmental temperature, and environmental temperature varies greatly with region, season, working conditions, and other factors. Therefore, the human body must possess adjustable means of producing and dissipating heat in order to maintain relatively stable body temperature.
The body’s adjustable means of heat dissipation include vasodilation and vasoconstriction. Vasodilation in the skin increases skin blood flow, accelerating the transfer of heat to the body surface; faster breathing expels heat from the body through exhalation; and sweat glands release sweat, which dissipates heat through evaporation. When the environmental temperature is too low, in addition to automatically constricting the skin’s blood vessels to reduce heat loss, the body can increase heat production—for example, by increasing adrenal-gland secretion, accelerating the body’s overall metabolic processes and thereby increasing heat production, and by producing heat through skeletal-muscle activity in the form of shivering.
These controlled processes of heat production and heat dissipation take place under the unified direction of the thermoregulatory center. To maintain body temperature correctly, the thermoregulatory center must receive information about body temperature. Temperature receptors are distributed throughout the skin and in some mucous membranes. Nerve endings connect with the temperature receptors and transmit information about temperature changes into the central nervous system. According to their functions, temperature receptors can be divided into warm receptors and cold receptors. When body temperature rises, the former increase their discharge of nerve impulses; the latter do the opposite, increasing their discharge when body temperature falls. Information from the warm and cold receptors is sent not only to the body’s thermoregulatory center but also enters consciousness and produces sensations. When human skin temperature is below 30°C, it produces a sensation of cold; at around 35°C, it produces a sensation of warmth.
In addition, the hypothalamus, the reticular formation of the brainstem, the spinal cord, and other neural regions contain neurons sensitive to temperature, called central temperature receptors. Some of these central temperature receptors increase their impulse-discharge frequency when temperature rises; they are called warm-sensitive neurons. Others increase their discharge frequency when temperature falls; they are called cold-sensitive neurons. Warm-sensitive neurons are found mainly in the anterior hypothalamus and preoptic area. Cold-sensitive neurons are found mainly in the reticular formation of the brainstem, although a small number are also present in the hypothalamus.
When the lower part of the animal’s hypothalamus is severed, disconnecting the hypothalamus and the structures above it from the rest of the body, the animal can no longer maintain a constant body temperature. If the cerebrum is removed at the level above the diencephalon, however, body temperature can basically remain stable. This demonstrates that the thermoregulatory center is located in the hypothalamus. Neurophysiological experiments show that excitation of the posterior hypothalamus can increase skeletal-muscle tone and thus increase heat production. Excitation of the anterior hypothalamus can increase sweat-gland secretion and dilate the skin’s blood vessels, while inhibiting the posterior hypothalamus. The anterior hypothalamus is where the central temperature receptors are located, whereas the posterior hypothalamus may be the center that integrates information about body temperature. It coordinates nerve impulses and, according to the body’s specific circumstances, integrates and regulates body temperature. However, precisely how the posterior hypothalamus performs this function is still poorly understood.
From the foregoing, the thermoregulatory system can be represented by Figure 6-2. When environmental temperature falls, heat dissipation from the body increases and body temperature tends to fall. This information is fed back from the receptors to the thermoregulatory center. Through neural and humoral actions, the thermoregulatory center causes the skin’s blood vessels to
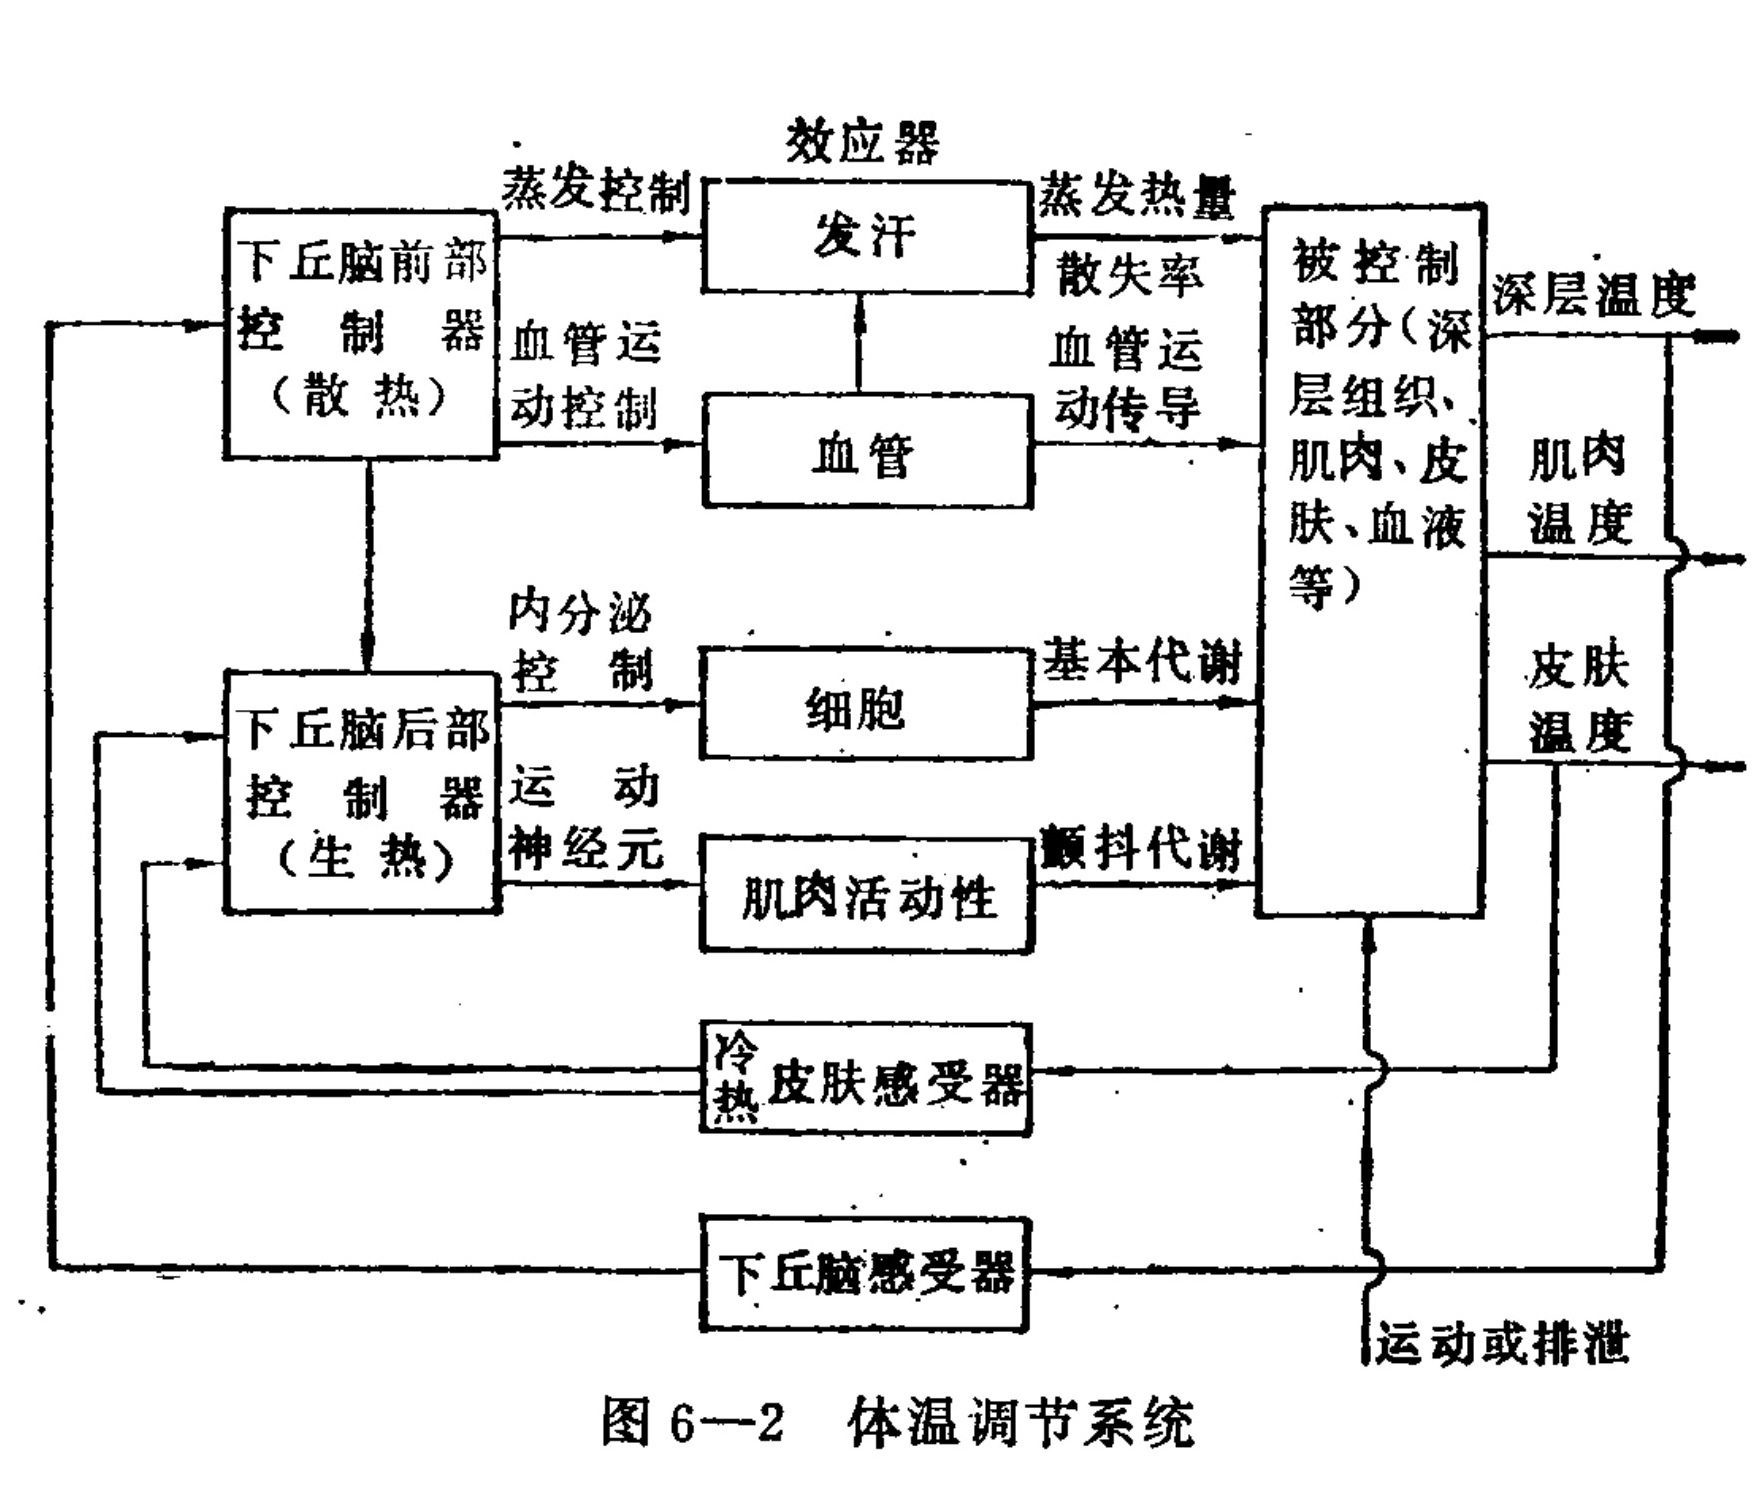
Figure 6-2. Thermoregulatory system. The diagram includes: Effector; evaporation control; sweat glands; evaporative heat; dissipation rate; anterior hypothalamus; controller (heat dissipation); vasomotor control; blood vessels; vasomotor conduction; controlled parts (deep tissues, muscles, skin, blood, etc.); deep temperature; muscle temperature; skin temperature; endocrine control; cells; basal metabolism; posterior hypothalamus; controller (heat production); motor neurons; muscle activity; shivering metabolism; cold; heat; skin receptors; hypothalamic receptors; movement or excretion.
Translated labels: Anterior hypothalamus controller (cooling); Posterior hypothalamus controller (heating); Effectors; Sweating; Blood vessels; Cells; Muscle activity; Controlled part (deep tissues, muscles, skin, blood, etc.); Deep temperature; Muscle temperature; Skin temperature; Cold/Hot Skin receptors; Hypothalamic receptor; Evaporation control; Vasomotor control; Endocrine control; Motor neurons
constrict, reducing heat conduction from the interior of the body to the surface and thereby reducing heat loss. On the other hand, through excitation of the sympathetic nerves, the release of adrenaline and noradrenaline increases, accelerating cellular metabolism and producing more heat. When necessary, it can also cause the muscles to produce heat through shivering, thereby increasing heat production. In this way, the balance between heat dissipation and heat production is maintained and body temperature remains unchanged.
Conversely, when environmental temperature rises and heat dissipation from the body surface becomes difficult, or when internal heat production increases for reasons such as physical work, body temperature rises. This information is transmitted to the thermoregulatory center. Under the control of that center, the body dilates the skin’s blood vessels, accelerating the transfer of core heat to the body surface, raising surface temperature and accelerating heat dissipation. It can also open the sweat glands and dissipate heat through evaporation of sweat.
Why can the body maintain its temperature at around 37°C without fluctuating, or at some other value? It may be supposed that, like an ordinary feedback-control system, the thermoregulatory system has a setpoint in the hypothalamus. The hypothalamus is the key structure in human thermoregulation; its simplified structure is shown in Figure 6-3. Small changes in head temperature can cause marked changes in heat production and heat dissipation. Figure 6-4 shows the relationship between head temperature and the body’s heat production and heat dissipation.
When temperature deviates from 37°C, the rates of heat production and heat dissipation change markedly. In the anterior hypothalamus, within the preoptic area, when the temperature of the blood flowing through it rises, the discharge of temperature-sensitive neurons increases (or decreases). When blood temperature increases by 1.0°C, their discharge frequency can increase tenfold. They act as sensitive feedback elements. Physiologists, however, have not yet found in the body a mechanism analogous to the setpoint mechanism in an engineering feedback system, by which the set value of a controlled variable can be adjusted. Therefore, the question of whether a setpoint exists in biological regulatory systems remains controversial.
For the thermoregulatory system, some researchers have proposed that the setpoint is determined by the intersection of the nonlinear characteristics of two feedback signals. One hypothesis is that the intersection of the characteristic curves of the warm and cold receptors is the set value. Cats also have two types of temperature receptors, and their relationship between discharge frequency and temperature is shown in Figure 6-5. The figure contains four curves, respectively reflecting the characteristics of the two types of receptors in the skin and the viscera. Their intersection can be seen to lie at around 37°C. This point happens to be the value of normal body temperature, so there is some basis for using the intersection to determine the set value.
However, the human cold receptors produce almost no output at temperatures above 33°C. Therefore, human body temperature is unlikely to be explained by the intersection of the characteristic curves of the two types of receptors. We believe that, although an organism need not necessarily have a setpoint mechanism like that of an engineering system, it can possess a mechanism equivalent to a setpoint. For example, the threshold characteristics of temperature-sensitive neurons in the hypothalamus may be equivalent to a setpoint. Figure 6-4 shows that 37°C is the turning point of the heat-production and heat-dissipation functions, indirectly reflecting that the excitation threshold of these neurons is around 37°C. When a person develops a fever while ill
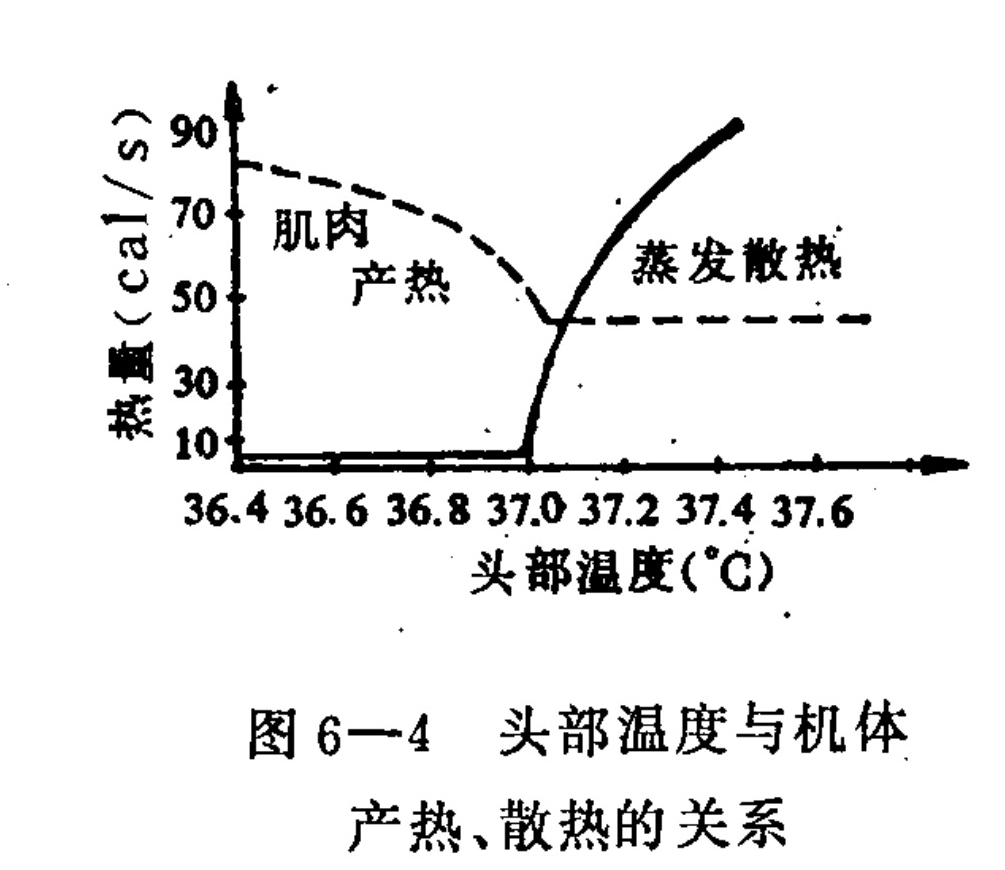
Figure 6-4. The relationship between head temperature and the body’s heat production and dissipation.
Translated labels: Heat (cal/s); Head Temperature (°C); Muscle Heat Production; Evaporative Cooling
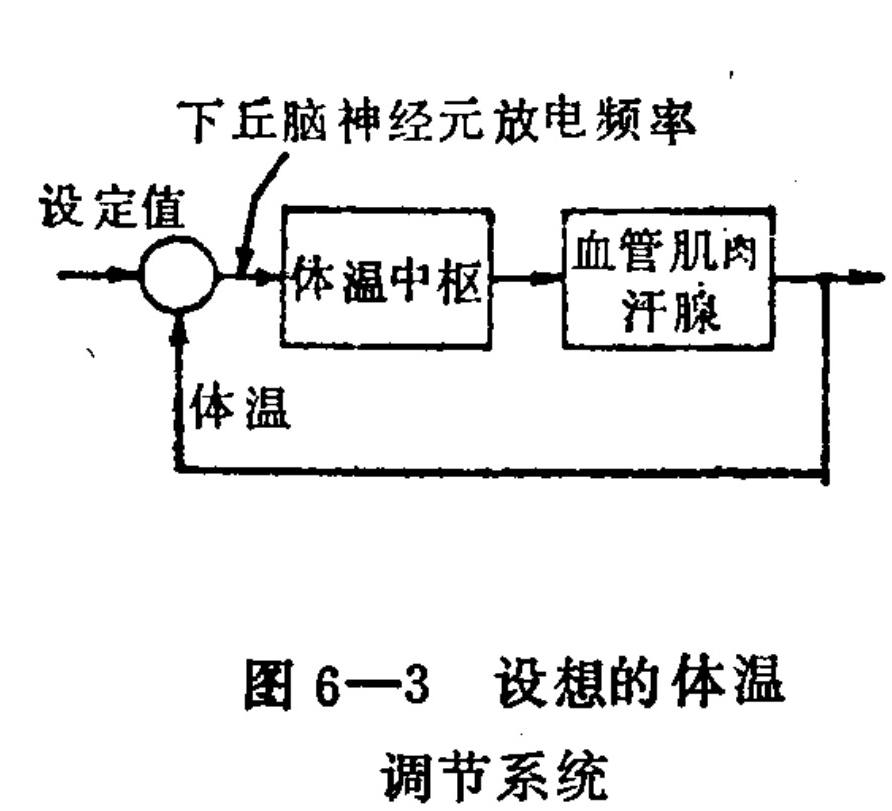
Figure 6-3 A hypothetical body temperature regulation system.
Translated labels: hypothalamic neuron firing frequency; set point; thermoregulatory center; blood vessels, muscles, sweat glands; body temperature
the manifestations also indicate the existence of a set point. There are many protein-decomposition products—for example, bacterial
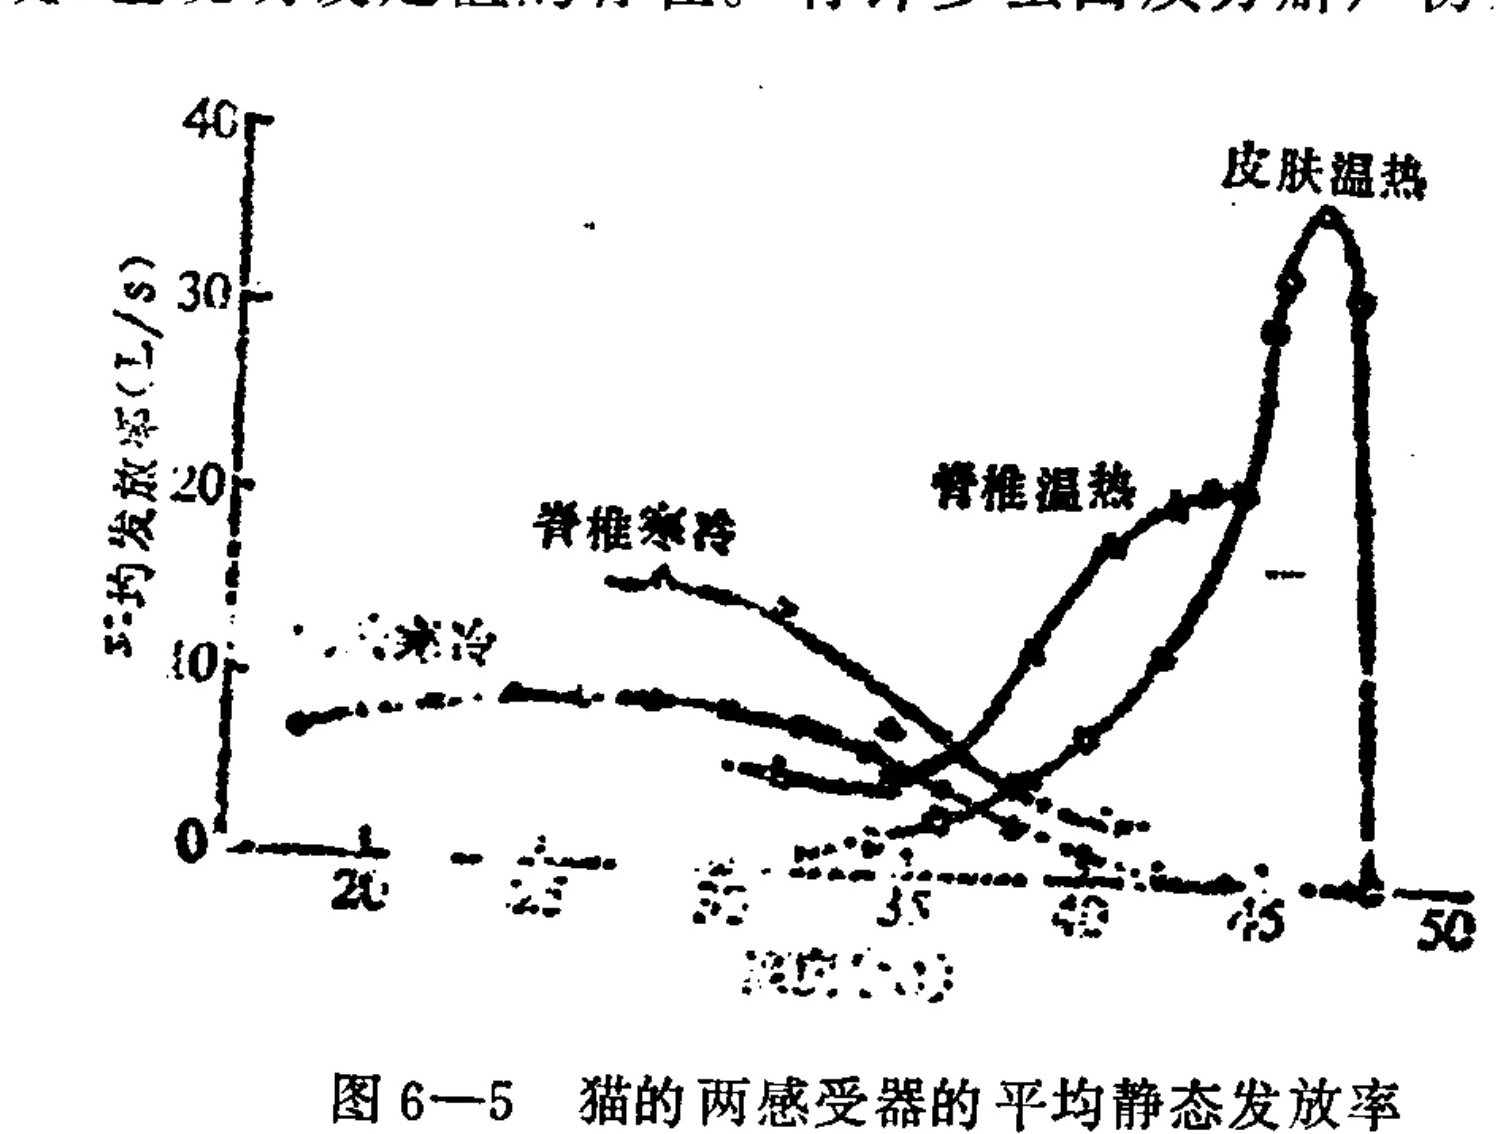
Figure 6-5 Average static firing rates of the cat’s two receptors
Translated labels: Average Discharge Rate (I/s); Temperature (°C); Skin Cold; Spinal Cord Cold; Spinal Cord Warm; Skin Warm
Lipid-polysaccharide toxins can stimulate the thermoregulatory center and produce a fever response. Such substances are called pyrogens. When a person becomes ill and develops a fever, this is the result of pyrogens produced by bacteria or released by disintegrating tissue acting on the temperature-sensitive neurons of the hypothalamus. If a small dose (nanograms) of pyrogen is injected into the hypothalamus, it can cause severe hyperthermia in an animal. This can be explained by the pyrogen changing the threshold characteristic of the hypothalamic temperature-sensitive neurons, thereby effectively raising the set point. It has now been confirmed that, during fever, if the thermoregulatory system is disturbed by other external factors, its dynamic process is similar to that under normal conditions. Clinical cooling measures such as ice bags or alcohol rubs make use of this fact. Changes in human body temperature during fever and cooling are shown in Figure 6-6. At the beginning of a fever, the set point suddenly rises. Although the body temperature is initially 37°C, the body’s response resembles that of abnormally low body temperature under normal conditions: secretion by the sweat glands stops, the skin blood vessels constrict, body temperature gradually rises, and a sensation of cold occurs. In other words, all the effectors act according to the deviation from the new set point. At the beginning of defervescence, although the body temperature is lower than the highest fever temperature, reactions such as profuse sweating and dilation of the skin blood vessels appear. This shows that the body temperature at this time is higher than the set point. That is, after the pyrogen disappears, the threshold of the temperature-sensitive neurons returns to normal and the thermoregulatory system restores its normal set point. Therefore, whenever the above situation appears, it can be predicted that body temperature will rapidly fall.
Aspirin and other antipyretic drugs may work by blocking the effect of pyrogens on the hypothalamic temperature-sensitive neurons, restoring the set point to normal and thereby lowering body temperature. It is worth pointing out here that fever within certain limits is beneficial to the body: it is a defensive measure by which the body resists disease. At such times, the number of white blood cells increases, antibody production becomes active, and the liver’s detoxification function is also enhanced. During fever, the body’s material-metabolism processes accelerate, which can increase the patient’s resistance. However, excessively high fever or fever lasting a relatively long time will disrupt the body’s various regulatory mechanisms. For example, above 41°C, the thermoregulatory center will lose its ability to regulate body temperature. In such circumstances, measures to reduce the temperature should be taken immediately.
Under normal physiological conditions, human body temperature can vary with differences in day and night, age, sex, environmental temperature, and other circumstances, so no further discussion is given here.
2. Mathematical Model of Thermoregulation
In the preceding section, we discussed the relevant issues of thermoregulation. To gain a deeper understanding of the specific quantitative and dynamic processes of thermoregulation, and to reveal quantitatively how the various factors governing body temperature affect the thermoregulatory process, it is necessary to establish, on the basis of the preceding discussion, a mathematical model that reflects the thermoregulatory process. The equations normally used to describe the dynamics of biological systems are nonlinear and are not easy to solve analytically. Therefore, electronic computers are commonly used to simulate the model and obtain the required quantitative results.
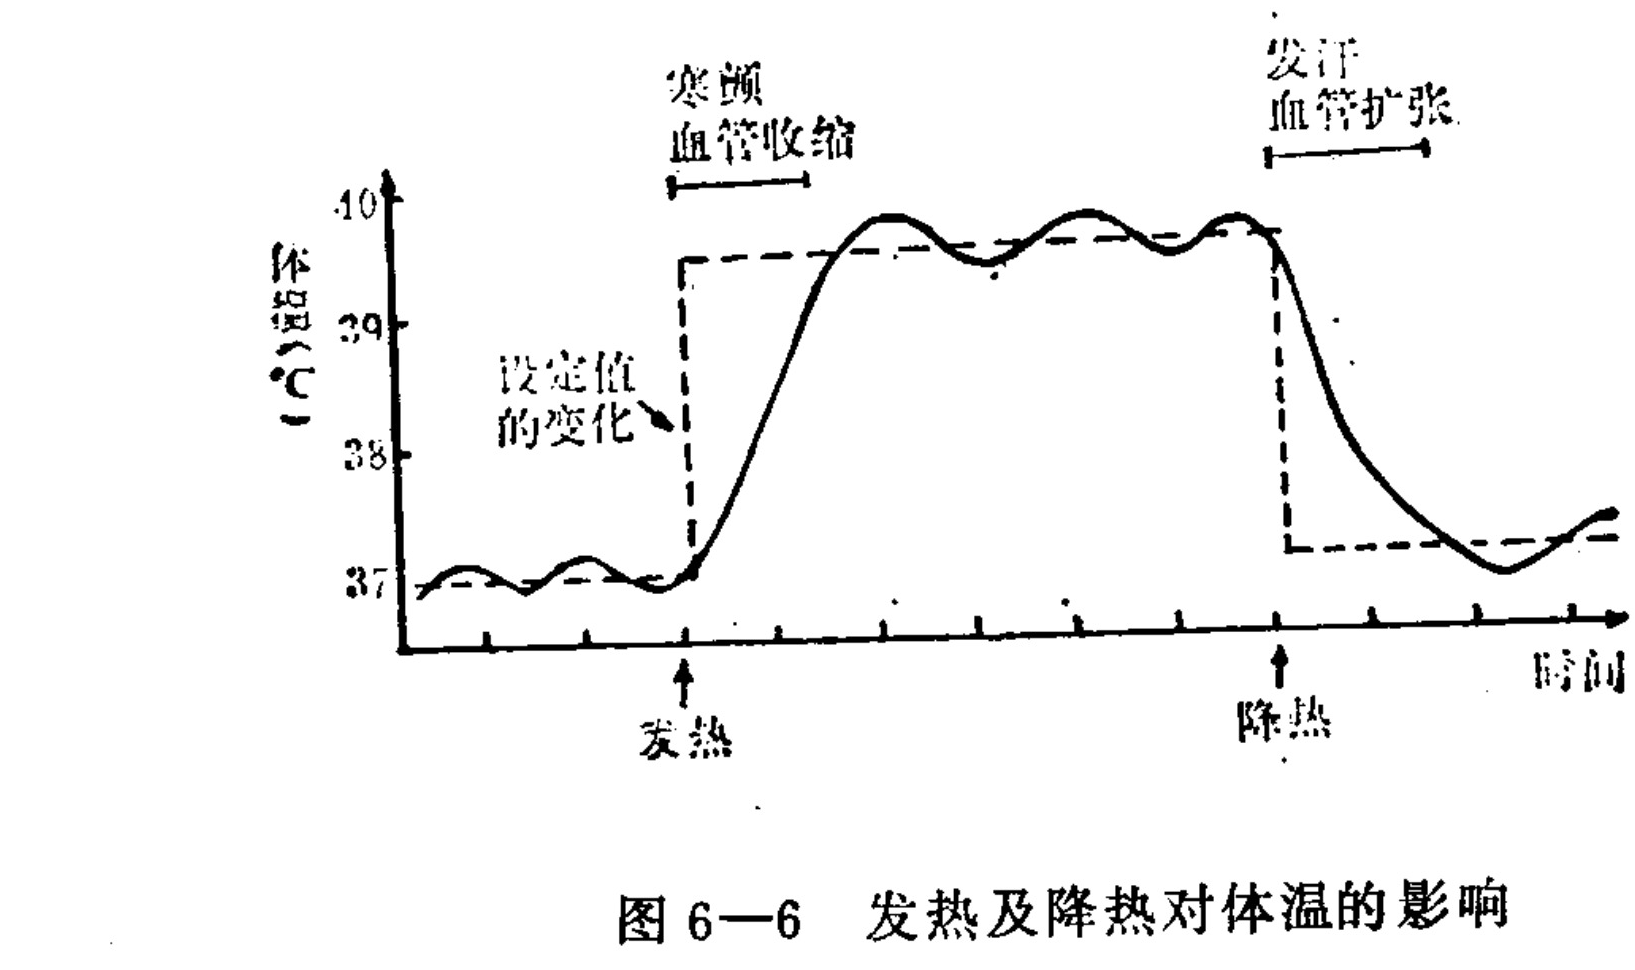
Figure 6-6. The effect of fever and defervescence on body temperature.
Translated labels: Body Temperature (°C); Time; Change in set point; Fever; Chills; Vasoconstriction; Defervescence; Sweating; Vasodilation
Body temperature is maintained relatively stable by feedback control, so we can begin with a simple model. The body-temperature feedback-control system consists of several principal parts. The controlled object is the human body, and the controlled variable is body temperature. For simplicity, the human body is divided into two parts, the body surface and the body core, each with a different temperature and a certain heat capacity, with heat conduction between the two parts. The thermoregulatory center of the hypothalamus is the controller of the feedback system. It receives information about the core (through the blood) and the body-surface temperature. The cold and warmth receptors in the body surface, together with the temperature-sensitive neurons in the hypothalamic center, are its feedback elements. The blood vessels (dilation and constriction), muscles (metabolism and shivering), and sweat glands (opening and closing) are the actuating elements. The actions of the actuating elements change the processes of heat production and heat dissipation, thereby controlling body temperature at a predetermined level. The quantitative model of this simplified thermoregulatory system is shown in Figure 6-7.
[Figure 6-7 diagram. Block diagram of the simplified thermoregulatory system. Controller outputs: control of sweating, vasomotor activity, metabolism. Electrical-analog circuit elements: Hc, core temperature feedback, Hex, Tc, Gv, Ts, Ga, Ta, Ce, Cs, Ha. Feedback path: skin feedback with transfer function K(1+T₁S)/(1+T₂S), where X = 0 when Ts > 33°C and X = Ts − 33 when Ts < 33°C.]
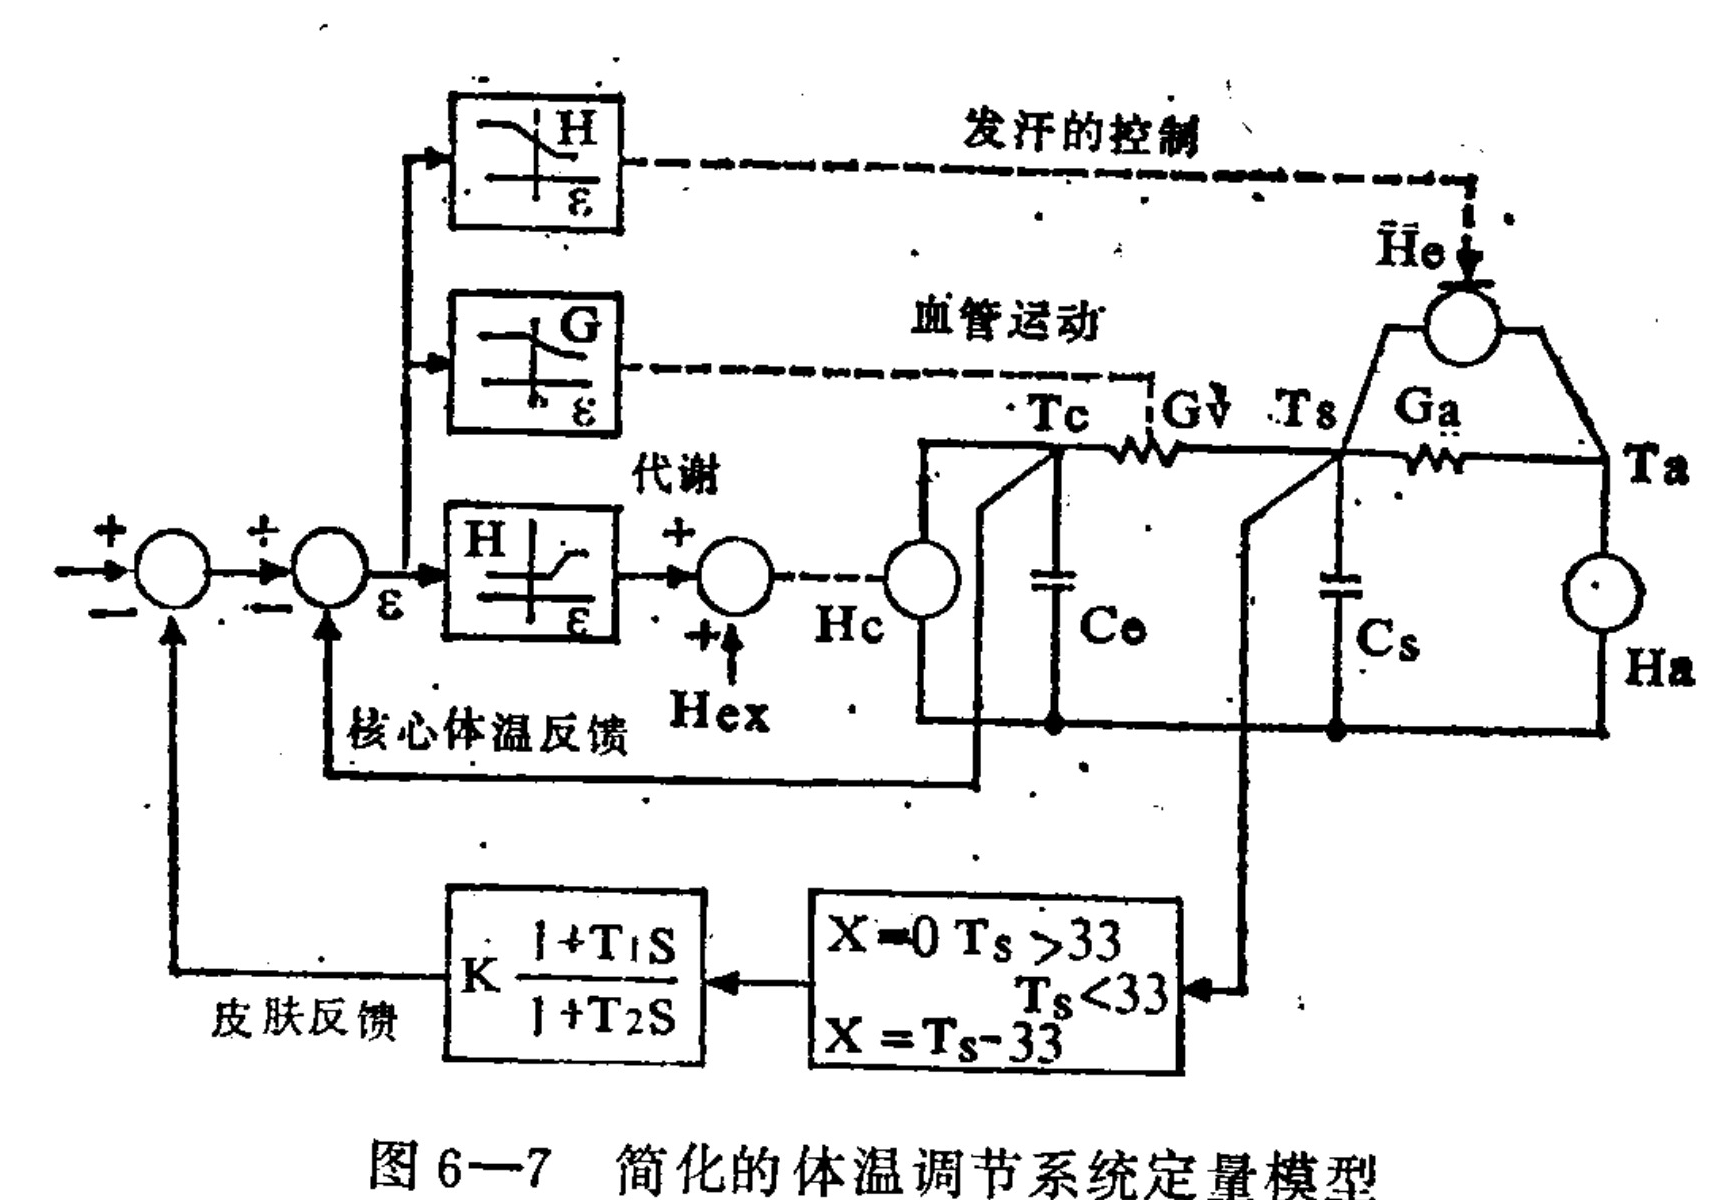
Figure 6-7 Quantitative model of a simplified thermoregulatory system
Translated labels: Sweating control; Vasomotor activity; Metabolism; Core body temperature feedback; Skin feedback
In Figure 6-7, the controlled variable is divided into core body temperature Tc (including the temperature of deep muscles and the viscera) and body-surface temperature Ts. The model assumes that only the body-surface cold receptors play a role in thermoregulation. When the body-surface temperature is higher than 33°C, no body-surface feedback is transmitted. The cold receptors have a dynamic process, which in the model is represented by a transfer function with a differential effect to express the dynamic characteristics of the receptors.
The figure uses an electrical circuit to simulate the controlled object. Readers familiar with circuit analysis can readily write the corresponding equations. The capacitors represent heat capacity, and the conductance represents the heat-conduction rate between the two parts. For example, G₁ is the heat conductance from the body interior to the body surface; it is determined by the degree of dilation of the skin blood vessels. Its value increases when the vessels dilate, and it is controlled by the thermoregulatory center. G₀ is the heat-conduction rate between the body surface and the environment; Ta is the environmental temperature. The sweating rate H₀, controlled by the thermoregulatory center, can alter the heat exchange between the body surface and the environment. Hₐ represents metabolic heat production and environmental heat sources. C₀ and C₁ represent the heat capacities of the core and the body surface, respectively. The thermoregulatory center controls heat production and heat dissipation according to the error between the set point and the combined value of the feedback signals. The relationships between the error ε and H₀, Hₐ, and G₁ are nonlinear relationships shown in the figure; their numerical values are determined experimentally. Hₑ is the rate of heat production from exercise. When this model is set up in an electronic computer and simulated, many interesting conclusions about thermoregulatory processes under different conditions can be obtained. Figure 6-8 shows two sets of results obtained through electronic-computer simulation: (a) the change in body temperature when the ambient temperature changes suddenly. For example, when the air temperature suddenly changes from 28°C to 49°C, body temperature rapidly rises to a certain level, then falls slightly as sweating increases substantially. (b) the change in body temperature during walking at moderate speed. Contrary to ordinary expectations, body temperature falls rather than rises at this time, in agreement with experimental observations in humans. Thus, this simplified model can reflect the actual situation of thermoregulation to a certain extent, and the simplified model already has some practical value. For example, it can be used to: (1) predict possible changes in body temperature under extreme conditions; (2) study the pattern of falling body temperature during hypothermic anesthesia, thereby determIn addition to dividing the body into several parts and separately considering their temperature changes, heat capacities, and heat-conduction coefficients (for example, dividing it into 25 parts as in Figure 6-1 of the first section), it should also consider the body surface, whose different parts all have temperature receptors. The controller should integrate the temperature information coming from the different parts and then determine its control action..]
(a) Sudden change in environmental temperature; (d) change in body-surface temperature during moderate-speed walking
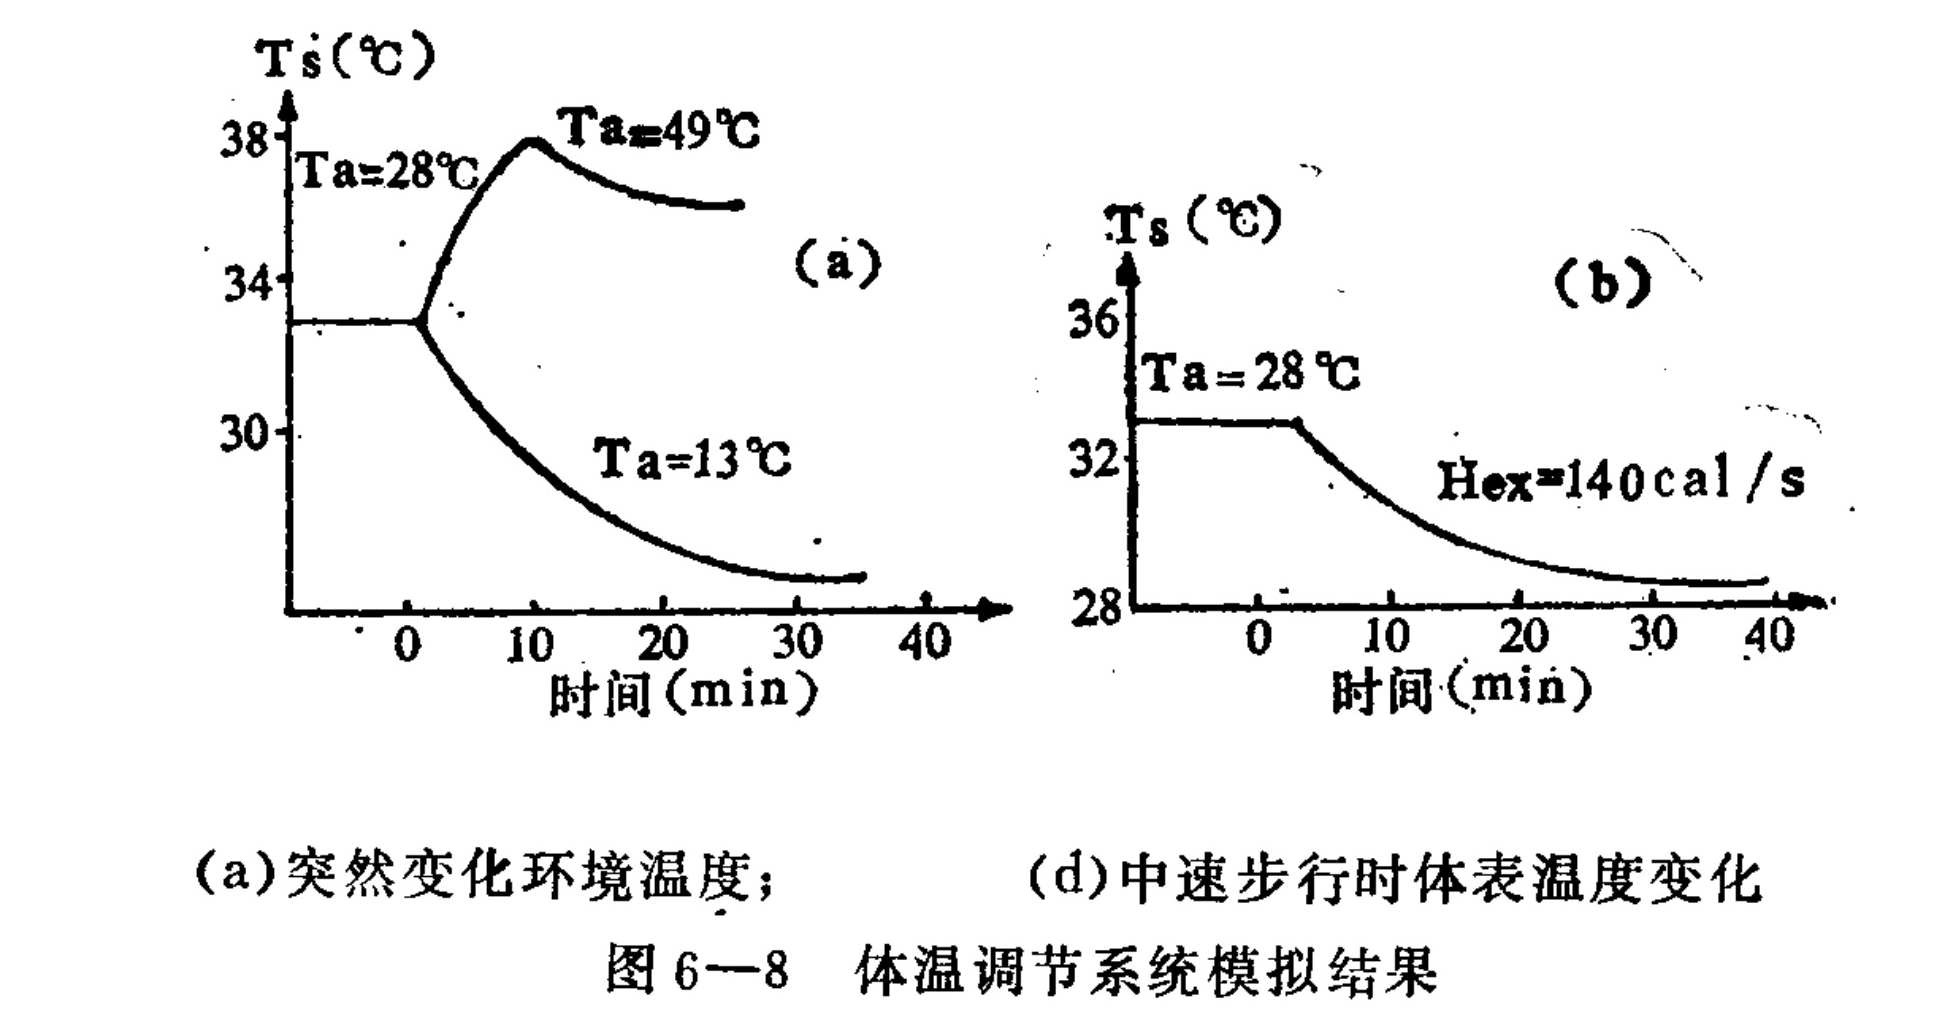
Figure 6–8. Simulation results for the thermoregulatory system
Translated labels: Ts (°C); Time (min); Ta=49°C; Ta=28°C; Ta=13°C; Hex=140 cal/s; (a) Sudden change in environmental temperature; (b) Skin temperature changes during moderate-speed walking
III. Changes in the thermoregulatory system during the qigong state
While practicing qigong, practitioners often experience localized or shifting sensations of heat. These phenomena suggest that qigong may induce changes in the thermoregulatory process. In addition, control of breathing during practice changes metabolic activity within the body, which will also affect the organism’s production and dissipation of heat.
During qigong practice, a parameter related to changes in the thermoregulatory system that is relatively easy to observe is body-surface temperature. For example, a thermographic instrument can be used to measure the infrared radiation emitted by the body surface (with a wavelength of approximately 3–50 micrometers), continuously obtaining changes in skin temperature. Huang Hua and others used thermography to observe body-surface temperature before and after qigong practice in some patients: 18 patients with asthma, 20 patients with chronic bronchitis, and 30 other patients. They found that during practice the skin temperature at the Shenque point rose (P<0.001), whereas the control group showed no regular change (P>0.05).
Chai Jianyu and Lin Yagu used the relatively simple HD-II infrared low-temperature instrument to observe changes in skin temperature near the Hegu point in 300 people before and after qigong practice. The results are shown in Table 6–1. The experimental results show that during qigong practice the skin temperature at the Hegu point rose markedly; the increase was even more pronounced in practitioners with deeper attainments.
Table 6–1. Changes in Hegu skin temperature before and after qigong practice
| Group | State | Increase in Hegu skin temperature (°C) | P value |
|---|---|---|---|
| Normal people | Natural state | −0.1 | <0.01 |
| Normal people | Quiet/resting state | 0.7 | |
| Qigong training class | Before training | 0.8 | <0.01 |
| Qigong training class | After training | 1.5 | |
| Practitioners | After practice | 2.5 | <0.05,* <0.001** |
- Compared with the qigong training class group after training; ** compared with the quiet state of normal people.
When attention is directed to a local area during qigong practice, the skin temperature there can generally rise. This may be because, under the action of the central nervous system, improved microcirculation increases local blood flow. Changes in skin temperature may not be the result of a change in the thermoregulatory system; they more likely reflect changes in the autonomic nervous system. However, controlling skin temperature can improve autonomic nervous-system function and thereby achieve the goal of treating certain diseases. For example, skin-temperature biofeedback has already been used to treat hypertension and other conditions.
The possible effects of qigong on the thermoregulatory system may be the more important issue, but relatively few observations have been made in this area. Some observations have been made abroad of changes in thermoregulatory function caused by TM practice. The subjects were 10 male students: five had practiced TM for more than one year, and the other five served as a control group without practice. A thermistor was placed on the middle finger. After the baseline skin temperature had been recorded, the experiment began. First, the subjects sat quietly with their eyes closed for 9 minutes; during this
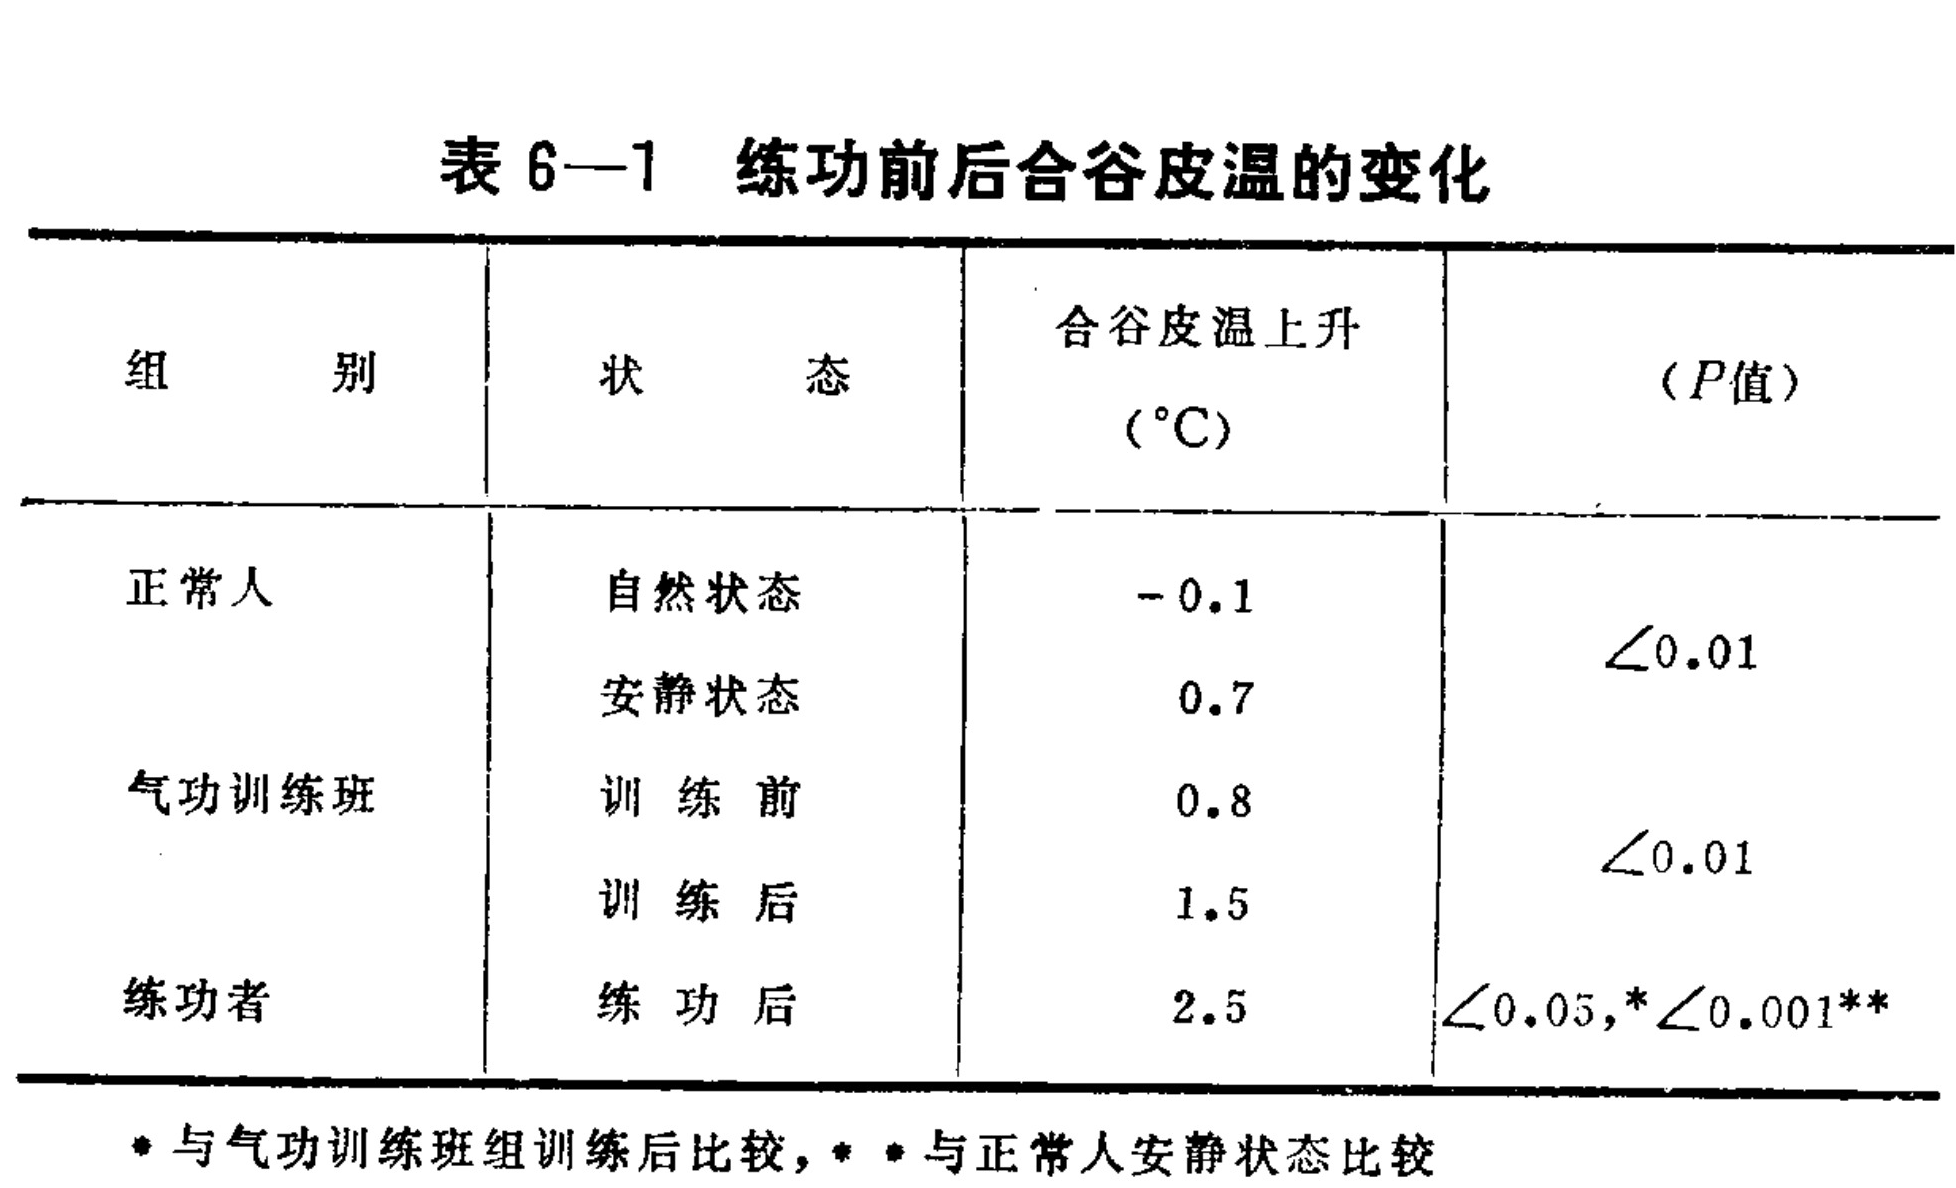
Table 6-1 Changes in skin temperature at the Hegu acupoint before and after Qigong practice
Translated labels: Group; State; Skin Temperature Rise (°C); P-value; Normal people; Natural state; Quiet state; Qigong training class; Before training; After training; Practitioners; After practice; * Compared with Qigong training group after training; ** Compared with normal people in quiet state
period, the experimental group practiced TM, while the control group only sat quietly. The subjects then sat quietly with their eyes open for 5 minutes, ran for 5 minutes, and then sat quietly for another 5 minutes. Skin temperature was recorded throughout this process, and the complete skin-temperature change curves are shown in Figure 6–9. The figure shows that during still rest there was no significant difference between the TM-practice group and the control group; but after an exercise load was added—that is, after a disturbance was applied to the thermoregulatory system—the hand temperature of the TM-practice group recovered more quickly than that of the control group. This indicates that after practice the dynamic performance of the thermoregulatory system was improved. This improvement was consistent with the recovery processes of the electroencephalogram and skin resistance after the disturbance had been removed. These results show that
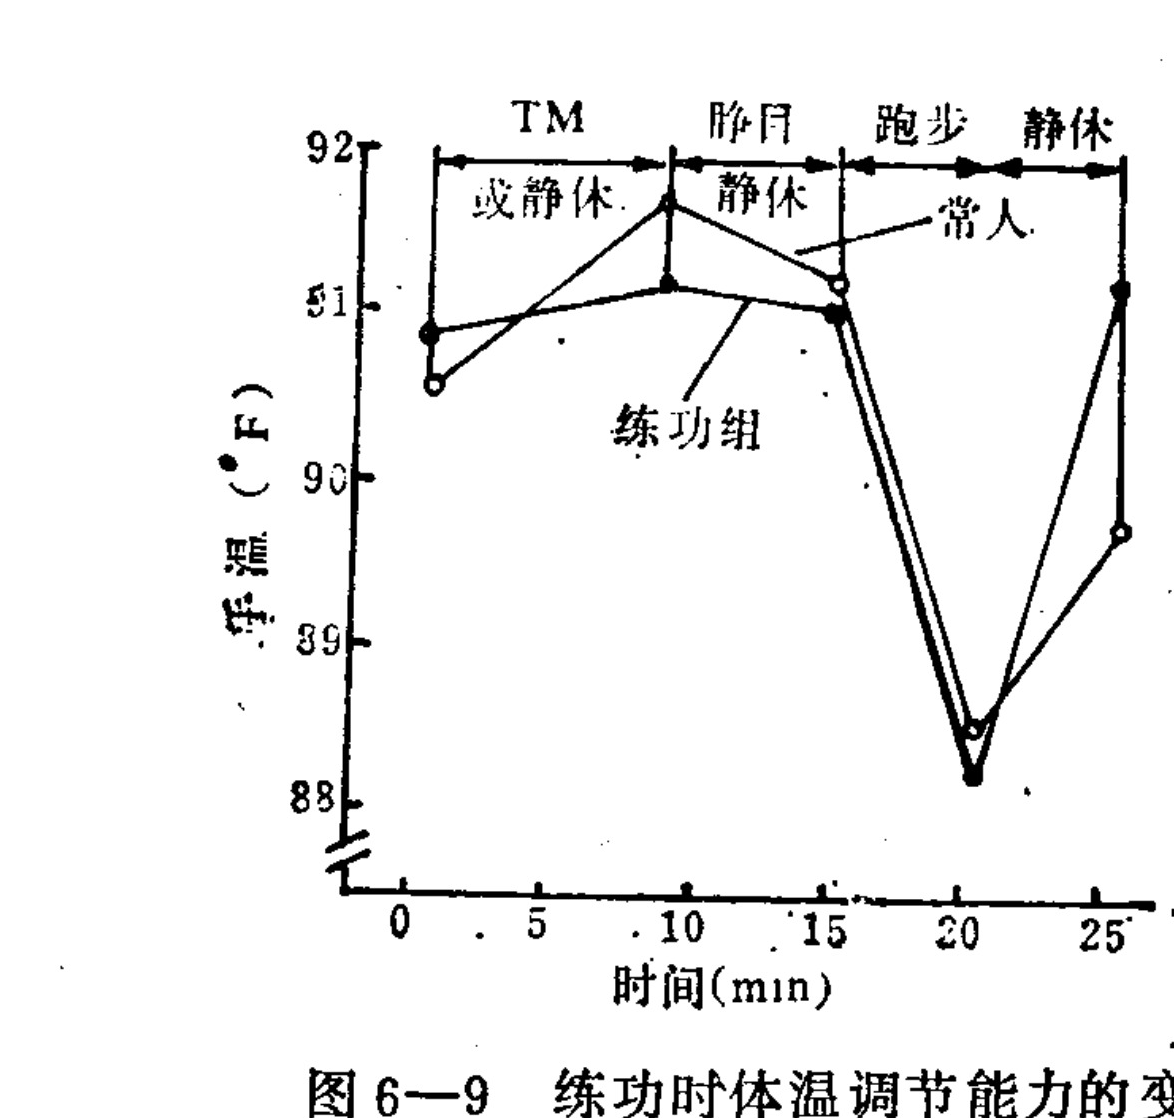
Figure 6–9. Changes in thermoregulatory capacity during qigong practice
Translated labels: Hand temperature (°F); Time (min); TM; Eye-closed rest; Running; Rest; Normal person; Practice group
Qigong may improve the dynamic performance of the entire internal-environment control system, keeping these systems in an excellent state and thereby giving them a stronger ability to resist disturbance. This resistance to disturbance is an important indicator of the organism’s state of health. At present, observations in this area are still relatively few. Therefore, further in-depth investigation of the effects of qigong on the performance of the various homeostatic regulatory systems will be an important component of deeper research into the principles of qigong.
Chapter Seven. Regulation of the Immune System and Qigong
In the living environment, the human body is constantly attacked by various harmful factors. For its own survival, the organism formed various defensive structures and systems during the long process of evolution, in order to avoid injury. The immune system is the system specifically used by the human body to resist the invasion of various harmful biological factors (such as bacteria and viruses). Under normal circumstances, bacteria or viruses are always invading and disturbing the human body, but most people do not become ill. This is because the human immune system can eliminate bacteria and viruses that enter the body, preventing them from surviving and developing there. The occurrence of human disease is often the result of a reduction in the organism’s own ability to resist disease. The role of qigong in preventing and treating disease is achieved mainly by strengthening the body’s own disease resistance. Therefore, qigong exercise is closely related to improvement in the function of the human immune system. In this chapter, we will introduce the main structures and functions of the immune system, the principles of immune regulation, mathematical models of immune-system regulation, and the effects of qigong on the immune system, among other topics.
I. Structure and function of the immune system
Human immune function can broadly be divided into two categories. The first is Barrier structures such as the skin and mucous membranes mechanically block entry and also secrete bacteriostatic and sterilizing substances, forming the organism’s first line of defense. There are also the blood–brain barrier and the placental bar
The placental barrier, and so on. Blood, lymph, and intercellular fluid normally contain more than ten kinds of nonspecific antimicrobial defensive factors, including complement, properdin, lysozyme, and other substances. Their sources and antimicrobial capabilities are shown in Table 7-1. Neutrophils, mononuclear phagocytes, and other cells in the blood can phagocytose bacteria and viruses; all of these cells originate in the bone marrow. After neutrophils ingest bacteria, a series of changes occurs inside the cells, leading to the destruction and death of the ingested microorganisms. Usually, the engulfed bacteria are killed after 5–6 minutes and digested within 30–60 minutes.
Table 7-1. Antimicrobial substances in normal body fluids
| Name | Main source | Chemical nature | Range of action |
|---|---|---|---|
| Lysozyme | Phagocyte lysosomes; tears, saliva, milk, etc. | Small-molecule basic protein | Gram-positive bacteria |
| Complement | Serum | Globulin | Gram-negative bacteria, viruses, spirochetes |
| Beta-lysin | Serum | Polypeptide | Gram-positive bacteria |
| Phagocytin | Neutrophils | Globulin | Gram-negative cells and a small number of Gram-positive cells |
| Histone | Lymphatic system | Small-molecule basic protein | Gram-negative bacteria |
| Tissue polypeptide | Lymphatic system | Basic polypeptide | Gram-positive bacteria, Escherichia coli, certain viruses |
| Leukocyte lysin | Neutrophils | Basic polypeptide | Gram-positive bacteria |
| Platelet lysin | Platelets | Polypeptide (?) | Gram-positive bacteria |
| Methemoglobin | Red blood cells | Iron-containing porphyrin | Gram-positive bacteria |
| Spermine and spermidine | Pancreas, kidneys, prostate | Basic polypeptide | Gram-positive bacteria, tubercle bacillus |
| Lactenin (乳素; milk factor) | Milk | Protein | Gram-positive bacteria (mainly streptococci) |
| Agglutinins | Serum | Globulin | Bacteria |
| Interferon | Cells | Glycoprotein | Viruses, etc. |
Specific immunity is
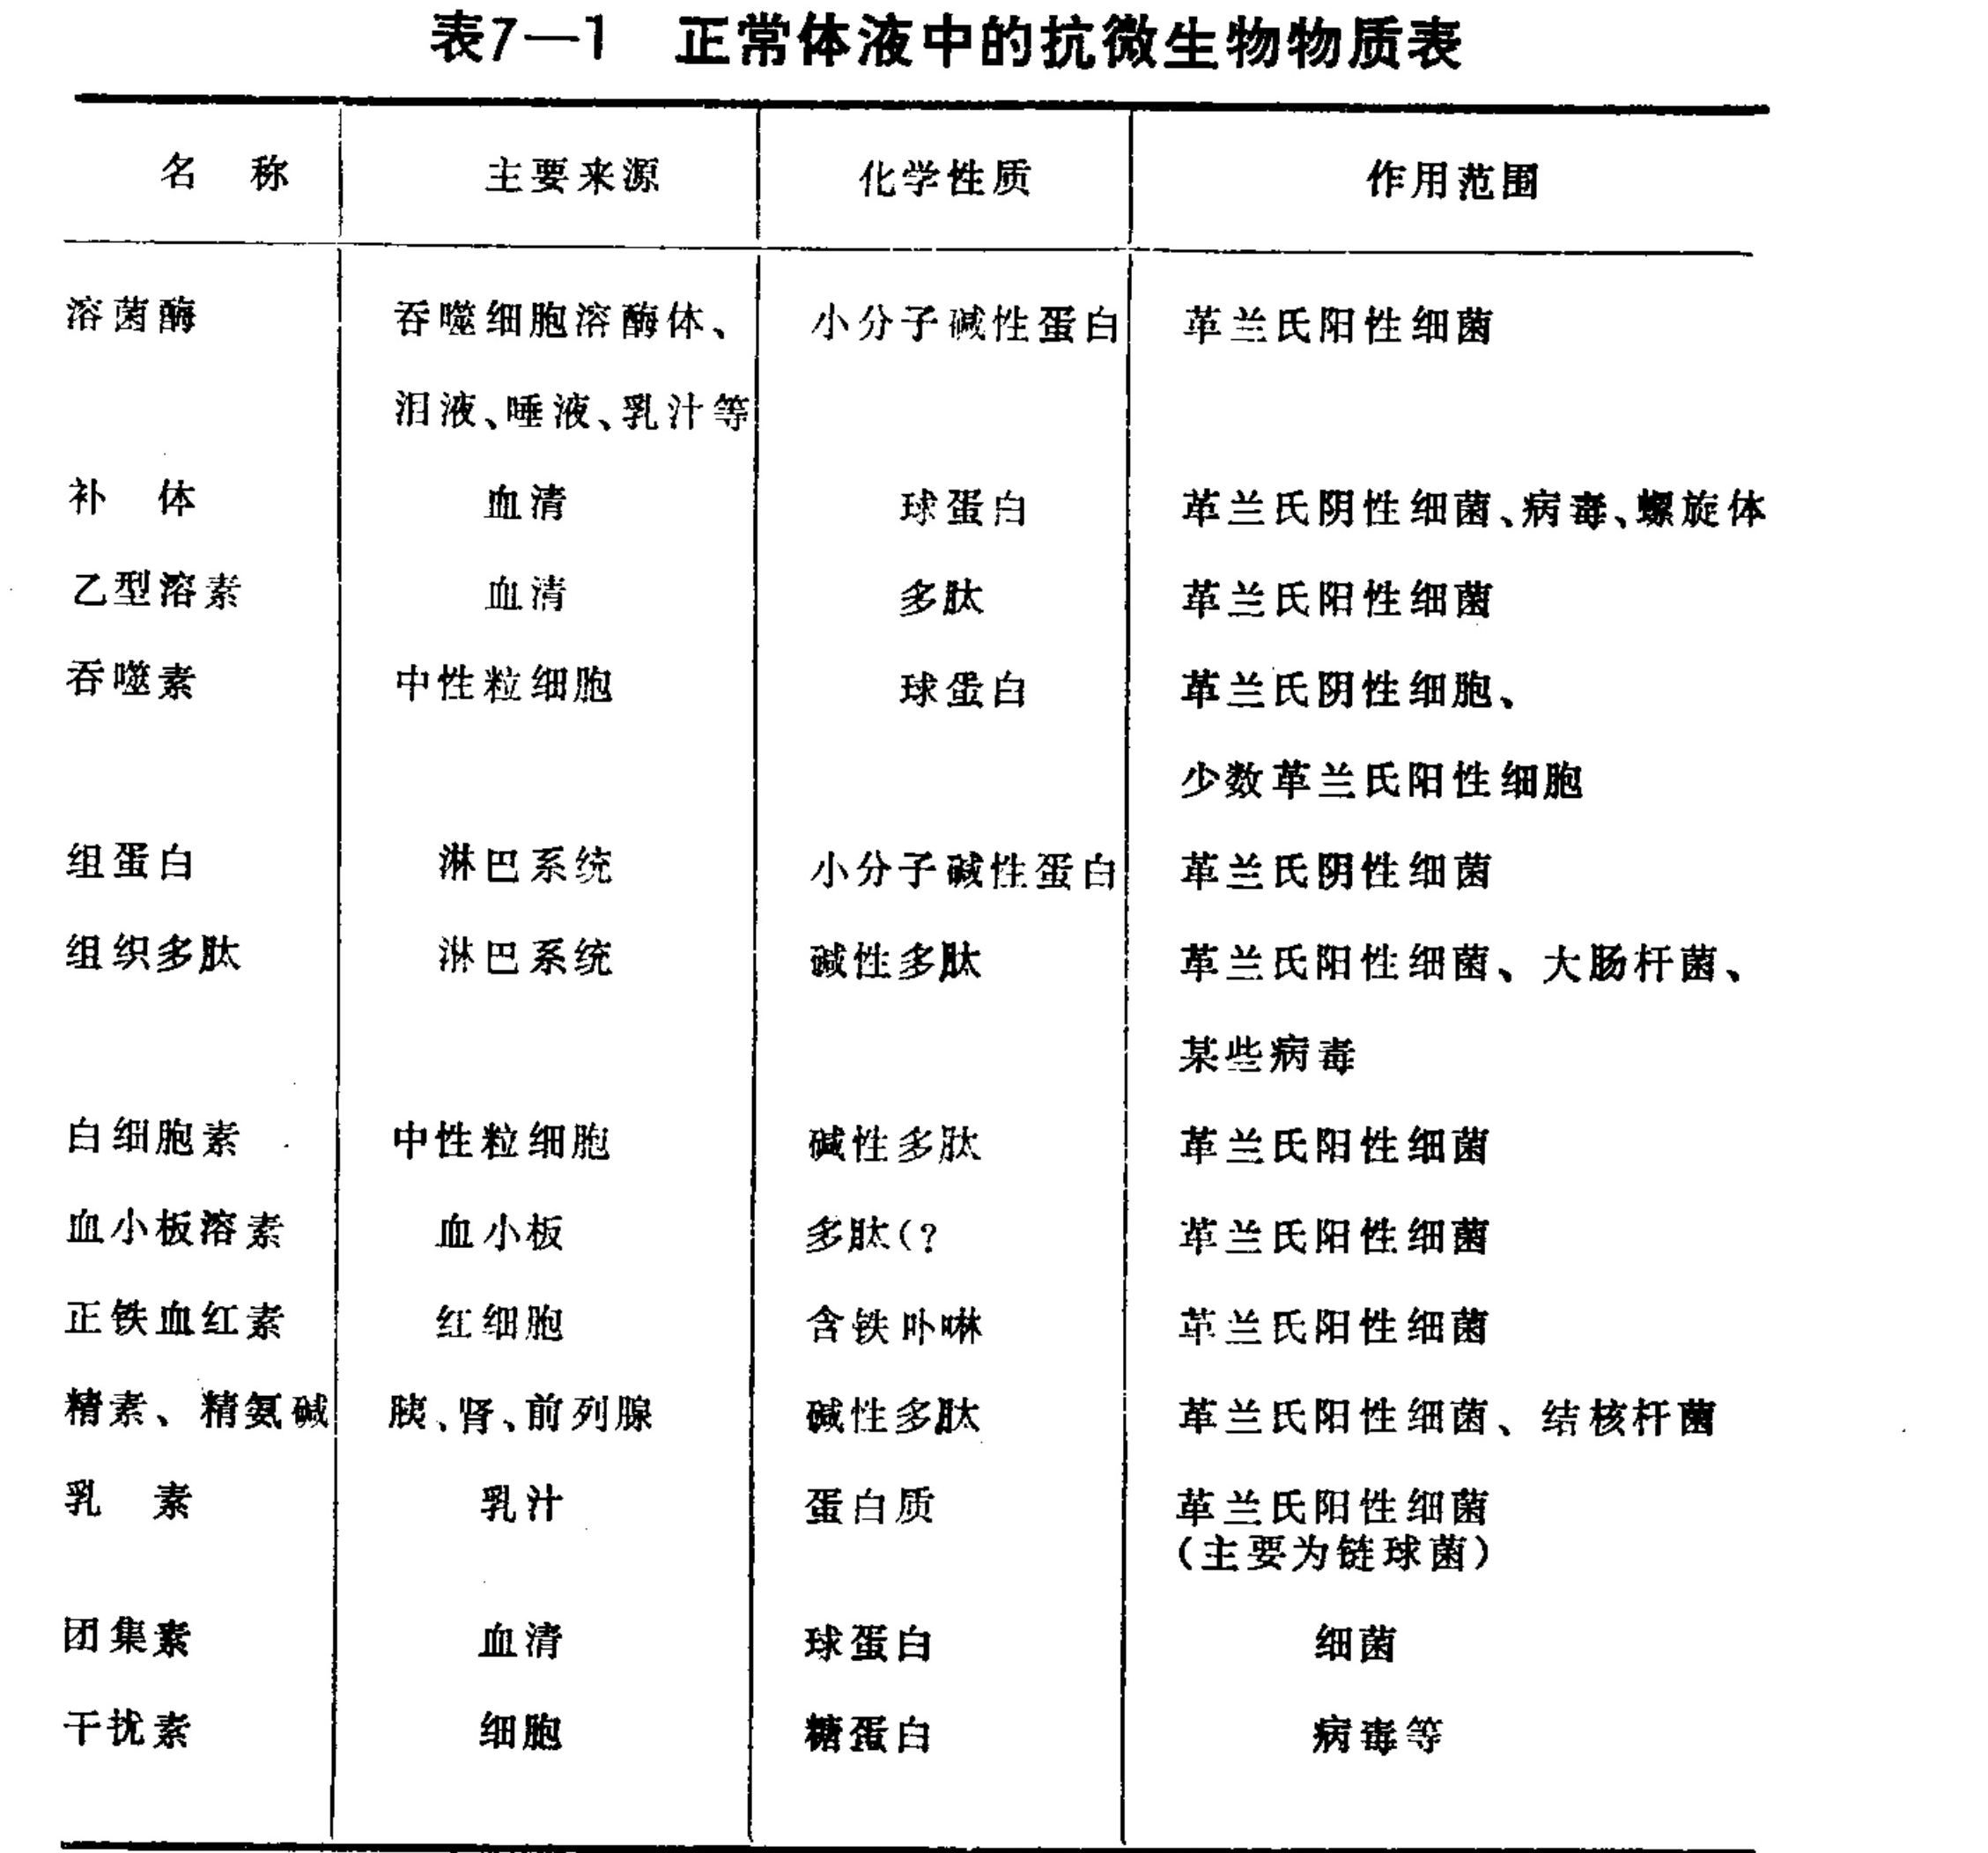
Table 7-1: Table of antimicrobial substances in normal body fluids.
Translated labels: Name; Main Source; Chemical Nature; Scope of Action; Lysozyme; Complement; Beta-lysins; Phagocytin; Histone; Tissue Polypeptides; Leukocidin; Thrombocidin; Siderophilin; Spermine, Spermidine; Lactenin; Agglutinins; Interferons; Gram-positive bacteria; Gram-negative bacteria; Viruses
implemented mainly by lymphocytes. Lymphocytes, under the action of antigens, differentiate into plasma cells capable of producing various immunologically active globulins and into sensitized lymphocytes. The globulins produced by plasma cells, also called antibodies, can bind to the antigens that elicited them, thereby eliminating the antigens or rendering them inactive. Sensitized lymphocytes can release immune substances or kill cells carrying antigens; these cells’ responses to antigens are markedly specific. Giant cells also participate in specific immunity. They can take up antigens and process them, making the processed antigens more readily able to act on lymphocytes.
Specific immunity can further be divided into cellular immunity and humoral immunity. Cellular immunity is mainly a function of T cells, whereas humoral immunity depends on B cells. These lymphocytes originate from undifferentiated primitive cells—the stem cells. Stem cells first appear in the yolk sac at the second to third week of embryonic age. They proliferate continuously and establish the erythrocyte, megakaryocyte, granulocyte, lymphocyte, and monocyte lineages. At the sixth week of embryonic age, these cells leave the yolk sac and migrate to the liver, where they continue to proliferate, making the liver the principal hematopoietic organ during the embryonic period. In adults, these cells are found mainly in the bone marrow. Their differentiation and migration are shown in Figure 7–1.
Figure labels: thymus; yolk sac; thymic small lymphocyte; T cell; fetal liver; spleen; recirculating lymphocyte; B cell; stem cell; B cell; T cell; lymph node; bone marrow; bursa of Fabricius or bursa-equivalent organ
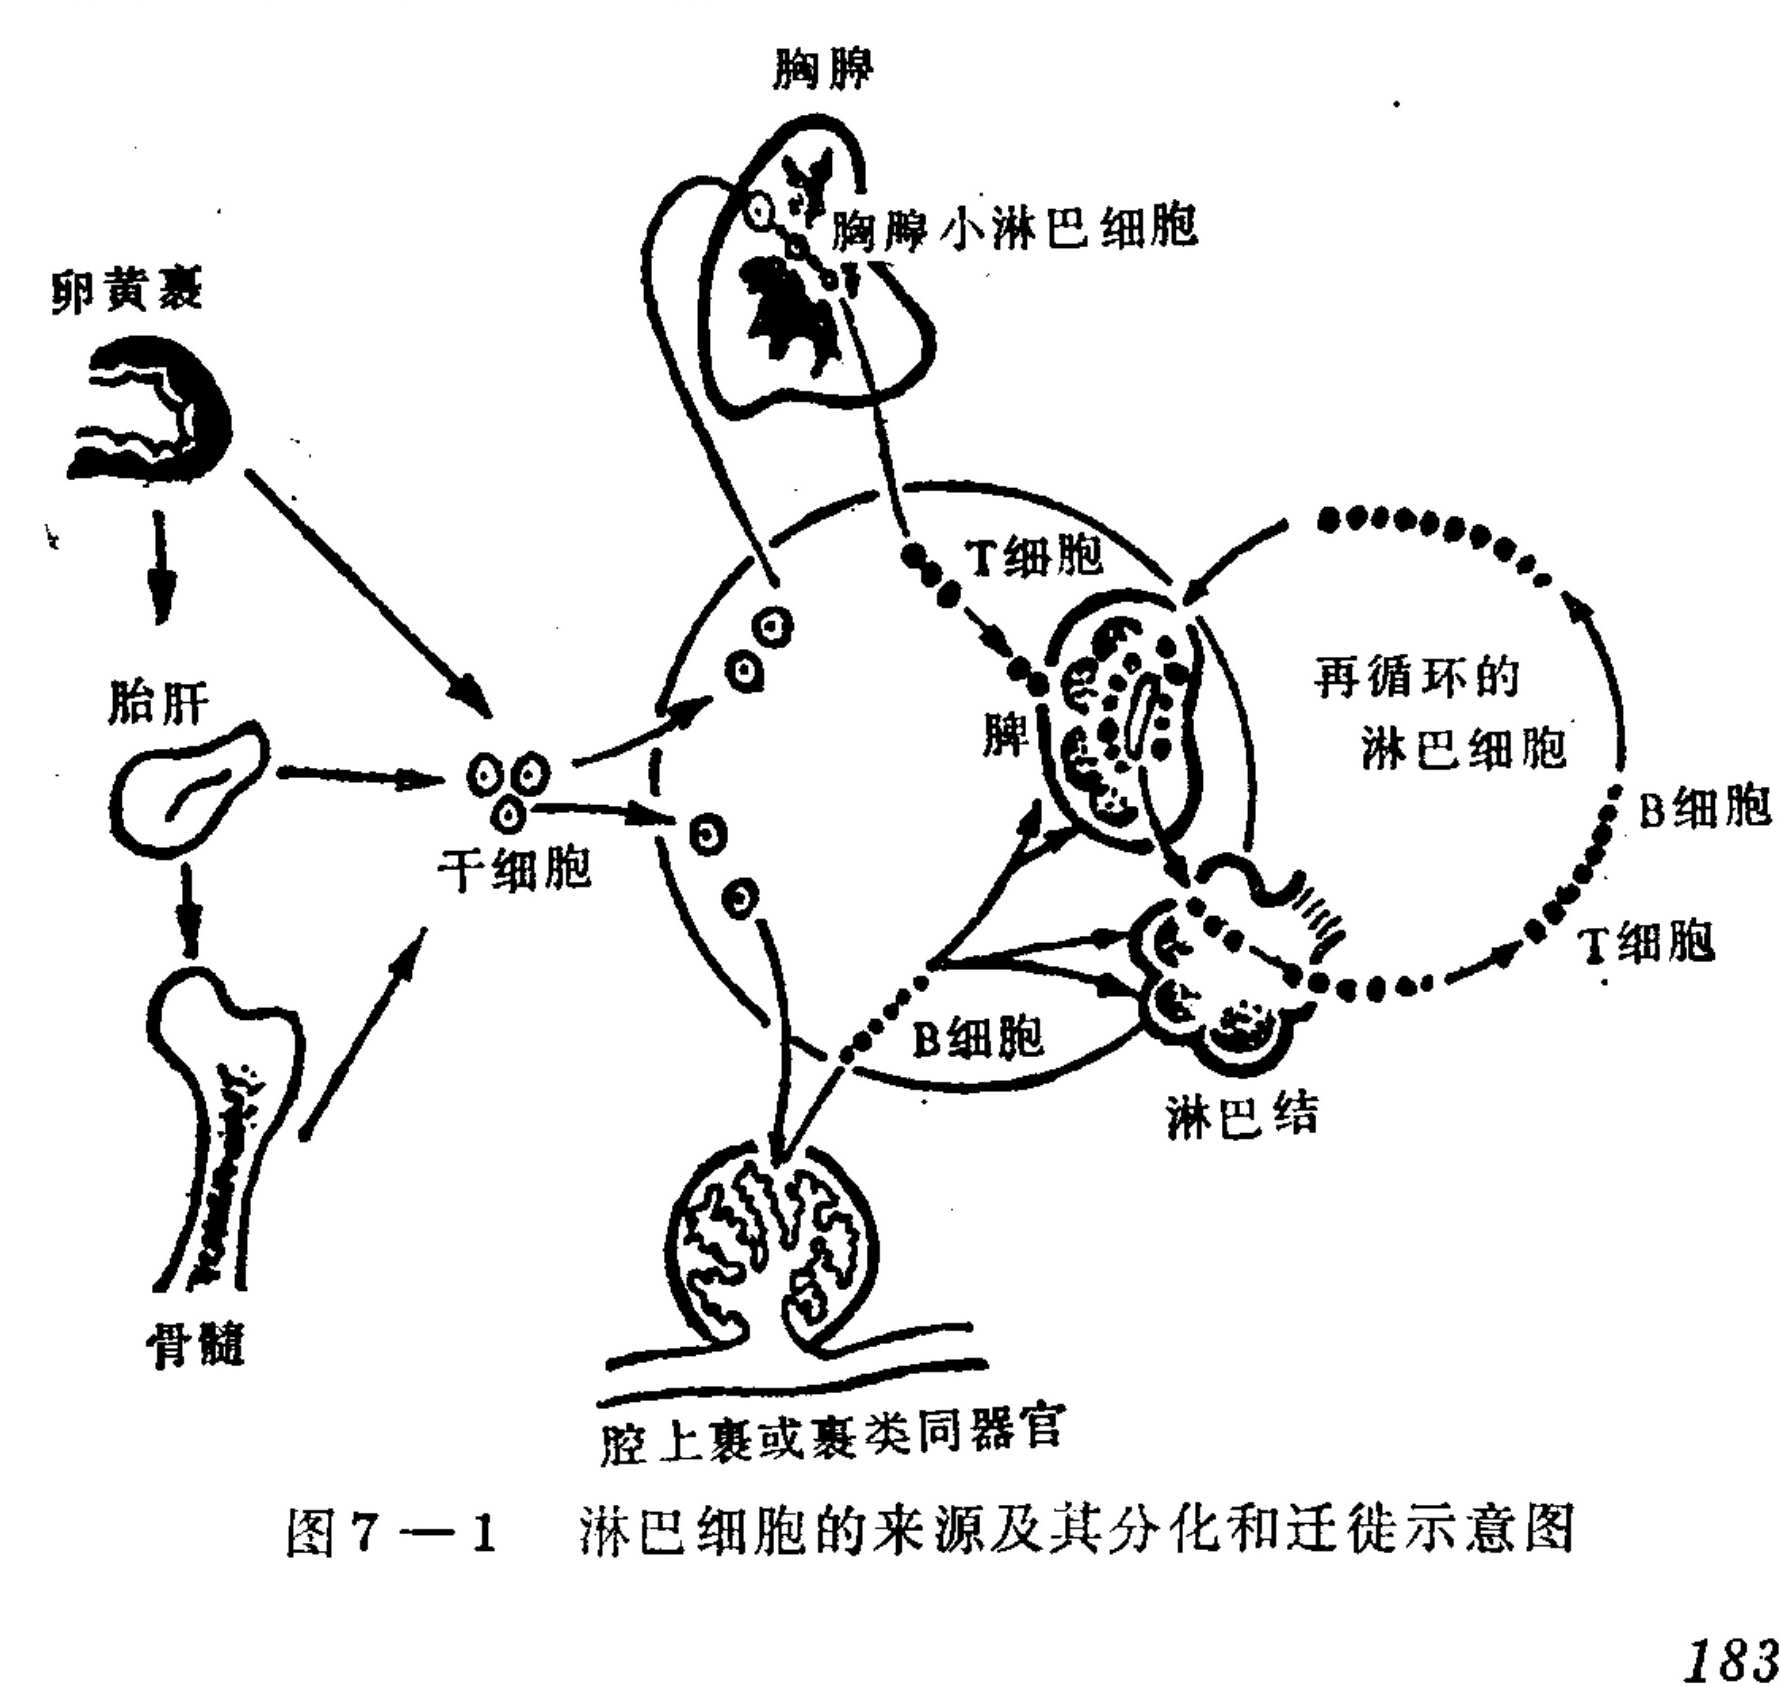
Figure 7–1. Schematic diagram of the origin, differentiation, and migration of lymphocytes
Translated labels: Yolk sac; Fetal liver; Bone marrow; Stem cells; Thymus; Thymic small lymphocytes; T cells; Spleen; B cells; Lymph nodes; Recirculating lymphocytes; Bursa of Fabricius or equivalent organs
As shown in Figure 7–1, only after stem cells are acted upon by the thymus can they develop into T cells; they are therefore called thymus-dependent cells. In birds, B cells are processed by the primary lymphoid organ, the bursa of Fabricius, whereas in humans the bone marrow, embryonic liver, and spleen are generally considered primary lymphoid organs.
T cells and B cells can each further differentiate into different subtypes, and each subtype has different functions. The T-helper-cell subgroup accounts for approximately one-third of the T cells in peripheral blood and mainly helps other cells carry out immune functions. Tc and Ts cells account for approximately 5–10% of peripheral T cells; Tc cells can kill target cells with mismatched HLA (human leukocyte antigen), while Ts cells can suppress humoral or cellular immune responses. TE cells (T effector cells) account for about 50% of peripheral T cells and further differentiate into Ly1, Ly2, and Ly3 cells. Their main function is to participate in humoral and cellular immune responses that clear the body’s own degenerated cells, including virus-infected cells and cancerous cells. Therefore, Ly1, Ly2, and Ly3 cells may play important roles in controlling the development of cancerous cells, viral infections, and autoimmunity.
The principal function of B cells is to produce antibodies. They can be divided into three subgroups: (1) immature B cells, which, after contacting any new antigen, become “tolerant”; (2) mature B cells that respond to thymus-dependent antigens, which require the assistance of helper T cells when responding to foreign antigens; and (3) mature B cells that respond to thymus-independent antigens.
The main characteristics of cellular immunity are that it is delayed and localized in its expression. During the generation and development of cellular immunity, cells must transform, proliferate, and differentiate; lymphokines must also be synthesized, and the lymphokines gradually expand the mutual interaction between macrophages and T cells. Cellular immunity therefore requires a certain amount of time to be completed. Humoral immunity, however, can produce an effect rapidly after antibodies have been formed, because the antibodies interact with antigens directly. Humoral immunity is nevertheless very weak against microorganisms that live inside cells. Cellular immunity plays an important role in recovery from various infectious diseases caused by intracellular microorganisms. On the one hand, cellular immunity produces a specific response when sensitized lymphocytes come into contact with the corresponding antigens; on the other hand, most of the lymphokines released have nonspecific effects. Macrophages activated by lymphokines can also phagocytose and kill many kinds of pathogens.
Cellular immunity may also have harmful consequences for the body, because sensitized lymphocytes can destroy infected host cells (target cells). For example, in human chronic active hepatitis, injury to liver cells is related to cellular immunity. In human humoral immunity, B cells generally receive antigenic stimulation with the assistance of T cells and form plasma cells through proliferation and differentiation. Plasma cells can synthesize and secrete antibodies that bind specifically to antigens; antigens bound by antibodies lose their activity or are cleared.
The formation, differentiation, and regulation of antibodies will be explained in the next section. Antibodies can also have an adverse side for the body. For example, antibodies produced against self-antigens can damage tissues and cause autoimmune diseases. In addition, tumor patients can produce immune-enhancing antibodies (blocking factors) in the body, which are also harmful to the body.
II. Regulation and control of the immune system
The immune system is a complex system. The various immune-function cells and the immune substances they produce have relationships of mutual regulation and mutual restriction. Specific immunity in particular—the series of immune reactions produced after an antigen invades the body—is an extremely complex biological phenomenon. Here we first discuss the regulation of antibody production after an antigen enters the body.
The basic process of the immune response after an antigen enters the body can be divided into three stages. The first stage is the stage in which immune cells receive antigenic stimulation. During this stage, macrophages play an important role. Most antigens must be taken up and processed by macrophages. Macrophages take up antigens through pinocytosis, phagocytosis, and adsorption.
Most of the antigens taken up—more than 90 percent—are rapidly broken down and lose their immunogenicity. Only a small portion retains immunogenicity. Most of this small portion is present on the sMacrophages transmit antigenic information to T cells mainly through direct contact with the cell surface. To trigger a specific immune response, immune-competent cells must first recognize the antigen. Immune-competent cells have specific recognition sites—that is, antigen receptors. Each lymphocyte has only one kind of antigen receptor and can recognize one kind of antigen. A specific antigenic determinant can bind only to lymphocytes with antigen receptors of complementary structure. When an antigen binds to a lymphocyte, the lymphocyte proliferates and differentiates under the combined action of other factors.
After recognizing an antigen, lymphocytes enter the reaction phase. Activated T cells transform into lymphoblasts, and then proliferate and differentiate into sensitized lymphocytes with immune effector functions. After B cells are activated, they transform into plasmablasts and then, through proliferation and differentiation, become plasma cells capable of synthesizing and secreting antibodies. Sensitized lymphocytes and plasma cells do not continue differentiating, and their life spans are not long (several days). During the proliferation and differentiation of activated lymphocytes, some cells stop halfway and no longer continue proliferating or differentiating; these become memory cells, which survive in the body for a relatively long time.
The activation of B cells is generally thought to require two signals. The binding of an antigen to the antigen receptor on the B-cell membrane produces the first signal; the binding of the antigen to a relevant receptor on a T cell produces the second signal. Only after receiving the second signal can B cells proliferate and differentiate and produce antibodies. T-cell activation also requires two signals. The antigen receptor of the T cell binds to the antigen to produce the first signal. The second signal comes from macrophages. The differentiation and maturation of B cells and the process by which they produce antibodies are regulated by T cells. T-helper cells promote the differentiation of B cells, while T-suppressor cells inhibit B-cell differentiation; the principle of this action has not yet been elucidated.
The third stage is the effector stage. Both antibodies and sensitized lymphocytes can bind to antigens. T cells can also secrete various immune factors and exert helper, suppressive, and other effects. After coming into contact with an antigen, T cells can directly kill cells carrying the antigen. More than 20 kinds of immune factors are released by them, all of which help eliminate the antigen. When an antigen combines with an antibody, the toxicity of the antigen is neutralized, making the antigen more susceptible to agglutination and dissolution. The three stages of the immune response are summarized in Figure 7-2.
The formation and production of antibodies is also a complex process. After the body first comes into contact with a particular antigen, no antibody can be detected for a period of time; this period is called the latent period. The length of the latent period is related to the nature and quantity of the antigen and to the condition of the body. After injection of a toxoid, antibodies do not appear until 2–3 weeks later; after injection of a bacterial vaccine, antibodies generally appear after about one week. This is the primary response. The antibodies produced in the primary response are mainly IgM; their titer is generally not high.
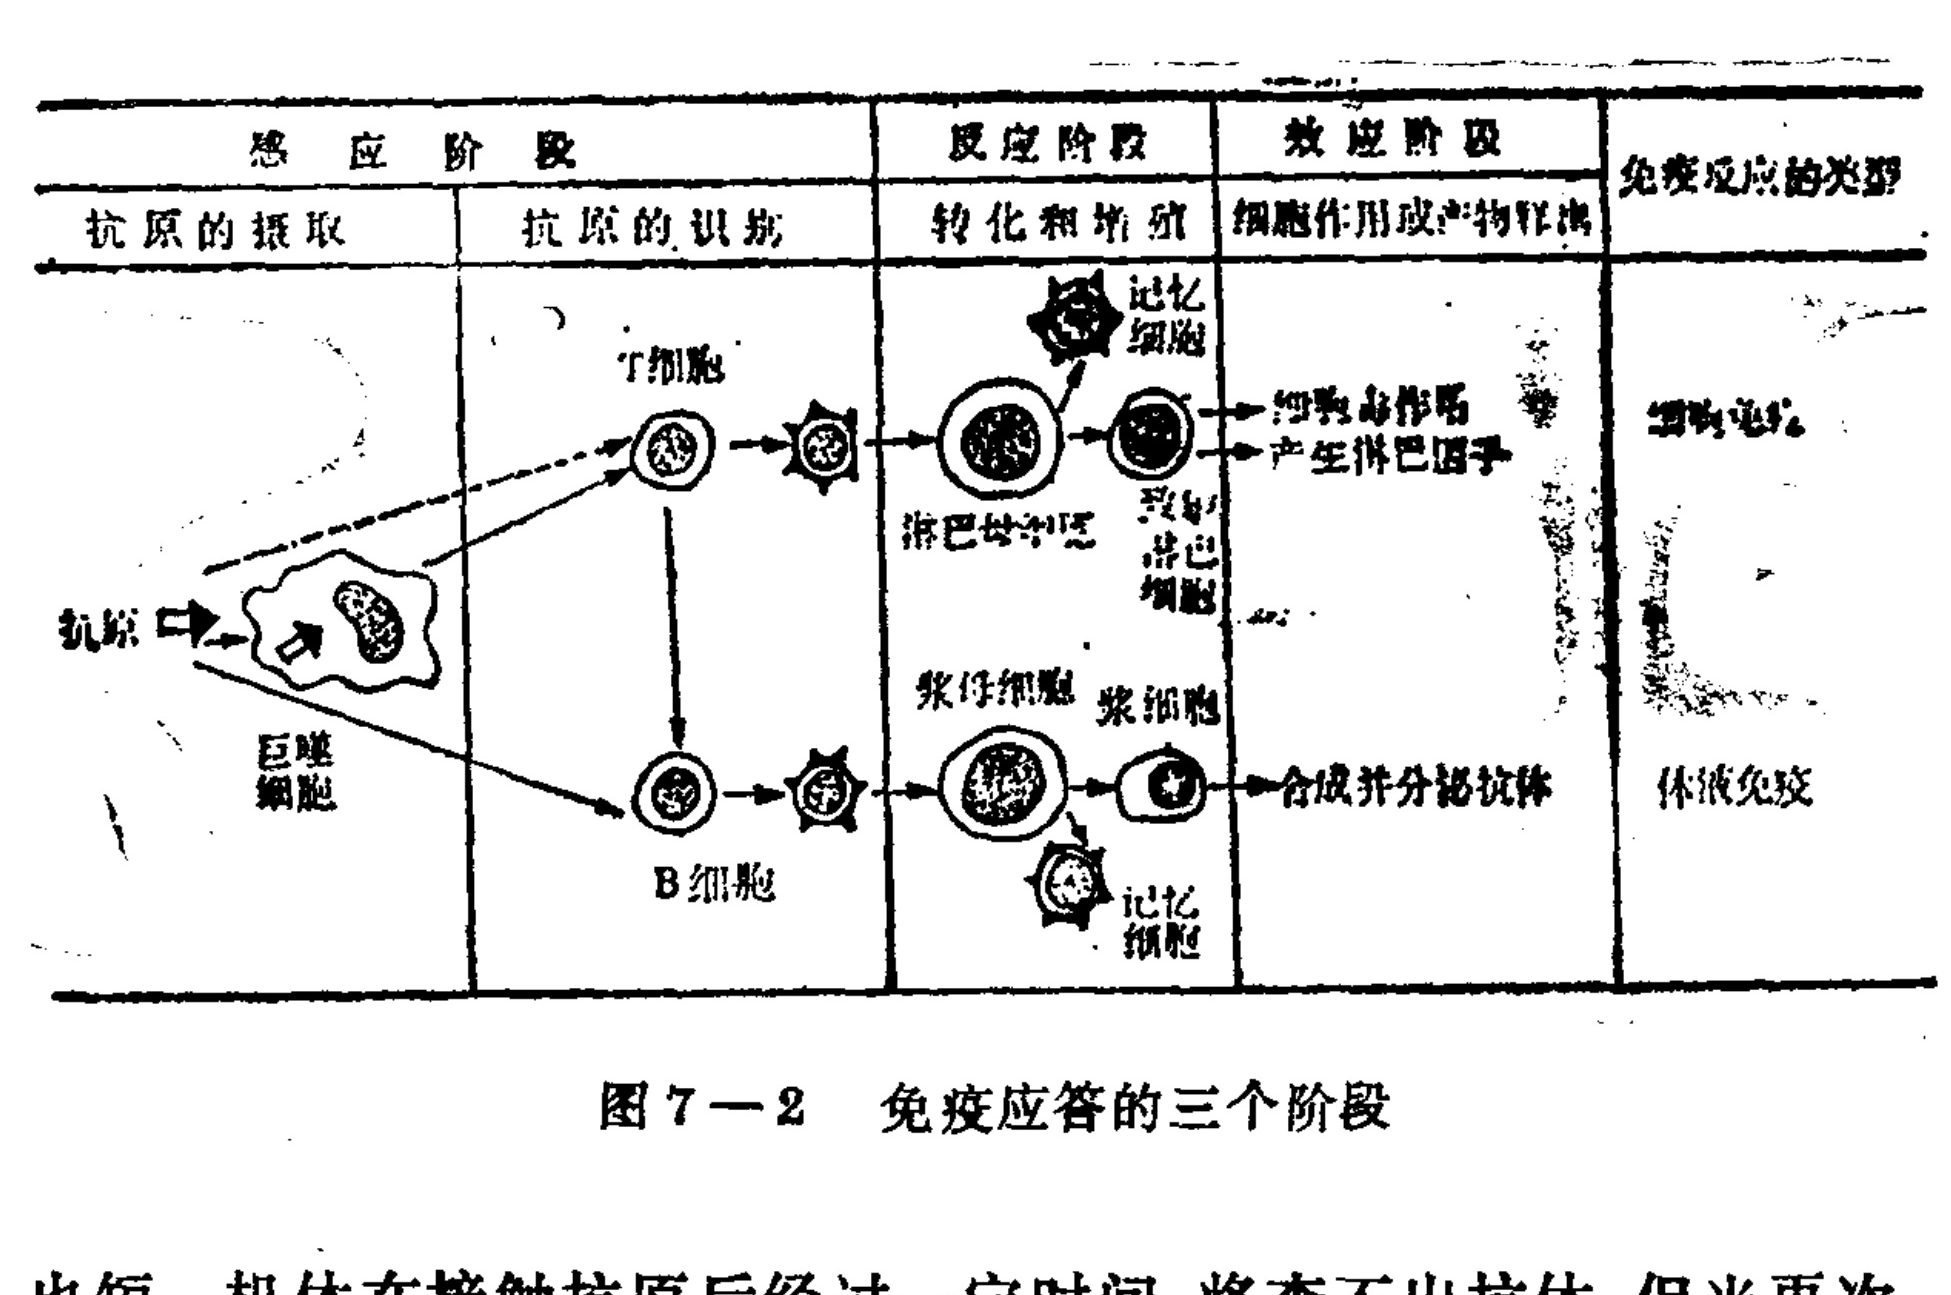
Figure 7-2. The three stages of the immune response
Translated labels: Sensing stage; Response stage; Effect stage; Antigen uptake; Antigen recognition; T cell; B cell; Macrophage; Antigen; Memory cell; Effector cell; Plasma cell; Cellular immunity; Humoral immunity
[Figure structure and labels: induction/sensitization stage—antigen uptake and antigen recognition; reaction stage—transformation and proliferation; effector stage—cellular action or product release; immune-response type. Cellular-immunity path: antigen → macrophage → T cell → lymphoblast → sensitized lymphocyte, with a memory-cell branch → cytotoxic effect and production of lymphokines → cellular immunity. Humoral-immunity path: antigen/macrophage → B cell → plasmablast → plasma cell, with a memory-cell branch → synthesis and secretion of antibodies → humoral immunity.]
Its duration is also short. After the body has been exposed to an antigen for a certain period, antibodies may no longer be detectable. However, when it is exposed to the same antigen again, memory cells are already present, so antibodies are produced rapidly after a short latent period or with no latent period. This is called the secondary response (repeat response). The antibodies in the secondary response are mainly IgG. Their level is relatively high—several times, or even more than 20 times, that of the primary response—and they also decline more slowly. Because the antigen entering the body combines with antibodies in the plasma, the antibody level sometimes undergoes a brief decline during the secondary response, then rises markedly again after 1–2 days. The processes of the primary and secondary antibody responses are shown in Figure 7-3.
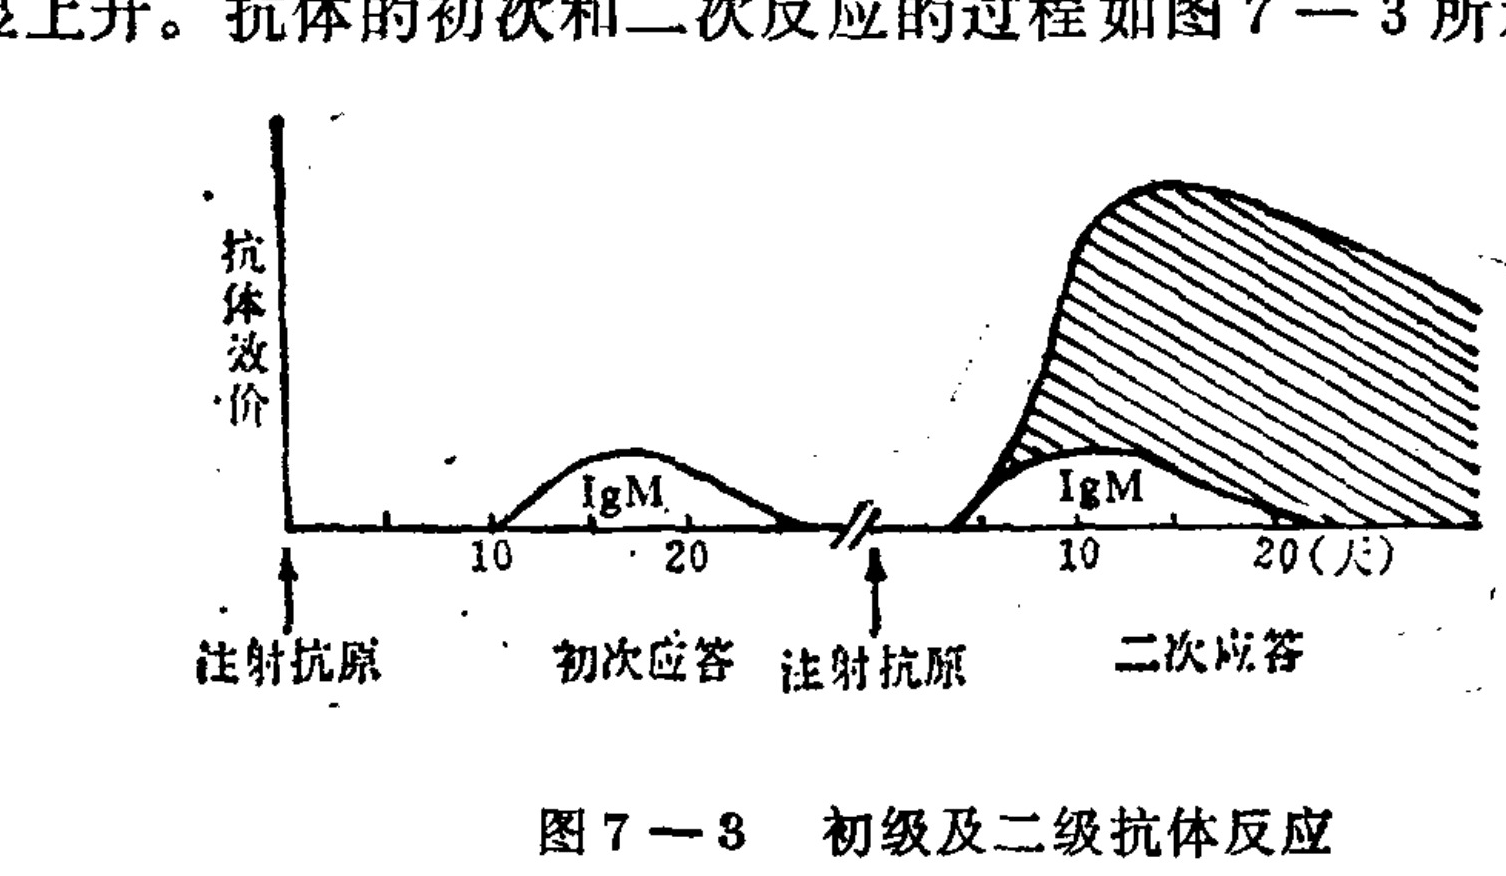
Figure 7-3 labels: vertical axis, antibody titer; IgM on both response plots; day ticks 10 and 20 for the primary response and 10 and 20 (days) for the secondary response; inject antigen at each exposure; primary response; secondary response. A large hatched secondary-response component is visible but is not legibly named in this scan.
Translated labels: Antibody titer; IgM; Antigen injection; Primary response; Secondary response; Days
Figure 7-3. Primary and secondary antibody responses
Some antigens can stimulate the body to produce several classes of immunoglobulins. Generally, they appear successively in the order IgM, IgG, and IgA. IgM appears earliest but disappears quickly, remaining in the blood for only several weeks or months. IgG appears slightly later than IgM. When IgM is close to disappearing, IgG reaches its peak; it can remain in the blood for a relatively long time, even more than several years. IgA appears last and is present in very small quantities. It can generally be detected in the blood only 2 weeks to 2 months after IgM and IgG have appeared, but it can persist for a relatively long time. Thymus-independent antigens, such as pneumococcal polysaccharides, generally induce only the production of IgM. Thymus-dependent antigens require the assistance of macrophages and T cells before they can cause B cells first to produce IgM and then transform to produce IgG and IgA. The basic properties of the principal human immunoglobulins (antibodies) are shown in Table 7-2.
Table 7-2. Basic properties of human antibodies
| Category | IgG | IgA | IgM | |---|—Burnet’s clonal selection theory has gained considerable support. The selection theory holds that during the embryonic period, the body already possesses cells bearing receptors for every antigen it may encounter during its life
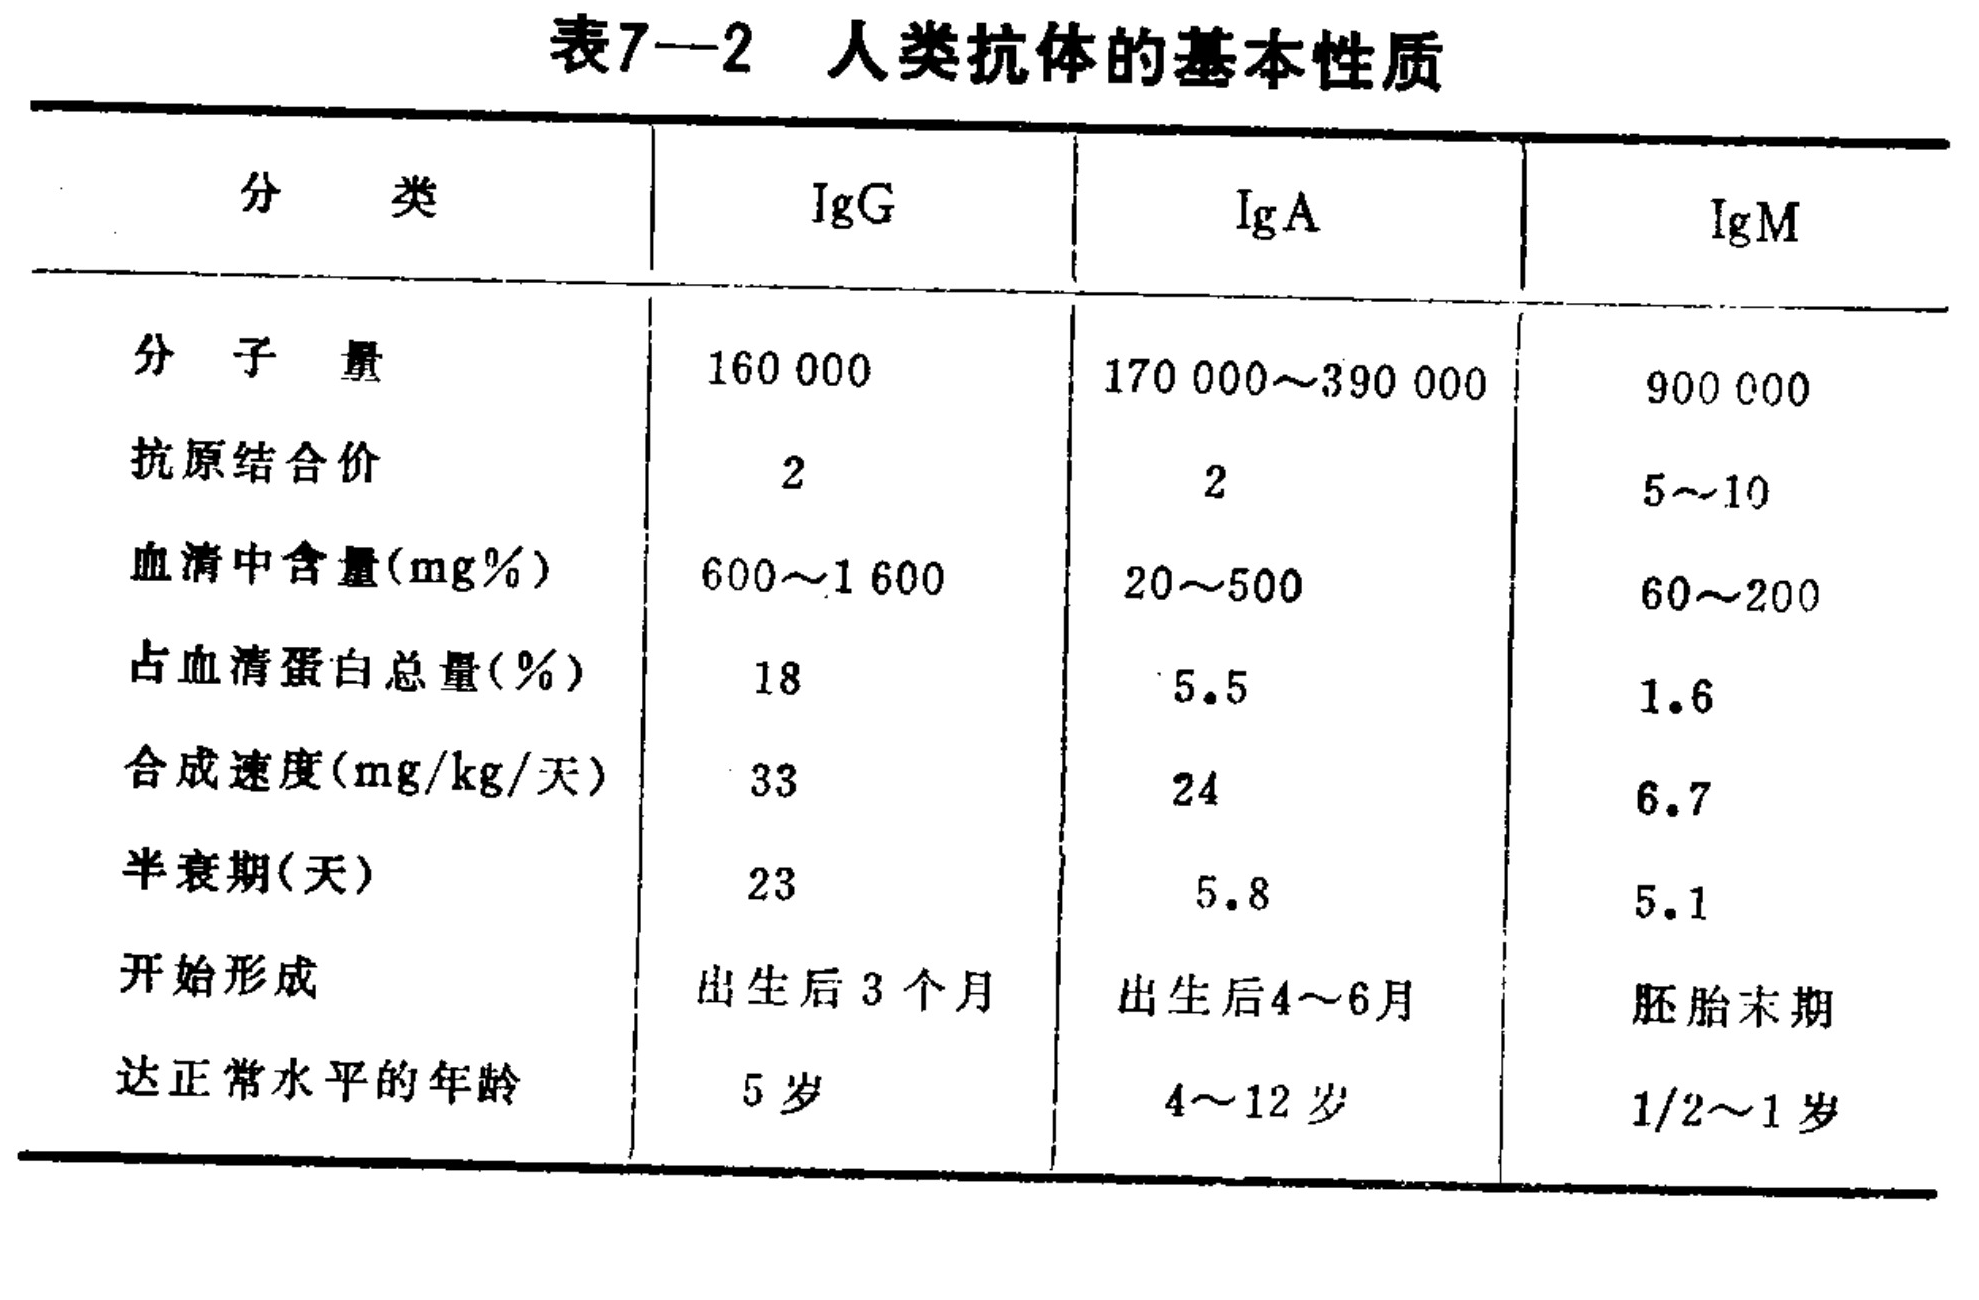
Table 7-2 Basic properties of human antibodies
Translated labels: Classification; IgG; IgA; IgM; Molecular weight; Antigen-binding valence; Serum content (mg%); Percentage of total serum protein (%); Synthesis rate (mg/kg/day); Half-life (days); Onset of formation; Age of reaching normal levels
time. Because the immune system has not yet matured during the embryonic period, after contact with self-antigens, cells bearing receptors for those antigens are destroyed or suppressed and become “forbidden clones,” and consequently no longer produce an immune response.and can synthesize and secrete antibodies capable of binding to the corresponding antigen. As for why the body already possesses such a large number of different antigen receptors after birth, there are currently two hypotheses. The first holds that gene mutations form the capacity of individuals to respond to widely existing antigens. The second is the germ-line theory, which holds that this capacity was formed during the evolution of the species, and that genes for antibodies directed against different antigens already exist in germ cells.
The immune response is a complex process. The various immune systems of the body are structurally interconnected and functionally complementary. Within nonspecific immune structures, macrophages, for example, can recognize and process antigens and transmit antigen information to immunologically active lymphocytes; complement participates in antigen–antibody reactions and thereby strengthens specific immunity. Within specific immune structures, meanwhile, lymphokines released by sensitized lymphocytes and antibodies produced by B cells can further strengthen the phagocytic action of macrophages and other cells. Cellular immunity and humoral immunity also mutually regulate and constrain each other. T-helper cells and T-suppressor cells regulate the production of antibodies by B cells; blocking antibodies and cytophilic antibodies produced by B cells can, in turn, inhibit or enhance cellular immune functions. These intricate mutual regulatory mechanisms still require further study.
Many other factors also participate in regulating the immune process. The nature of the antigen, the route by which it enters the body, and its dose all have a marked influence on the immune response. To induce an immune response, the antigen dose must be appropriate. Different doses produce different degrees of immunity; excessively high or low concentrations can both cause immunological unresponsiveness. Heredity also has an important influence on the immune response. Research in recent years has shown that, if macrophages lack Ia antigens, or if T cells lack receptors for Id antigens (both of which are determined by genetics), then the immune response is relatively low. Hereditarily caused defects in immune regulation may be an important cause of immune diseases. Age also has an influence on immunity. In general, the cellular immune function of elderly people is relatively low, which may be one of the reasons why the elderly are prone to tumors; in terms of humoral immune function, elderly people often exceed the normal level, which may be related to the susceptibility of the elderly to autoimmune diseases. Hormones are closely related to immunity. Thymic hormones can promote immune function and maintain its stability, and are indispensable for the maturation of T cells; growth hormone can affect DNA synthesis in thymic cells; adrenocortical hormones can inhibit immune responses. Nutritional status also affects immune function. For example, when protein and vitamins are deficient, antibody production may decrease. The state of nervous and mental activity has a great influence on immune regulation: high excitement, excessive inhibition, worry or depression, anger, and similar states all have adverse effects on immune responses. In reality, the body’s immune response takes place under regulation by the nervous system. Research in this area is still relatively limited, but the theory of a neuroendocrine-immune network has already been proposed. Clarifying the mutual relationships among the nervous system, the endocrine system, and the immune system will certainly greatly deepen people’s understanding of immune regulation and control.
III. Mathematical Model of Immune Regulation
Because the process of immune regulation is very complex, and because many questions have not yet been clarified, the immune-system model discussed here is relatively preliminary. Nevertheless, it can already be seen that the model is helpful for developing a deeper understanding of immune regulation and control.
1. The Antibody-Regulation Process
First, let us analyze antibody regulation from the viewpoint of feedback control. Stem cells produced by the bone marrow differentiate into macrophages, T cells, and B cells. Under the action of an antigen, B and T cells differentiate further; B cells proliferate and develop into plasma cells. Plasma cells synthesize and secrete antibodies that can bind to the antigen that induced them, and the antigen loses its activity when it binds to an antibody. As the free antigen decreases, the production of plasma cells also decreases. This is likewise a negative-feedback process. Figure 7-4 is a diagram of this immune-regulation process.
Under certain assumptions, a mathematical model describing this process can be written. If only the principal variables of this process are considered—antigen (V), plasma cells (C), antibodies (F), and damaged tissue (V)—the following differential equations can be obtained:
Diagram labels and connections:
- Bone marrow → stem cells
- Stem cells → T cells, B cells, and macrophages
- T cells → suppression and enhanced T cells
- B cells → memory cells and plasma cells
- Plasma cells → antibody
- Free antigen
- Binding
- Foreign antigen
The diagram uses arrows for activation/production, dashed arrows for indirect paths, and +/− marks around antigen binding to indicate positive and negative effects.
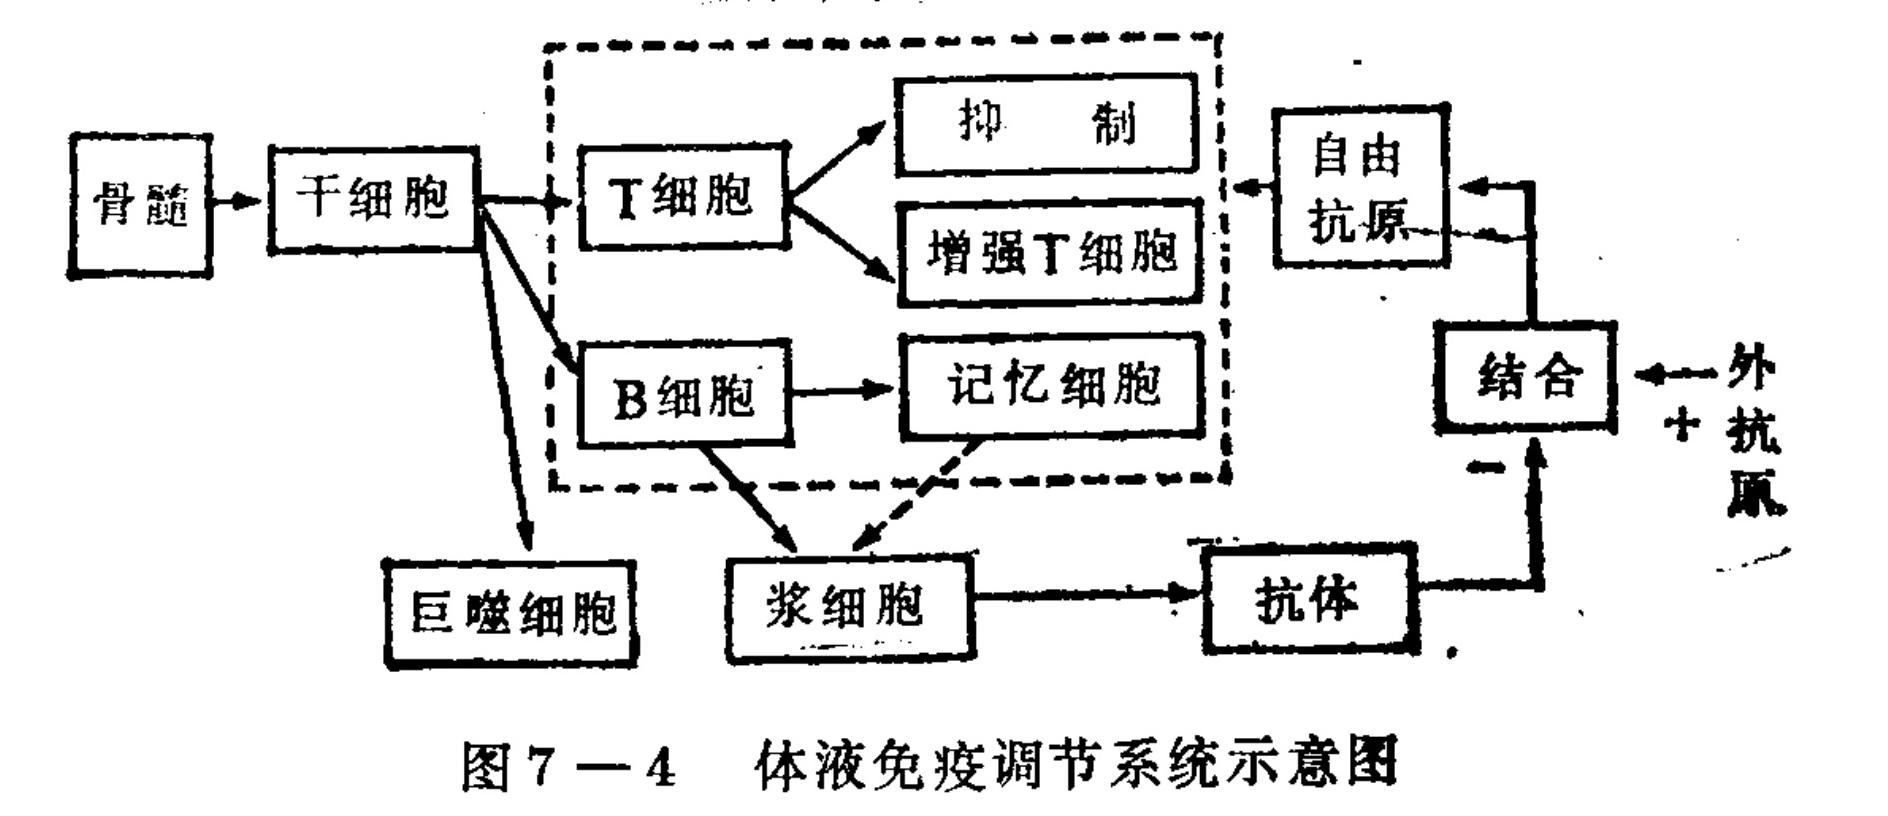
Figure 7-4. Schematic diagram of the humoral-immune regulation system
Translated labels: Bone Marrow; Stem Cells; T cells; Suppressor; Helper T cells; B cells; Memory cells; Macrophages; Plasma cells; Antibodies; Free Antigen; Combined; External Antigen
dV/dt = (β − γF)V
dC/dt = ξ(ω)·α·V(t − τ)·F(t − τ) − μ_c(C − C*)
dF/dt = ρC − (μ_f + η·γ·V)F
dm/dt = σV − μ_m m
These equations indicate that the antigen growth rate (dV/dt) is proportional to the antigen concentration, with β as the proportionality coefficient; the binding of antibody F to the antigen causes a reduction proportional to the product of the numbers of antibodies and antigens, with γ as its coefficient. After the latent period τ, the plasma-cell production rate is proportional to the product of antigen and antibody. This is because the action of T_H cells (proportional to F) has been taken into account. In the antibody equation, the μ_fF term reflects the antibody’s own decay; η, γ, V, and F form the reduction due to binding with the antigen. The antibody-production rate is proportional to the number of plasma cells, with ρ as the proportionality coefficient. Finally, tissue destruction caused by the antigen is assumed to be proportional to the amount of antigen, while the μ_m m term represents the tissue-regeneration rate. These equations can basically reflect the process of viral infection.
A theoretical analysis of these equations, according to the dynamics of the process, permits viral infections to be divided into four types and the conditions for each type to be found. Figure 7-5 shows the first type: the dynamic process obtained by computer simulation when there are no clinical symptoms. Figure 7-6 shows the case of acute onset, in which the virus rises rapidly and then declines quickly. Figure 7-7 shows the computer-simulation result for a chronic illness.
The fourth type is fatal disease; in this case the virus grows without limit and the tissue is completely destroyed. The parameters corresponding to the different types of process are also different.
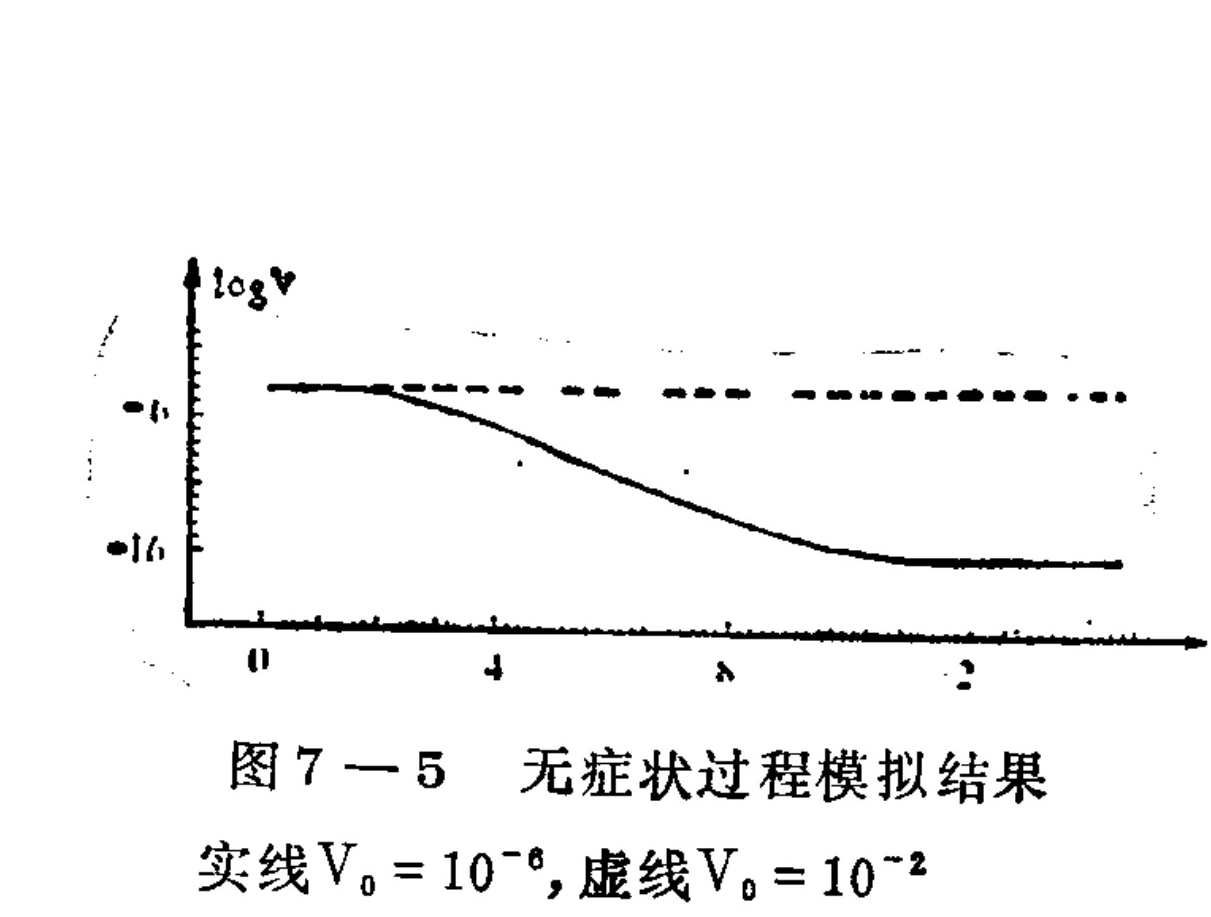
Figure 7-5. Simulation result for the asymptomatic process
Translated labels: log V; Solid line V0=10^-6; Dashed line V0=10^-2
Solid line , dashed line
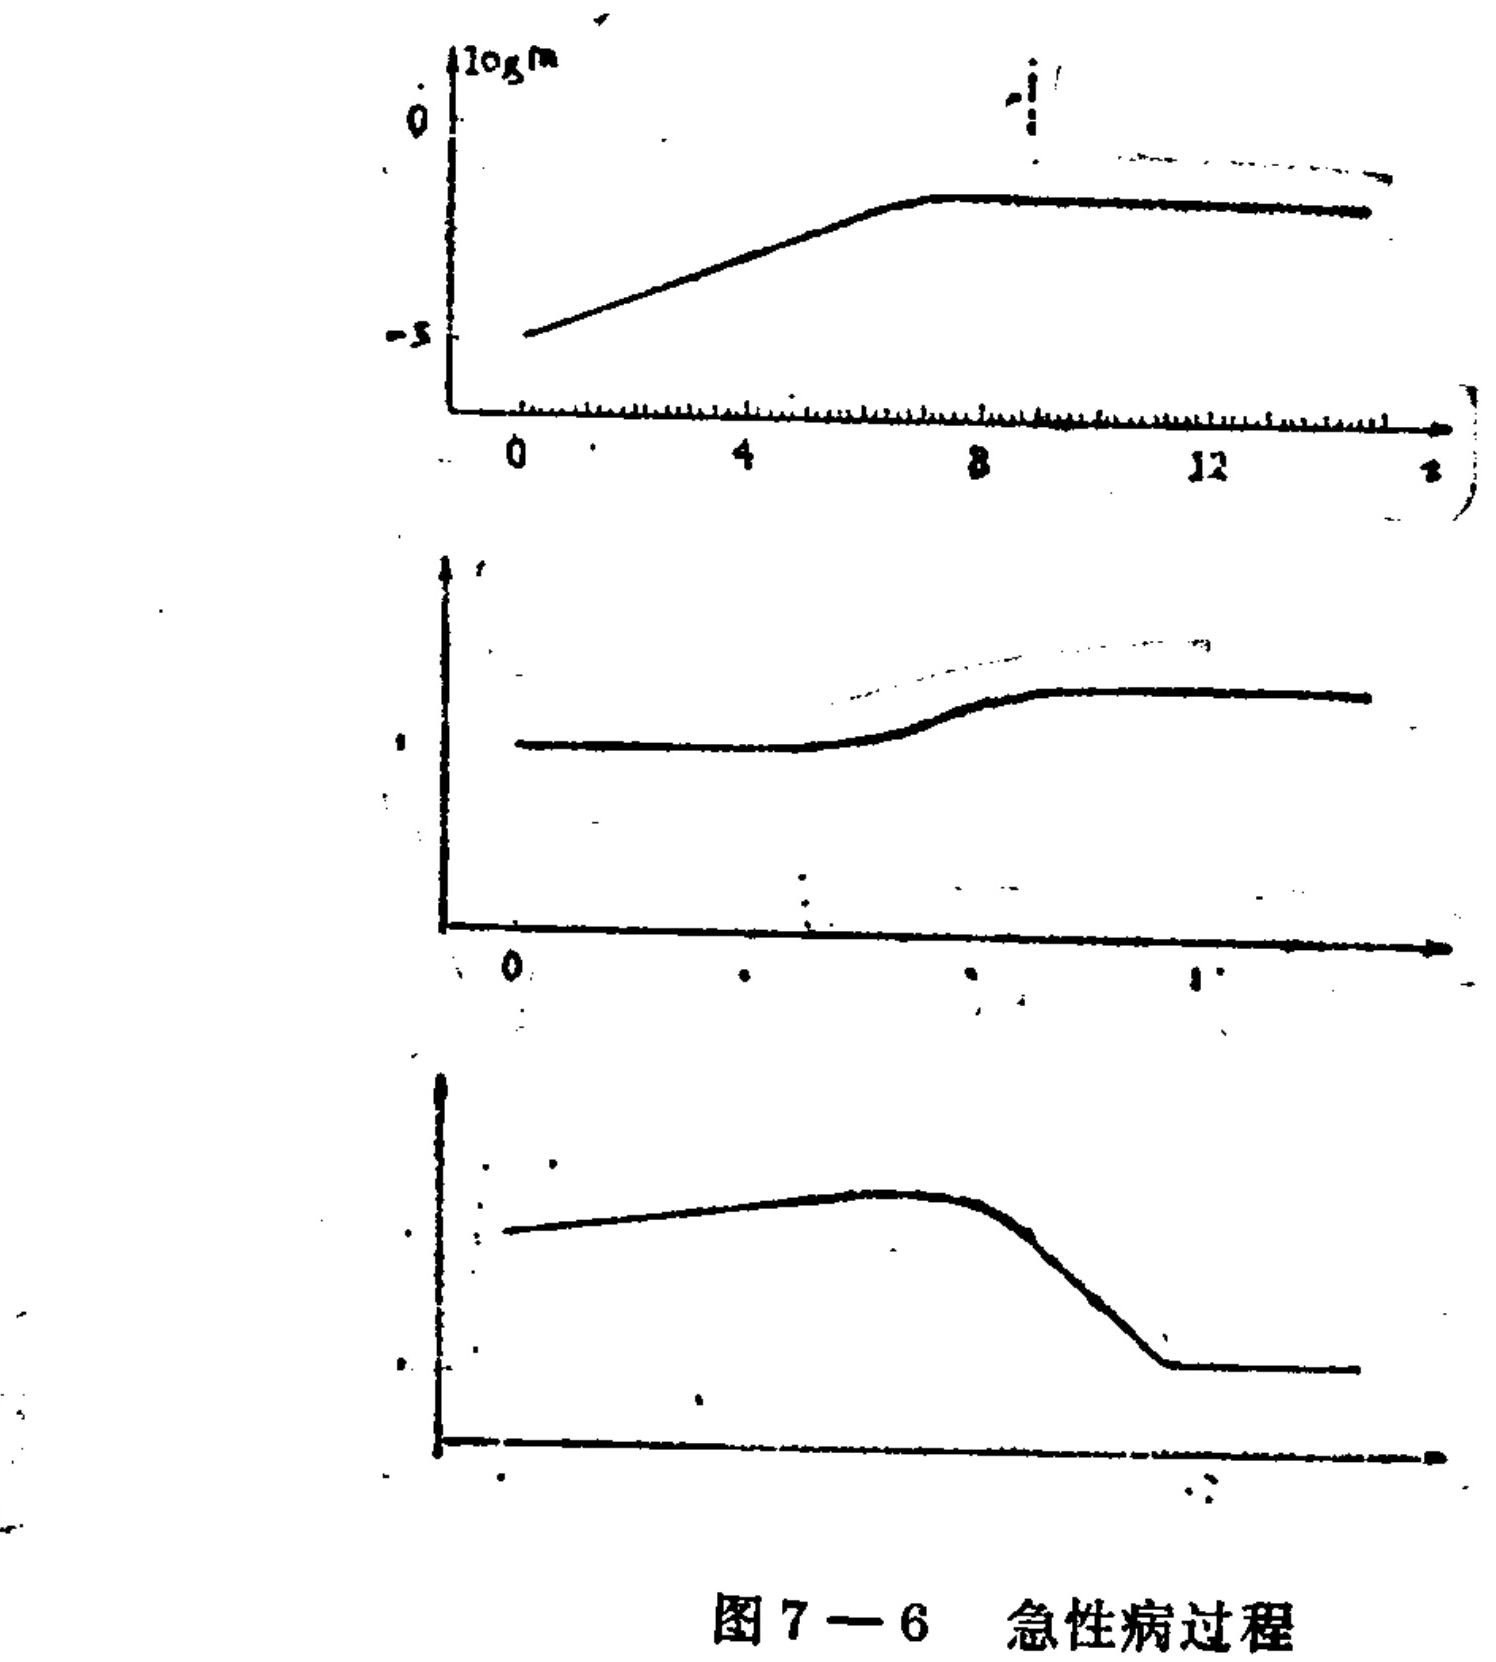
Figure 7-6. Acute-disease process
Translated labels: log m; -5; 0; 4; 8; 12
0
-5
0 4 8 12 t
0
On the basis of this basic mathematical model, a new method for treating chronic disease was also proposed.
As can be seen from Figure 7-7, in chronic disease the concentration of the virus (antigen) is too low to elicit a sufficiently strong immune response. One may therefore imagine artificially injecting an antigen V₁ that causes no pathological reaction. Because immune resources are limited, the body’s immune system relaxes its control over antigen V₂, which causes the chronic disease; the disease is temporarily aggravated and V₂ increases. After several weeks, injection of V₁ is stopped. At that point the immune system can produce sufficient antibodies to eliminate virus V₂.
To achieve this purpose, a necessary condition is that V₁ ≫ V₂ during those several weeks. Figure 7-8 shows the result obtained by computer simulation of this treatment plan; it can be seen that the expected result was achieved. It is said that this method was successfully applied in an experiment on the author himself. However, this treatment causes temporary damage to tissue and should be undertaken with caution.
Graph panels:
- log m: y-axis ticks 0 and −5; x-axis ticks 0, 20, 40, 60, 80, 100, t.
- log F: y-axis ticks 2, 0, and −2; x-axis ticks 0, 20, 40, 60, 80, 100, t.
- log V: y-axis ticks −6 and −16; x-axis ticks 0, 20, 40, 60, 80, 100, t.
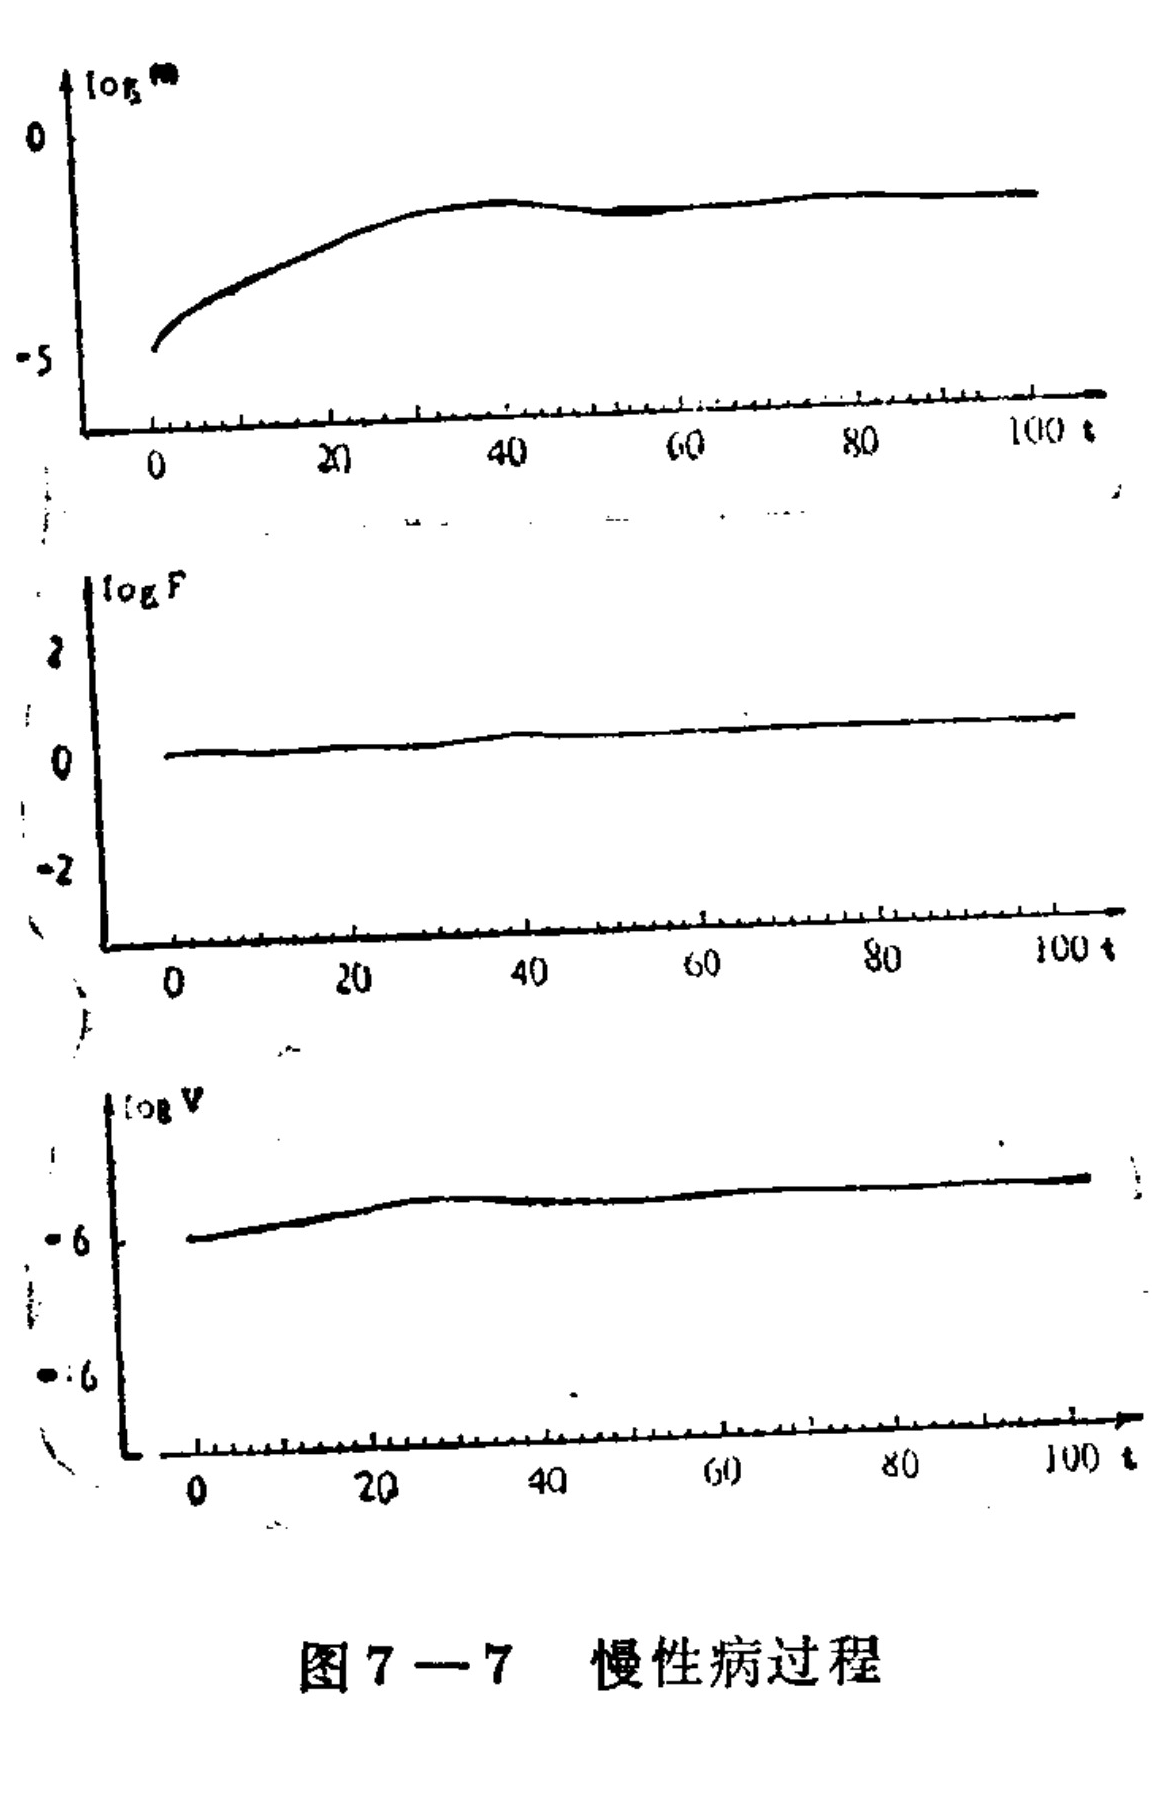
Figure 7-7. Chronic-disease process
Translated labels: log m; log F; log V; t
A model has already been established that includes macrophages, B cells, and T cells, but it is relatively complex. This will not be discussed further here. Mathematical models of immune regulation have been applied to study immune regulation.
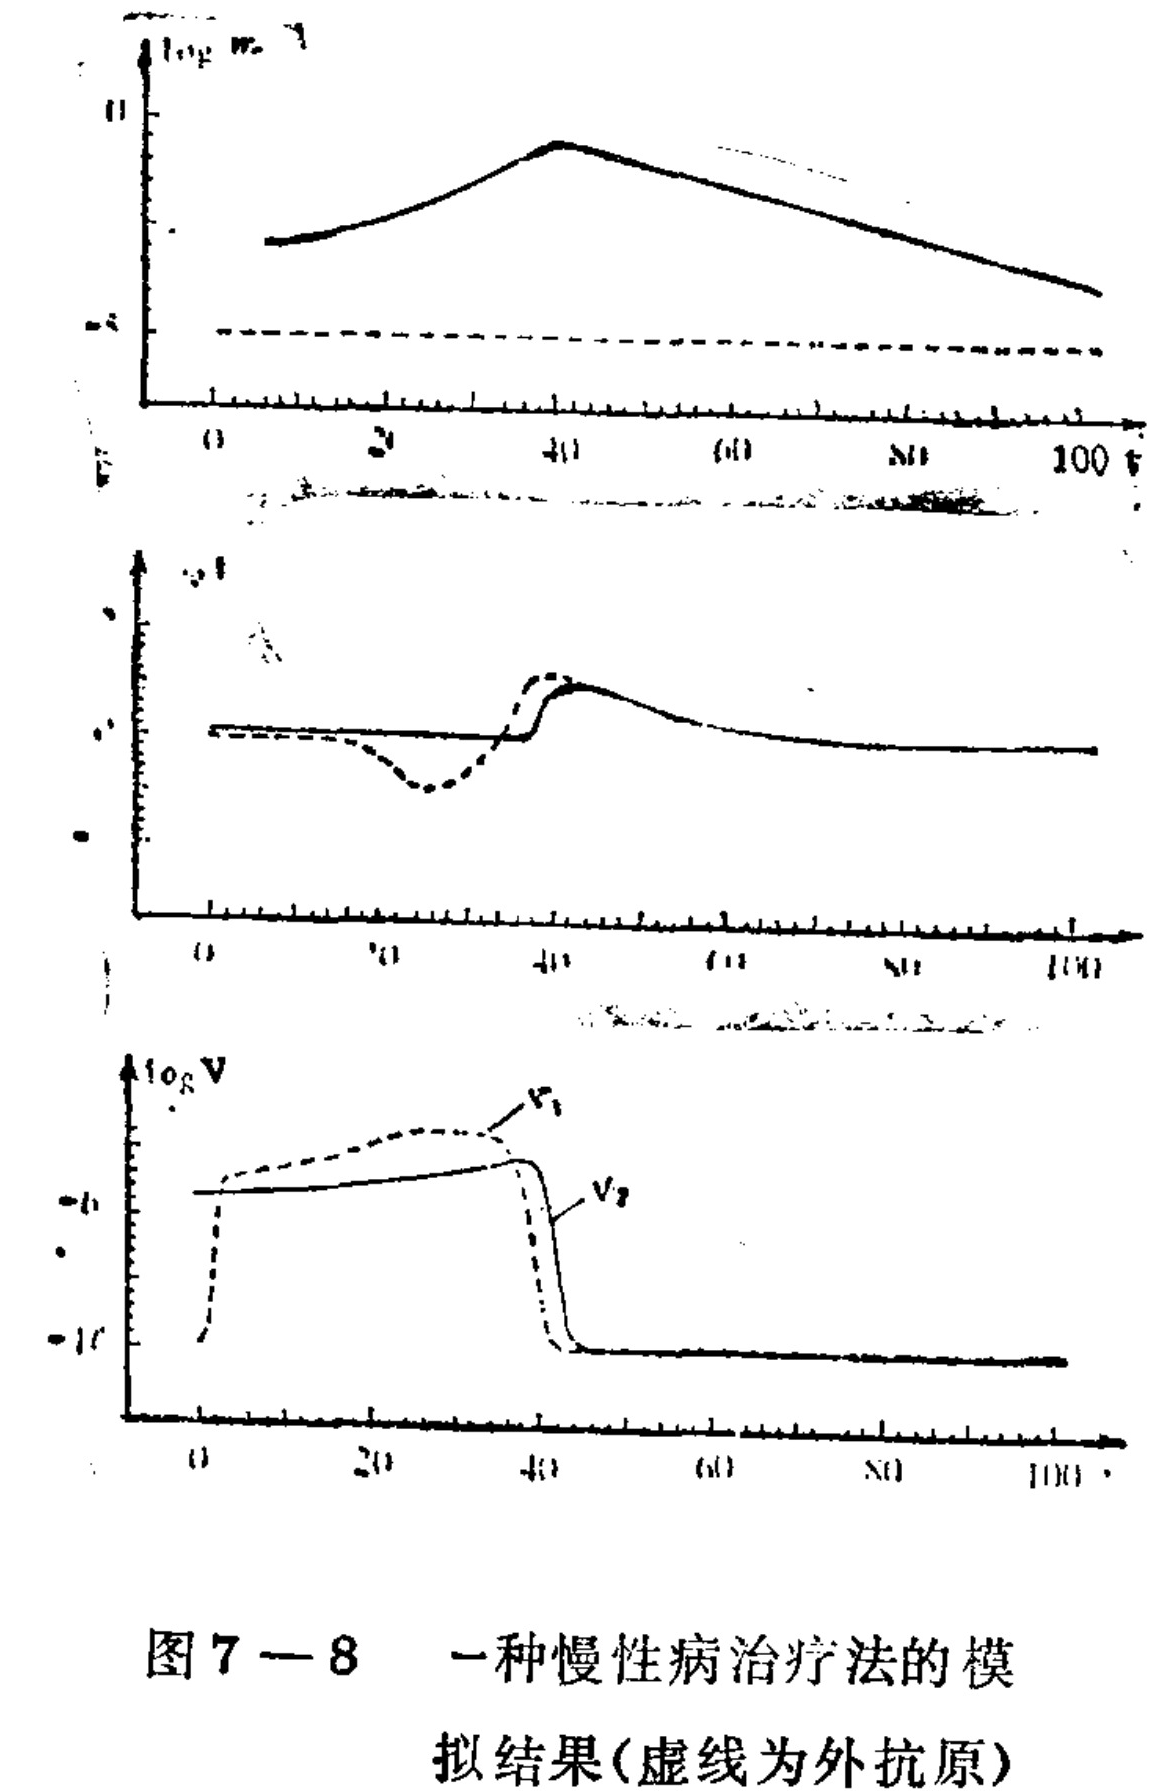
Figure 7–8. Simulation results for a treatment method for a chronic disease (the dashed line represents the external antigen).
Translated labels: t; 100; log V; V1; V2
The principles have also been applied to reveal that the transition from antibody IgM to IgG operates according to the principle of time-optimal control. This indicates that, during evolution, the organism has enabled the immune system to acquire this optimal performance. Research on autoimmune diseases and their treatment models—for example, systemic lupus erythematosus—has established treatment plans that suppress antibody production while minimizing tissue destruction. These correspond to avoiding sunlight, bed rest, and high-dose corticosteroids. This model shows that the treatment is effective and suggests that increasing the initial dose would produce better results.
2. Model of the clinical course of hepatitis B
Hepatitis B is a disease caused by a single pathogen, but its clinical manifestations are diverse. They include severe hepatitis, subacute hepatic necrosis, acute hepatitis that is easily cured, chronic hepatitis with mild symptoms but a long duration, and asymptomatic carriers. A small number of cases also present as a relapsing type, with periodic worsening and improvement. The reasons for these different manifestations can be explained by differences in individual immune characteristics. A mathematical model of the immune response caused by the hepatitis virus can be established; through computer simulation, the clinical manifestations described above can be reproduced, and a quantitative relationship between clinical manifestations and individual immune characteristics can be obtained.
According to Dudley’s hypothesis, the onset of hepatitis begins when immune lymphocytes attack liver cells infected by the virus. This process can be represented by Figure 7–9. To simplify the analysis, the mathematical model assumes that, at each stage of the process, the rate of change in the number of liver cells, the number of viruses, the immune strength, and so on is proportional to the input affecting it (that is, the output of the preceding link). The corresponding equations describing this process are therefore obtained:
-
After the virus enters normal cells (NOR), it changes them into infected cells (INF). Its rate of change is proportional to the product of the viral infectivity, C_vR, and the number of normal cells; therefore:
dX_INF/dt = C_vR * X_NOR -
After a certain latent period, infected cells (INF) become infectious cells (STV) capable of releasing viruses:
X_STV(t) = X_INF(t − τ) -
STV release viruses. Viral infectivity is determined by the released viruses and by neutralization by humoral and cellular immunity. Thus, infectivity C_vR is proportional to X_STV and inversely proportional to the immune neutralizing force C:
C_vR = (1/C_7) * k * X_STV -
On the other hand, T cells attack susceptible cells, damaging them and transforming them into hepatitis cells, HEP. The production rate RHEP of hepatitis cells is proportional to cellular immunity, represented as C_3 × X_STV:
RHEP = dX_HEP1/dt = C_3 * X_STV -
Hepatitis cells regenerate and become normal cells again. Their rate of change is proportional to the liver-cell regeneration coefficient C₂:
dX_NOR1/dt = C_2 * X_HEP1 = C_2 * (X_HEP1 − X_NOR1) -
The number of normal cells is determined by the difference between regenerated cells and infected cells.
X_NOR = X_NOR(O) + X_NOR1 − X_INF
The equations above together form the mathematical model of the hepatitis process. X_NOR1 is the number of regenerated normal cells; X_HEP1 is the number of cells transformed into hepatitis cells by immune destruction. The equations above, together with the corresponding coefficient values, were simulated on an electronic computer. Different parameters correspond to different situations, and the results obtained correspond to the various manifestations of the clinical course of hepatitis. Some important results are listed below.
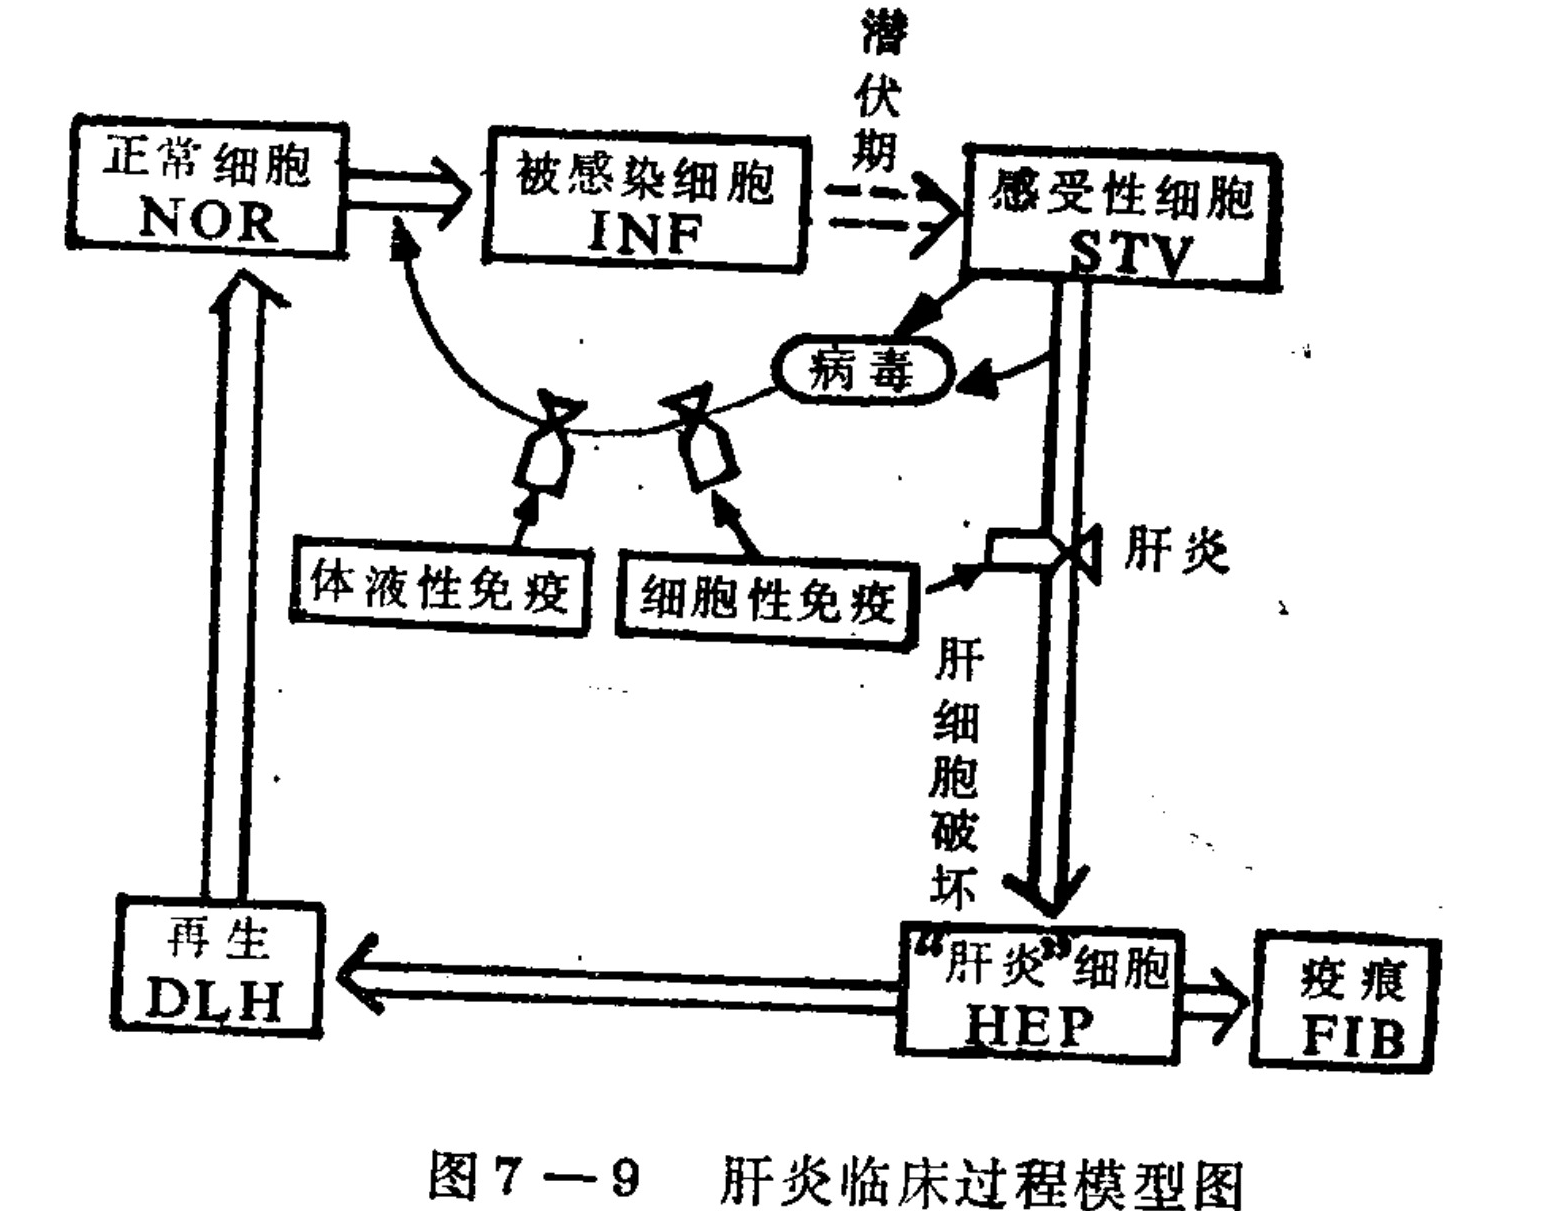
Figure 7–9 shows the model diagram with the following labels: Normal cells (NOR), Infected cells (INF), Incubation period, Susceptible cells (STV), Virus, Humoral immunity, Cellular immunity, Hepatitis, Liver cell destruction, Regeneration, DLH, “Hepatitis” cells (HEP), Scar, FIB.
Translated labels: Normal Cells NOR; Infected Cells INF; Susceptible Cells STV; Virus; Humoral Immunity; Cellular Immunity; Incubation Period; Hepatitis; Hepatocyte Destruction; “Hepatitis” Cells HEP; Regeneration DLH; Fibrosis FIB
Figure 7–9. Model diagram of the clinical course of hepatitis.
- To clarify the clinical manifestations of the hepatitis process under different immune capabilities, we selected a set of different values for C₃ (cellular immunity) and C₇ (the immune neutralizing capacity against the virus), and simulated the equations above. We used RHEP to measure the severity of symptoms; it corresponds to the transaminase value in clinical practice. The simulation produced a set of results, as shown in Figure 7–10. It can be seen from the figure that, when C₇ is at its normal value (C₇ = 2 × 10⁸), hepatitis symptoms differ greatly with different cellular-immunity values C₃. When C₃ is large, RHEP has a very high peak, indicating that liver cells are rapidly and extensively destroyed; this corresponds to severe hepatitis. When C₃ is somewhat smaller (C₃ = 0.15), the peak of RHEP is also lower and its rise time is longer, corresponding to acute hepatitis.
When Cₛ is very small (Cₛ = 0.04), the RHEP peak is not high, but it cannot return to zero. This corresponds to chronic hepatitis that is difficult to cure.
[Graph of RHEP over time. For C₇ = 3 × 10⁷, curves are labeled C₃ = 0.13, C₃ = 0.145, and C₃ = 0.2. For C₇ = 2 × 10⁸, additional curves include C₃ = 0.8. Axis values include 0.04, 0.08, and 0.15. Time is on the horizontal axis.]
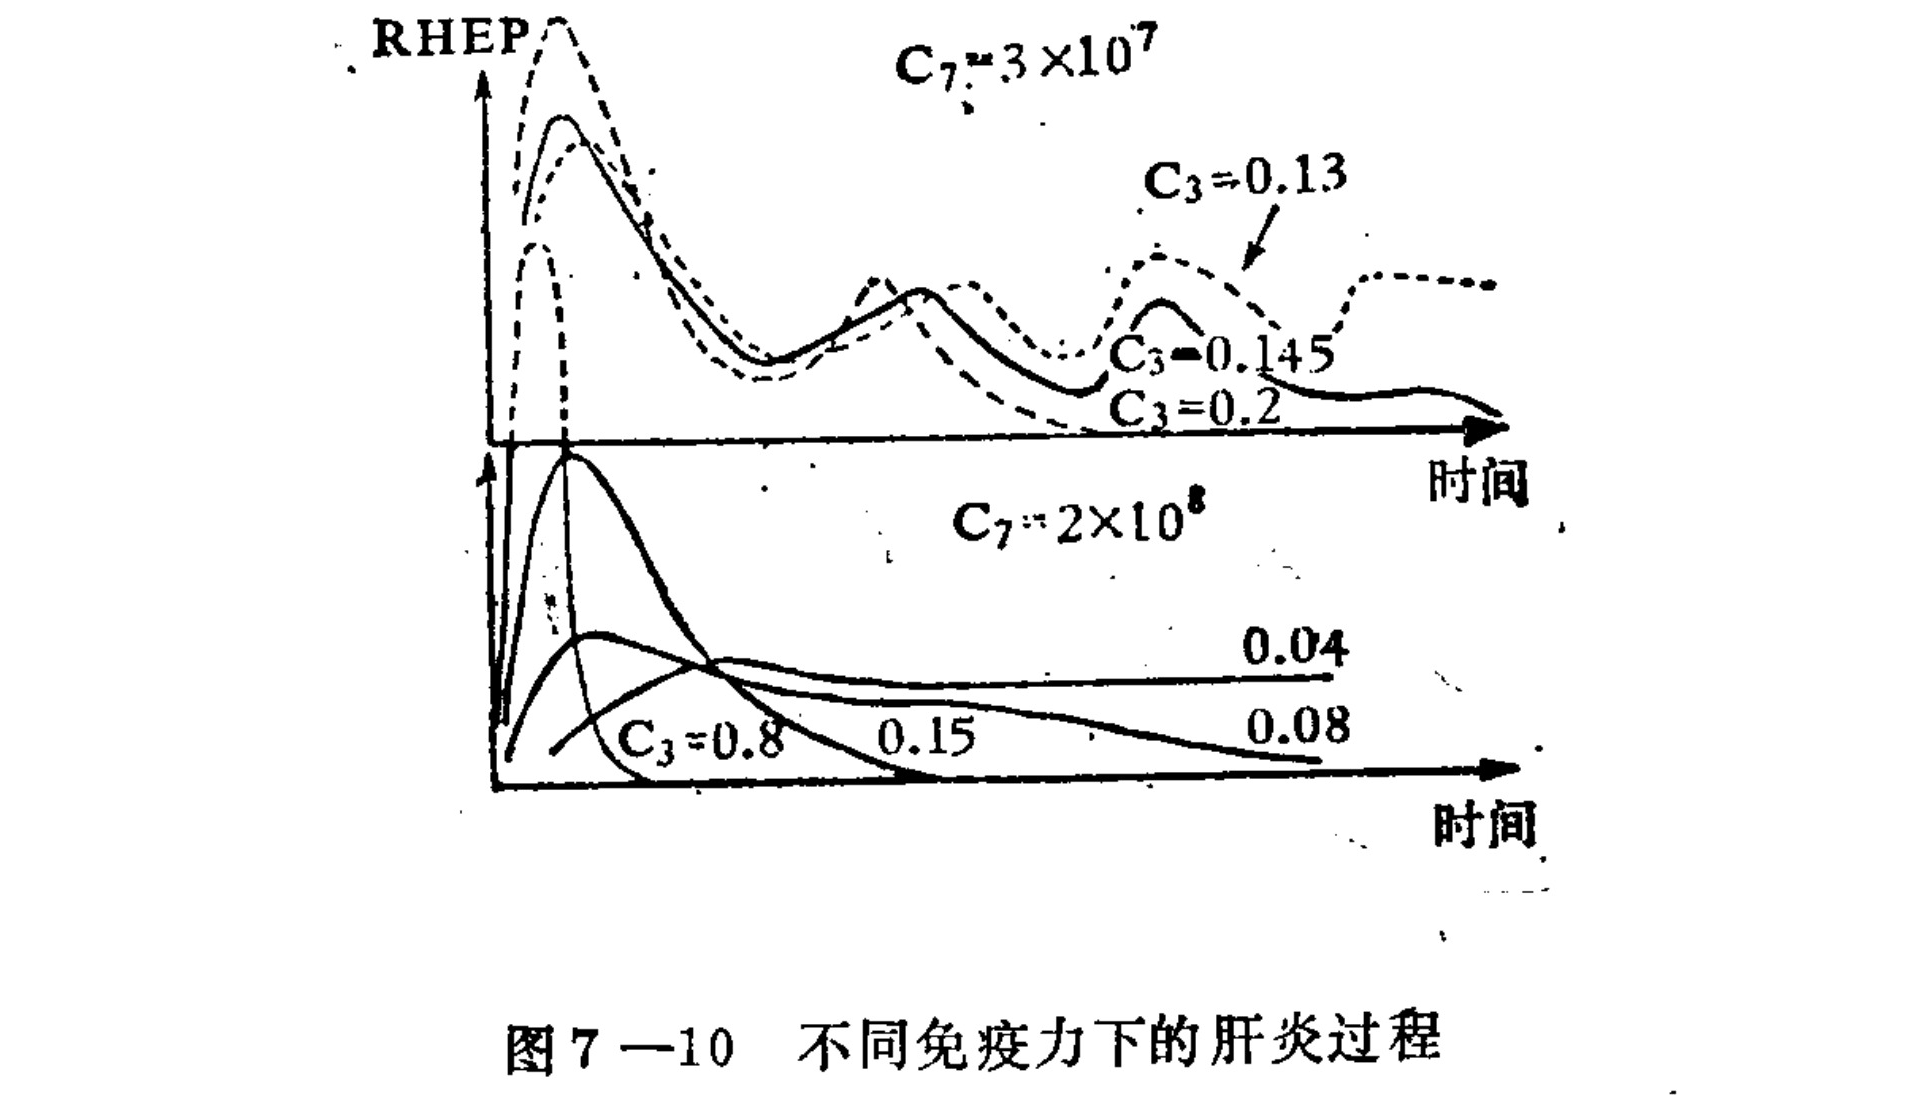
Figure 7–10. The hepatitis process under different immune strengths.
Translated labels: RHEP; Time; C7=3x10^7; C3=0.13; C3=0.145; C3=0.2; C7=2x10^8; C3=0.8; 0.15; 0.08; 0.04
- When immune function is poor, corresponding to the upper few curves in Figure 7–10, Cᵢ is relatively small (Cᵢ = 3 × 10⁷), meaning that the immune system’s ability to neutralize the virus is weak. This can be regarded as a state of immune dysfunction. As can be seen from the figure, RHEP changes periodically. After multiple peaks, it terminates (when Cₛ is relatively large), or it continues to change periodically over a long period (when Cₛ is relatively small). Figure 7–11 is a clinical record of a case of hepatitis B caused by a blood transfusion; the condition worsened once every two months. This patient was a child with aplastic anemia, and can be considered to have immune dysfunction. This is consistent with the simulation results for small Cᵢ.
[Clinical chart showing GOT and total bilirubin over time. The left vertical axis is GOT, ranging from 0 to 1500. The right vertical axis is total bilirubin, ranging from 3 to 7. Time is marked from 0 to 5 on the horizontal axis.]
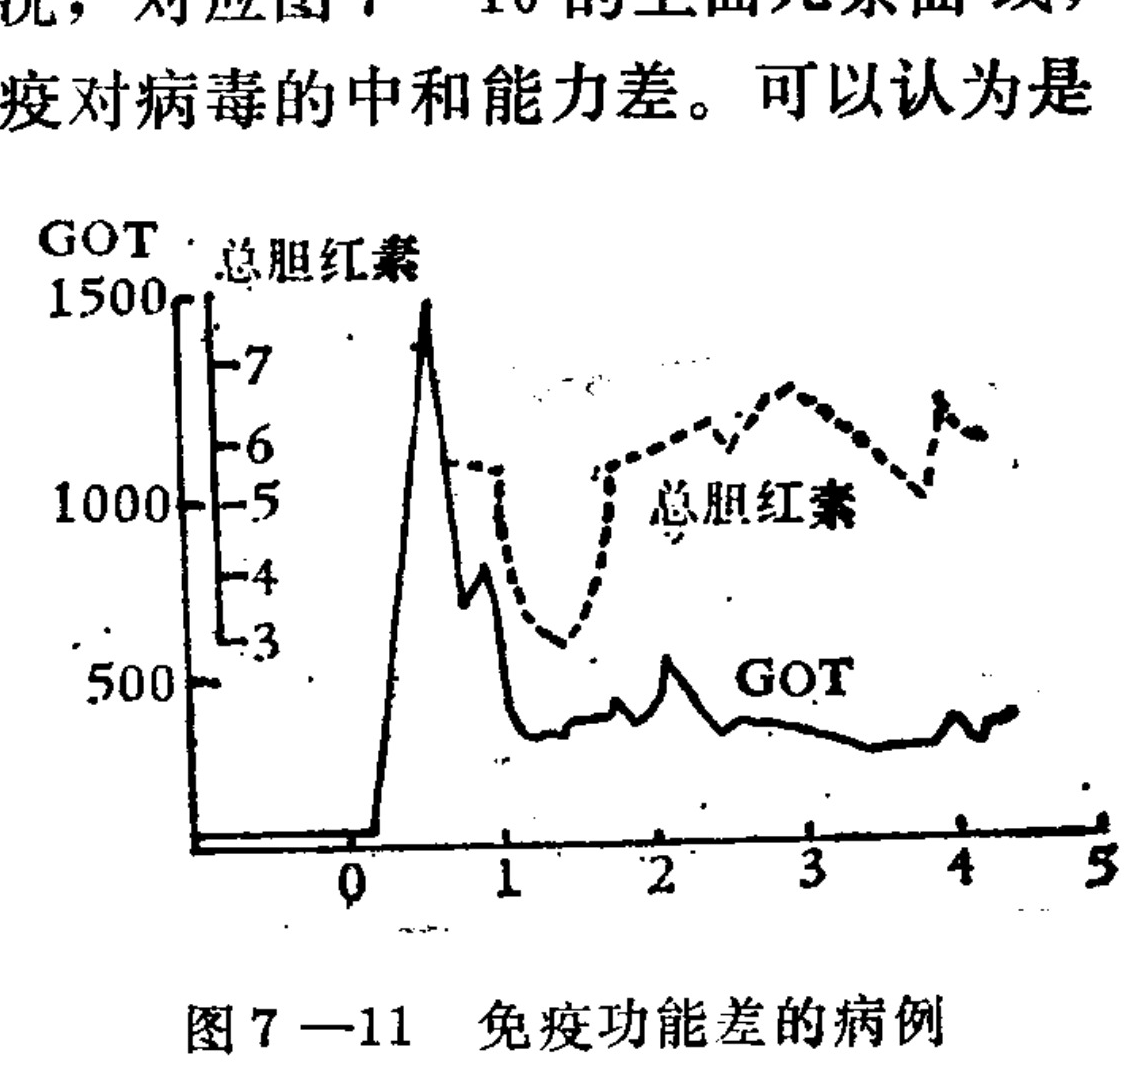
Figure 7–11. A case with poor immune function.
Translated labels: GOT; Total Bilirubin; 0; 1; 2; 3; 4; 5; 500; 1000; 1500; 3; 4; 5; 6; 7
(3) We can also use the model to study the effect of the liver-cell regeneration capacity, C, on the course of hepatitis. If the immune system’s capacity to destroy liver cells, C₁, remains unchanged, the process represented by RHEP will also remain unchanged. Figure 7–12 shows that, under different values of C, the number of hepatitis cells, XHEP, differs greatly. Clearly, when regenerative capacity is poor, XHEP will continue to increase, even reaching liver failure. This is consistent with what is seen in cases of subacute hepatic necrosis: the changes in transaminase levels may be normal, while many liver cells undergo necrosis. When regenerative capacity is strong, the number of hepatitis cells increases to a certain level and then soon decreases again. In fact, liver-cell regenerative capacity is an important factor determining the mortality rate of severe hepatitis in subacute hepatitis.
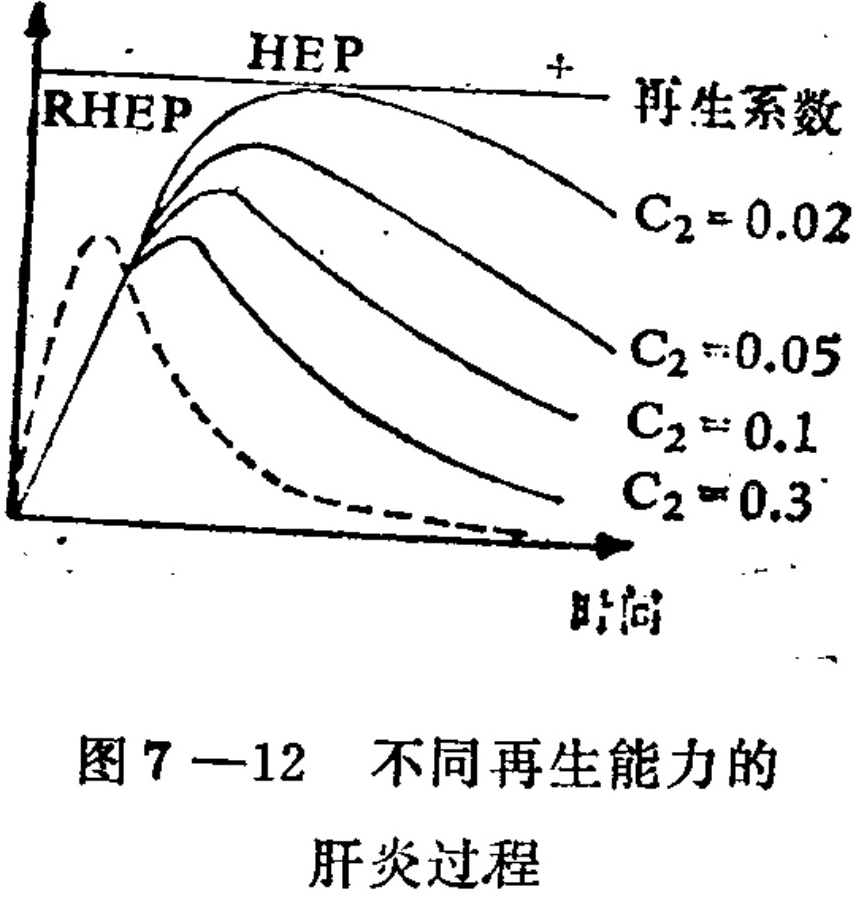
Figure 7–12. Hepatitis processes with different regenerative capacities.
Translated labels: HEP; RHEP; Regeneration coefficient; C2 = 0.02; C2 = 0.05; C2 = 0.1; C2 = 0.3; Time
The above simulation results show that, although the model incorporates many approximate assumptions, it can basically reflect the different clinical manifestations of hepatitis. Therefore, on the basis of Dudley’s hypothesis, the application of mathematical modeling and simulation can provide quantitative relationships between the clinical manifestations of hepatitis and an individual’s immune capacity and liver-cell capacity, offering a relatively reasonable explanation for the diverse clinical manifestations of hepatitis B.
IV. The Effect of Qigong on Immune Regulation
Normal functioning of the immune system is one of the necessary conditions for human health. Immune function is the effective ability to prevent and resist disease that developed during human evolution. The principal action of qigong is to stimulate the body’s inherent potential. Therefore, qigong’s ability to prevent and resist disease would seem to be related to immune function. Since people’s understanding of the process of immune regulation is still relatively limited, and observations of immune function in the qigong state are not yet sufficiently thorough, it is currently impossible to reveal the intrinsic relationship between qigong and immune function. However, judging from some of the available data, qigong appears to enhance human immune function. The specific pathway by which this occurs will depend on further research.
The content of SIgA (surface IgA) and lysozyme reflects the immune function of saliva. Zhou Zhenzhi and others at the Zhejiang Academy of Traditional Chinese Medicine observed changes in SIgA and lysozyme in saliva before and after qigong practice. The experiment was divided into three groups: a qigong-practice group (30 people), a quiet-sitting group (10 people who did not practice qigong), and an exercise group (10 people who did not practice qigong), serving as controls. The SIgA and lysozyme contents were measured before and after 40 minutes of qigong practice, quiet sitting, and exercise, respectively. The results are shown in Table 7–3.
Table 7–3. Changes in salivary SIgA and lysozyme contents before and after qigong practice (x̄ ± s)
| Group | SIgA (mg%) | Lysozyme (µg/ml) | ||||
|---|---|---|---|---|---|---|
| Before | After | Before/After comparison | Before | After | Before/After comparison | |
| Qigong group | 6.5 ± 3.5 | 12.1 ± 0.51 | P < 0.01 | 76.99 ± 52.87 | 162.95 ± 112.25 | P < 0.001 |
| Exercise group | 6.03 ± 2.8 | 5.64 ± 2.9 | P > 0.05 | 81.84 ± 53.20 | 72.86 ± 48.8 | P > 0.05 |
| Quiet-sitting group | 8.04 ± 2.7 | 7.9 ± 3.1 | P > 0.05 | … | … | … |
As can be seen from Table 7–3, after qigong practice the contents of SIgA and lysozyme in saliva increased significantly, whereas the control groups showed no significant change. This indicates that qigong has the effect of enhancing immune capacity.
The practice of qigong masters treating illnesses through external qi has prompted investigations into the mechanism of external-qi treatment, and some experiments have produced preliminary results. For example, Li Caixi and others at the Xiyuan Institute of Traditional Chinese Medicine observed the effect of external qi on the phagocytic function of mouse macrophages. The macrophages from the mouse peritoneal cavity were placed in penicillin bottles and divided into three groups. For 10 minutes, they were respectively subjected to a qigong master holding the bottle and emitting qi, an ordinary person holding the bottle, and no treatment. Using an oil-immersion lens, the phagocytic rate and phagocytic index of 100 cells were counted; the results are shown in Table 7–4.
After statistical processing (t-test), the difference between the qigong-master group and the control group was significant (P < 0.001), whereas the difference between the ordinary-person group and the control group was not significant (P > 0.5). Thus it can
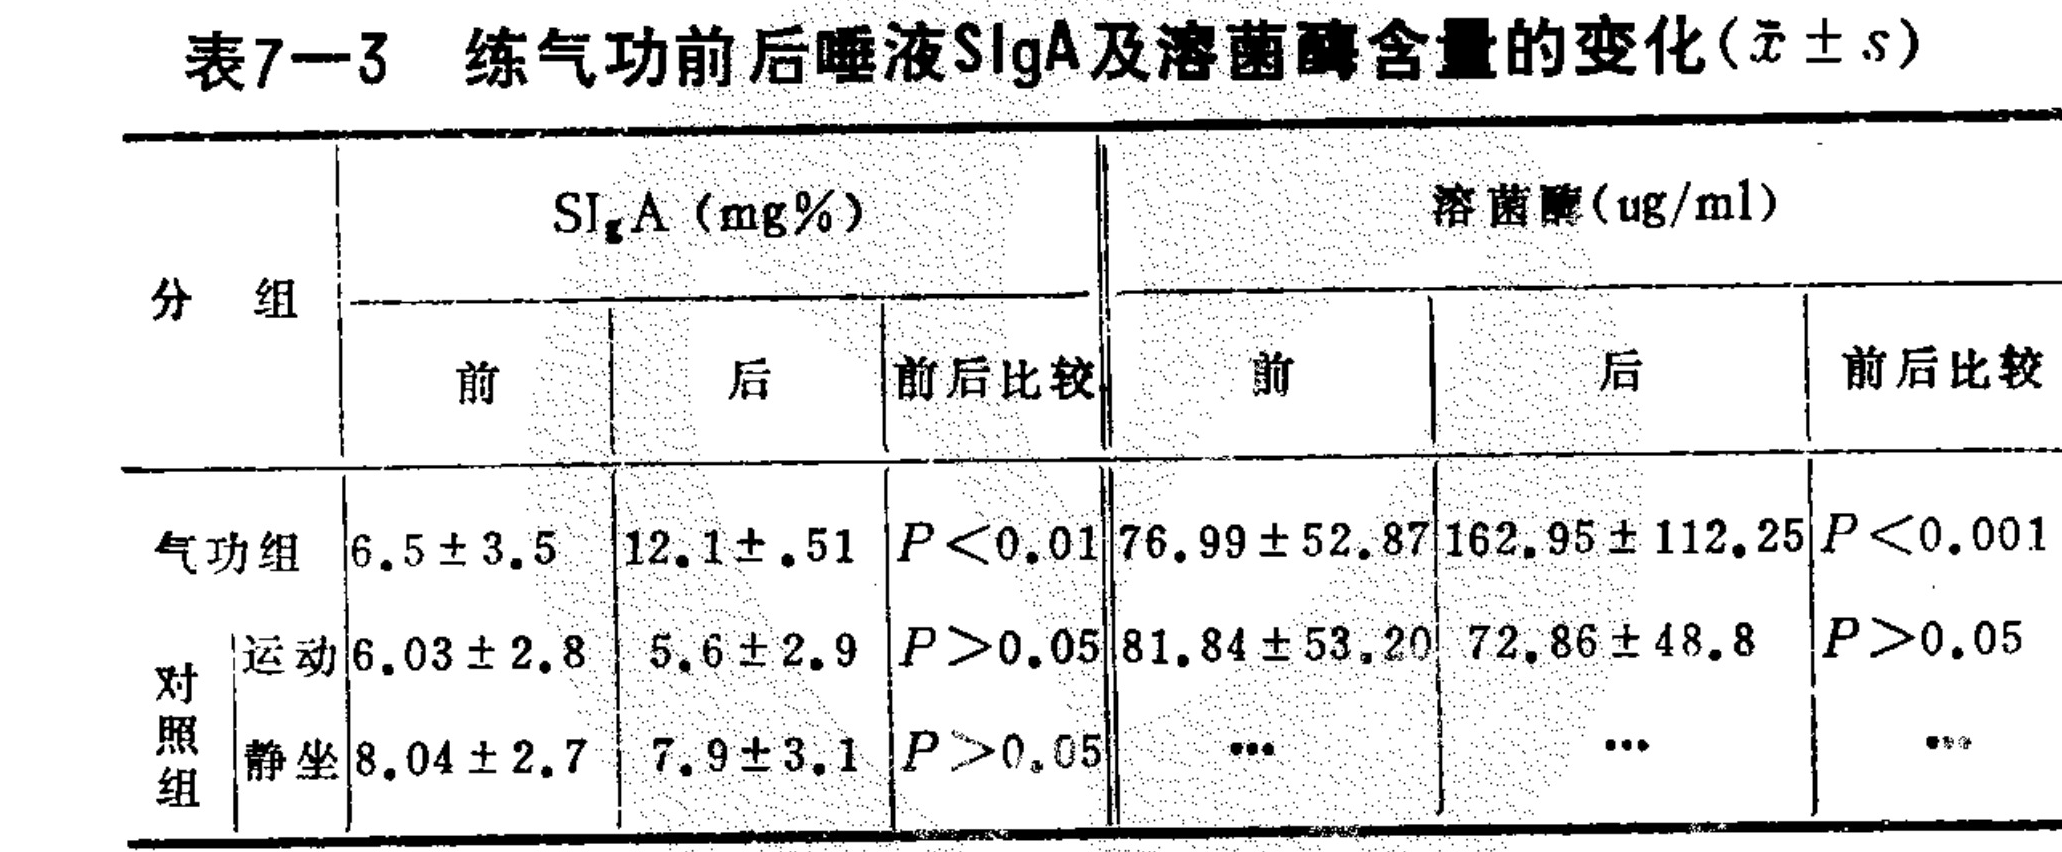
Table 7-3: Changes in salivary SIgA and lysozyme content before and after Qigong practice (mean ± SD).
Translated labels: Group; SIgA (mg%); Lysozyme (ug/ml); Before; After; Pre-post comparison; Qigong Group; Control Group; Exercise; Sitting
Table 7–4. Effect of qigong on the phagocytic action of mouse phagocytes
| Item | Qigong practitioner | Ordinary person |
|---|---|---|
| Phagocytic rate | 1.838 ± 0.053 | 0.994 ± 0.028 |
| Phagocytic index | 2.076 ± 0.143 | 1.026 ± 0.026 |
be seen that the effect of external qi is significant.
Some other experiments have also indicated that external qi may have a destructive effect on bacteria, viruses, and the like.
What is the essence of external qi? How does it act through the recipient’s body? These questions still await further investigation.
The Jiangsu Institute of Traditional Chinese Medicine and the provincial hospital of traditional Chinese medicine jointly measured immune function before and after qigong practice in healthy people and tumor patients, both among those who practiced and those who did not. For 36 tumor patients, the mean IgG measurement was 767.43 ± 330.29 mg% before practice and rose to 1,193.4 ± 323.9 mg% after practice; the difference was significant (P < 0.01). No significant differences were observed in IgA or IgM before and after practice. Among healthy people, cell counts measured by ANAE were significantly higher in practitioners than in non-practitioners (P < 0.01). For 26 tumor patients, the E-rosette test before and after qigong practice—which reflects the number of effector cells with immune function among the cells—showed that the mean rosette value rose from below the normal value into the normal range; the difference was highly significant (P < 0.001). These results indicate that qigong can improve humoral and cellular immune functions. Qigong’s capacity to regulate the immune system merits thorough investigation; this is of crucial importance for clarifying the principles by which qigong treats disease.
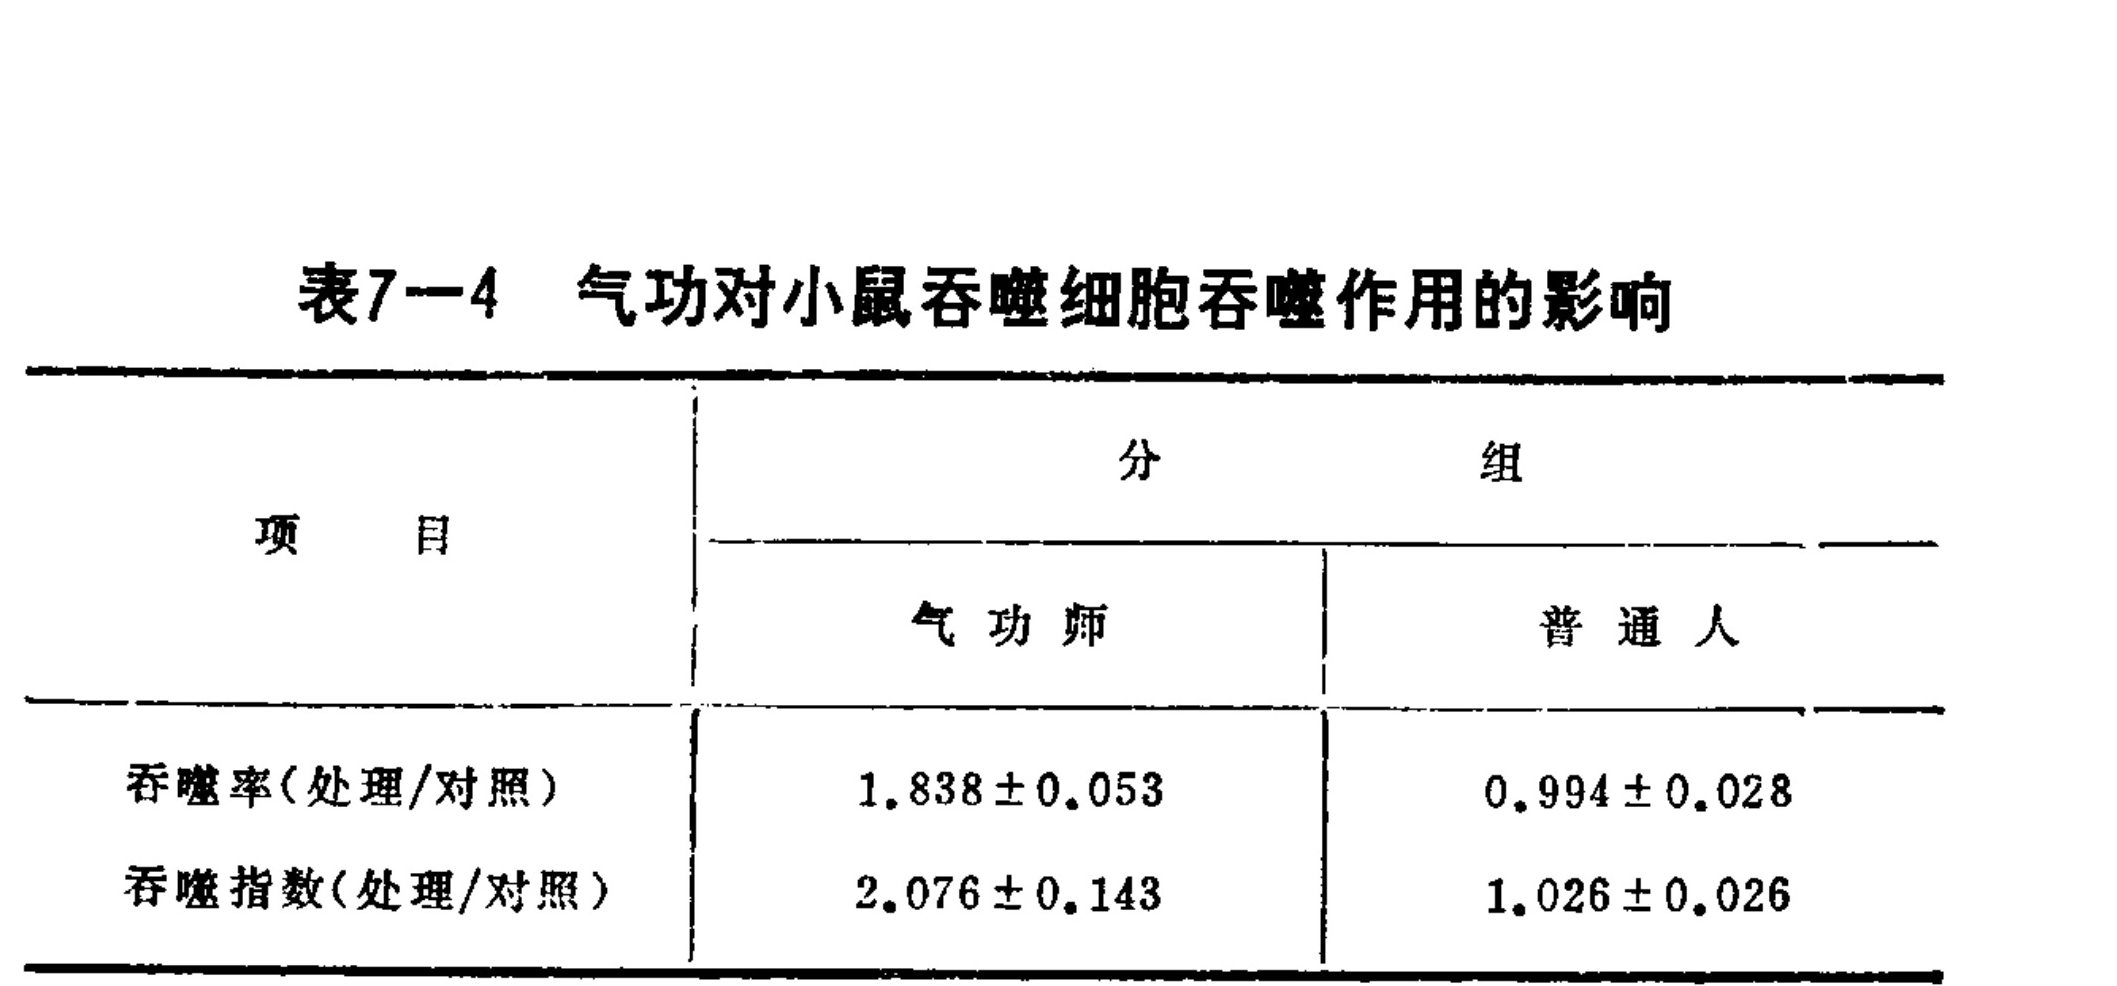
Table 7-4 Effect of Qigong on the phagocytic activity of mouse phagocytes
Translated labels: Group; Qigong Master; Ordinary Person; Phagocytosis Rate (Treatment/Control); Phagocytosis Index (Treatment/Control)
Chapter Eight: The Endocrine System and Qigong
The endocrine system is an important system in the human body. It plays an important role in realizing normal physiological functions and maintaining the stability of the internal environment. Human growth, development, maturation, reproduction, and aging are all controlled by hormones secreted by the endocrine glands. The levels at which various hormones are secreted have an important influence on human health, and many diseases are caused by endocrine disorders. Control of the body’s overall functions is accomplished mainly by two interrelated systems: the nervous system and the endocrine system. The nervous system is characterized by relatively precise localization and, comparatively speaking, rapid action; the effects of the endocrine system are more widespread and diffuse, relatively slow but more lasting. Through their coordination, these two systems exercise effective control over the body. The regulation and control of the body produced by qigong is generally relatively slow and long-lasting. Therefore, qigong’s regulation of the body may involve the function of the endocrine system. This chapter will discuss the functions of the endocrine system and the principles of hormone action, the regulation and control of the endocrine system, mathematical models of endocrine-system regulation, and the effects of qigong on the endocrine system, among other issues.
I. The Functions of the Endocrine System and the Principles of Hormone Action
The endocrine system is an important functional regulatory system of the human body. It consists of various endocrine glands and tissues in different parts of the body. The active substances secreted by endocrine glands are called hormones. Endocrine secretion differs from exocrine secretion in that it has no specialized ducts; instead, the hormones secreted are released into the blood and transported throughout the body by the circulation. Each hormone has corresponding sensitive tissues and organs. Only after these tissues and organs receive the hormonal information can they perform their regulatory functions. The functions of the endocrine glands are directly or indirectly influenced by the nervous system; at the same time, hormones also play an important role in neural activity.
The principal endocrine glands of the human body are the adrenal glands, thyroid, pancreatic islets, testes and ovaries, and pituitary gland, among others. The corresponding hormones include adrenaline, adrenal cortical hormones, thyroxine, insulin, sex hormones (testosterone, estradiol, progesterone, etc.), and anterior pituitary hormones (thyroid-stimulating hormone, adrenocorticotropic hormone, gonadotropic hormones, growth hormone, prolactin, and others). Different hormones have different functions. The functions of some important hormones are briefly described below.
Adrenaline and noradrenaline are hormones secreted by the adrenal medulla. Their principal function is to regulate the cardiovascular system; both can increase the force of cardiac contraction and accelerate the heart rate. Their effects on the blood vessels differ: adrenaline constricts the small blood vessels of the skin, mucous membranes, and viscera while dilating the blood vessels of skeletal muscle, whereas noradrenaline constricts the small arteries and small veins throughout the body. Both increase blood flow through the coronary vessels. Adrenaline can also promote the breakdown of glycogen in the liver and muscles, converting liver glycogen into glucose and raising blood glucose.
The adrenal cortex mainly secretes three classes of hormones: glucocorticoids (hydrocortisone), mineralocorticoids, and androgens. Glucocorticoids regulate the metabolism of the three major nutrients. They promote gluconeogenesis in the liver, increase glycogen reserves, promote protein breakdown, and affect the redistribution of fat. When harmful stimulation of the body causes a stress response, large amounts of adrenal cortical hormones are secreted. This plays an important role in enabling the body to adapt to such harmful stimuli, although the exact mechanism is not yet clear. Excess hydrocortisone can cause dissolution of lymphoid tissues in the thymus, lymph nodes, and other immune structures. Cortisone also has anti-inflammatory and anti-allergic effects and inhibits the systemic effects of bacterial toxins; large amounts of cortisone can inhibit antibody formation.
Mineralocorticoids mainly consist of aldosterone. Their action can be summarized as “retain sodium and excrete potassium.” Because they promote substantial reabsorption of sodium ions in the kidneys, they also increase the reabsorption of water. Aldosterone also has glucocorticoid functions, but its action is weaker, approximately one-third that of glucocorticoids.
Androgens promote masculinization of the human body.
The thyroid is the largest endocrine gland in the human body. The thyroxine it secretes promotes oxygen consumption by the body, increases the oxidation rate of the great majority of cells, increases heat production, and raises the basal metabolic rate. Thyroxine promotes glucose absorption by the small intestine, mobilizes fat, accelerates fat oxidation and breakdown, and promotes both protein synthesis and protein breakdown. Thyroxine is an important factor in the body’s growth, development, and maturation. Without thyroxine, thyroid hormone, growth hormone cannot function effectively. Children with hypothyroidism grow slowly and have small bones. Thyroid hormone can increase the excitability of the nervous system; a deficiency of thyroxine can cause intellectual impairment and declining memory. Thyroxine also clearly strengthens the activity of the cardiovascular system. When thyroid function is excessive, the symptoms include profuse sweating and warm, moist skin. Conversely, when thyroid function is deficient, the skin becomes pale and skin temperature falls.
Insulin is a hormone secreted by the B cells of the pancreatic islets. It is the principal factor regulating carbohydrate, protein, and fat metabolism and maintaining blood glucose at a normal level. Insulin promotes the use of glucose by peripheral tissues, increases the storage of glucose in tissues—especially in the liver—and inhibits gluconeogenesis, thereby lowering blood glucose. In normal people, the blood-glucose value is 100 milligrams per 100 milliliters. When the blood-glucose value exceeds the renal threshold for glucose (approximately 150–180 milligrams per 100 milliliters), glucose is excreted in the urine, producing glucosuria. When insulin is deficient, tissues cannot use glucose effectively and rely on fat and protein to provide the energy required by the body, thereby causing emaciation. In addition, because of the lack of glucose within cells, activity of the hypothalamic satiety center is inhibited while activity of the feeding center is strengthened, increasing appetite. Thus, the principal manifestations of diabetes are “three increased and one decreased”: increased urination, increased drinking, increased eating, and reduced body weight. Insulin can also promote fat synthesis and inhibit fat breakdown; it also promotes protein synthesis.
The ovary is the principal reproductive organ. It both produces ova and secretes hormones. The ovary mainly secretes estrogen, progesterone, and small amounts of androgens. Estrogen promotes the development of the female accessory reproductive organs and the appearance of secondary sex characteristics; strengthens the force and frequency of contractions of the smooth muscle of the fallopian tubes and uterus; and can also inhibit pituitary secretion of follicle-stimulating hormone and related hormones. The principal function of progesterone is to cause secretory-phase changes in the uterine lining, favoring implantation of the fertilized egg; reduce smooth-muscle activity in the uterus and fallopian tubes; inhibit secretion of luteinizing hormone; and stimulate development of the mammary alveoli.
Growth hormone is an important hormone secreted by the pituitary gland. It can act directly on cells and tissues throughout the body, increasing cell size and number and promoting body growth. Excess or deficiency of growth hormone during childhood leads, in adulthood, to the abnormally great stature of “gigantism” or the abnormally short stature of dwarfism. The pituitary’s secretion of various other tropic hormones plays an important role in hormonal regulation; this will be discussed in the next section.
The preceding discussion covered only the basic physiological functions of several important hormones. Some hormones have not yet been considered, and the interactions among the various hormones have also not been discussed. There are also hormones with mutually antagonistic effects. For example, glucagon released by the pancreatic alpha cells has an effect antagonistic to that of insulin, and together they complete the task of regulating blood glucose. Likewise, the parathyroid secretes parathyroid hormone and calcitonin; their functions are opposite yet complementary, and together they regulate the calcium-concentration level of extracellular fluid.
The concentration of hormones in the blood is generally very low, but they can exert important effects. Their physiological functions are not performed directly by the hormones themselves; rather, hormones stimulate target cells and, through a series of amplification processes, increase their effects. According to their mechanisms of action, human hormones can be divided into two major classes. One class consists of nitrogen-containing hormones, including amine, peptide, and protein hormones; the other consists of steroid hormones. The actions of the two classes differ, but both begin with the binding of a hormone to a receptor and, through transmission by a second messenger, form a multilevel amplification system that produces the physiological effect.
Nitrogen-containing hormones generally do not enter target cells. After binding to receptors on the target-cell membrane, they activate adenylate cyclase (AC) on the membrane. AC then catalyzes the conversion of adenosine triphosphate into cyclic adenosine monophosphate (cAMP). cAMP promotes protein phosphorylation, affecting enzyme activity and DNA transcription and thereby producing the physiological effects of the hormone. The hormone is the first messenger, while cAMP is the second messenger. cAMP not only transmits information but also amplifies biological effects. That is, a minute amount of hormone binds to receptors on the target-cell membrane, and the resulting generation of cAMP produces a first level of amplification of the hormone’s action inside the cell. cAMP activates protein kinase; through phosphorylation, it activates the intracellular glycolytic system, producing a second level of amplification.
This information transmission and amplification can be illustrated by the action of glucagon on fat cells. Figure 8-1 is a schematic model of the process by which glucagon acts on target cells to produce fatty acids plus glycerol. If symbols from a semiconductor triode amplifier circuit are borrowed to represent the “amplification” function of this process, the “circuit diagram” shown in Figure 8-2 can be obtained. In the diagram, inactive substances are treated as the source (the “power supply”), such as the concentration levels of ATP, protein kinase, and inactive lipase. The enzyme that triggers a particular activation reaction is treated as the input to the “base,” while the product is on the “collector” as the output.
as the output. It can be seen that this effect process is equivalent to a multistage amplifier.
[Diagram labels, Figure 8-1: blood flow; target cell; hormone (glucagon); receptor; adenylate cyclase (AC); cAMP; inactive lipase; biochemical reaction; first-stage amplification; second-stage amplification; fatty acids and glycerol.]
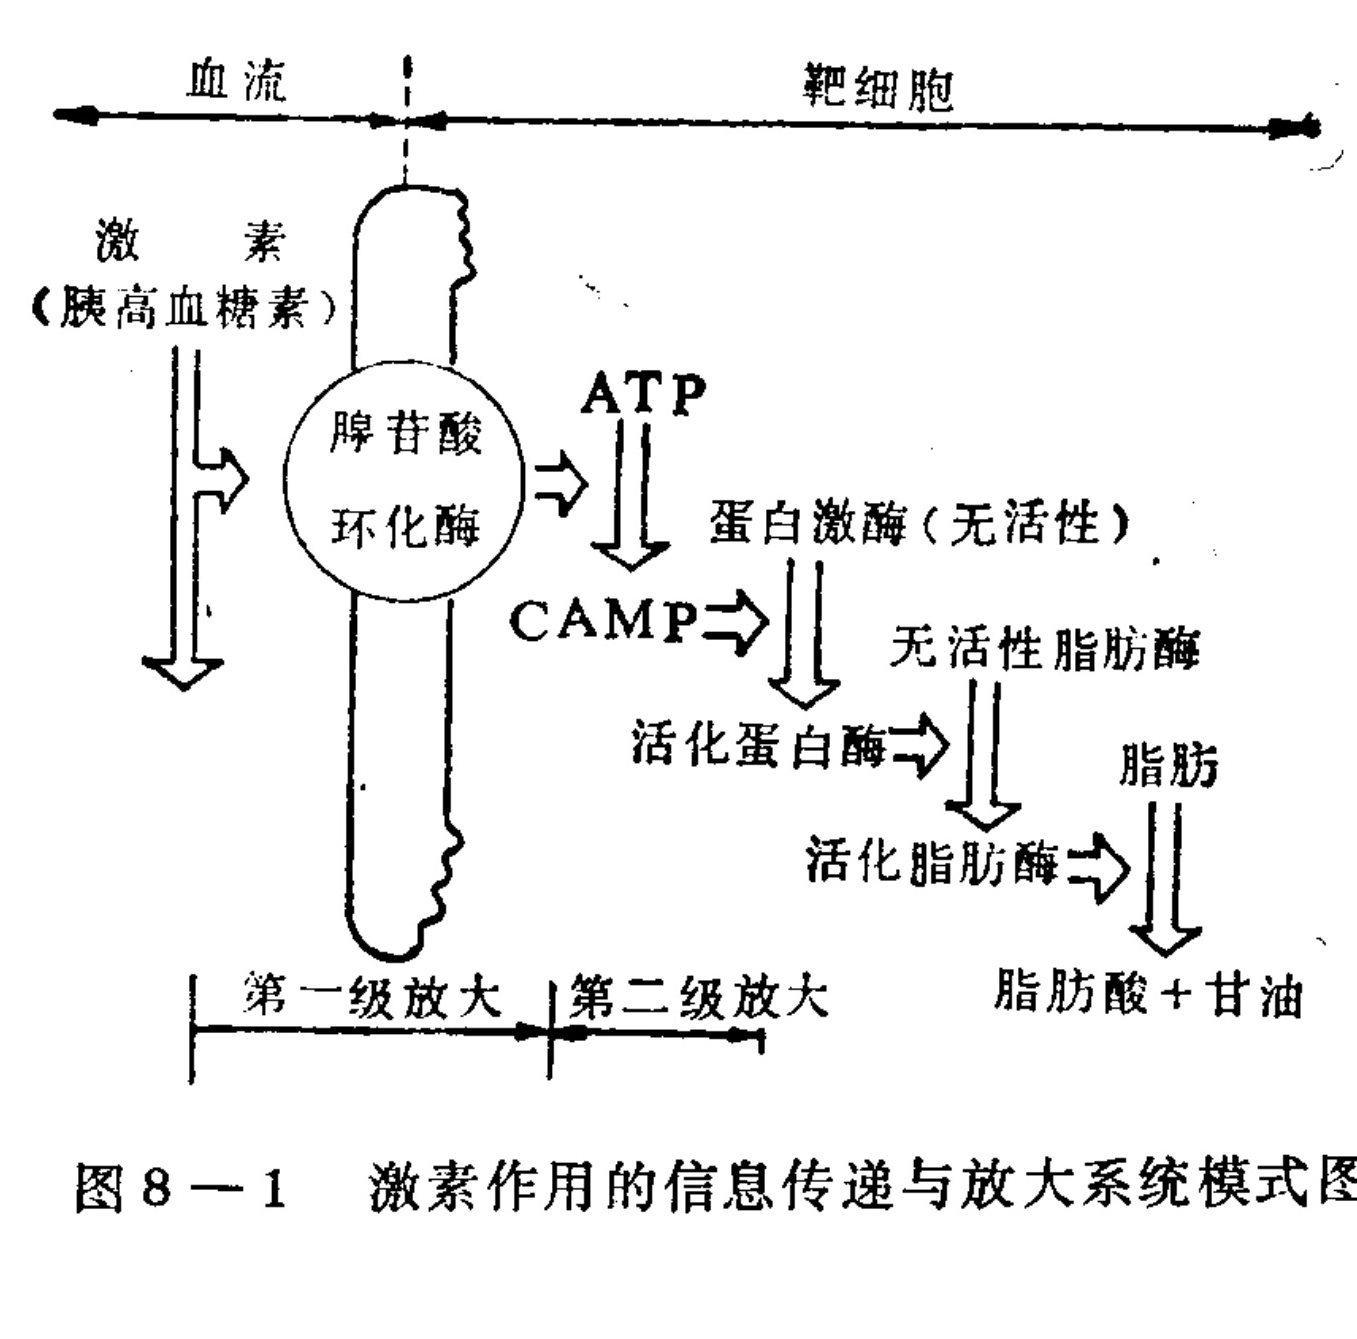
Figure 8-1. Schematic model of the information-transmission and amplification system of hormone action.
Translated labels: Blood flow; Target cell; Hormone (Glucagon); Adenylate cyclase; ATP; cAMP; Inactive protein kinase; Inactive lipase; Active protein kinase; Fat; Active lipase; Fatty acid + Glycerol; First level amplification; Second level amplification
[Diagram labels, Figure 8-2: protein kinase; inactive protein kinase; ATP; inactive lipase; glucagon; cAMP; activated protein kinase; activated lipase; fatty acids plus glycerol.]
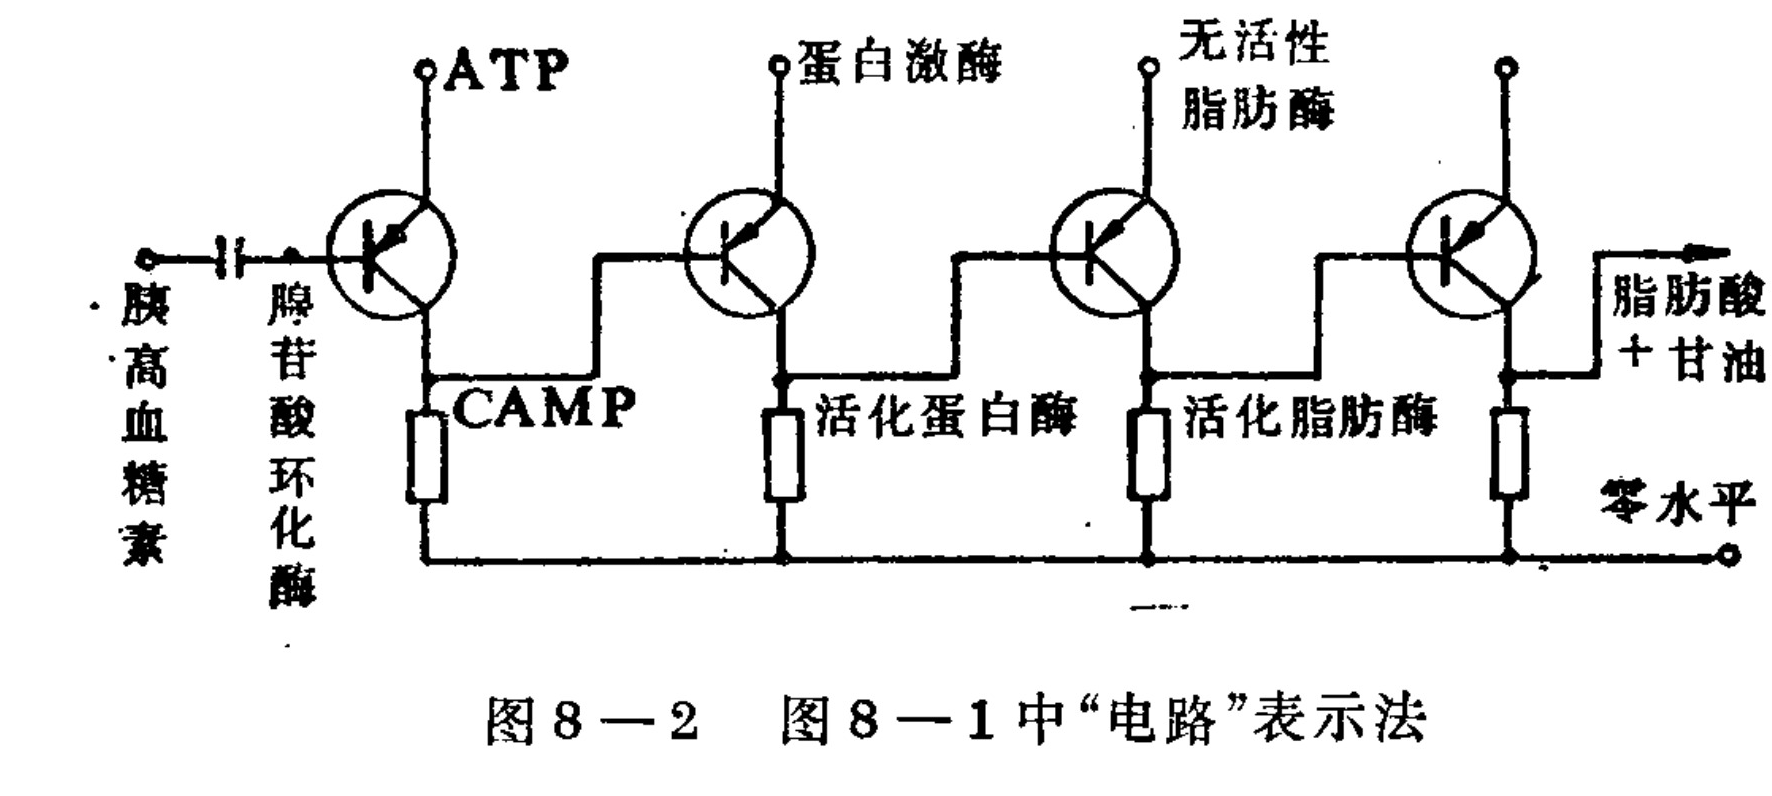
Figure 8-2. “Circuit” representation of Figure 8-1.
Translated labels: Glucagon; ATP; Adenylate cyclase; CAMP; Protein kinase; Activated protein kinase; Inactive lipase; Activated lipase; Fatty acids + Glycerol; Zero level
Some nitrogen-containing hormones, such as insulin and growth hormone, cannot activate AC. Instead, they activate phospholipase C on the membrane, increasing the concentration of cyclic guanosine monophosphate (cGMP), which then activates protein kinase—that is, cGMP serves as the second messenger. In addition, Ca²⁺ and prostaglandins can also be
Second-messenger system
Although thyroid hormones also contain iodine, they can enter cells and exert their effects; their principle is similar to that of steroid hormones.
Steroid hormones are lipid-soluble and have relatively small molecular weights, so they can enter cells and bind to receptors in the cytoplasm, forming hormone–receptor complexes. After the hormone–receptor complexes undergo a conformational change, they enter the nucleus and bind to specific sites on DNA and to specific acidic proteins, regulating gene activity and accelerating the synthesis of various RNAs and proteins, thereby completing the hormone’s function. This principle of hormone action is called the gene-regulation theory. Here, the hormone–receptor complex acts as a second messenger. The principle of action of steroid hormones in the human body can be represented by the schematic diagram in Figure 8-3. The action of both types of hormones begins with binding to a receptor and is called the receptor theory of hormone action. The receptor theory explains the specificity of hormones very well.
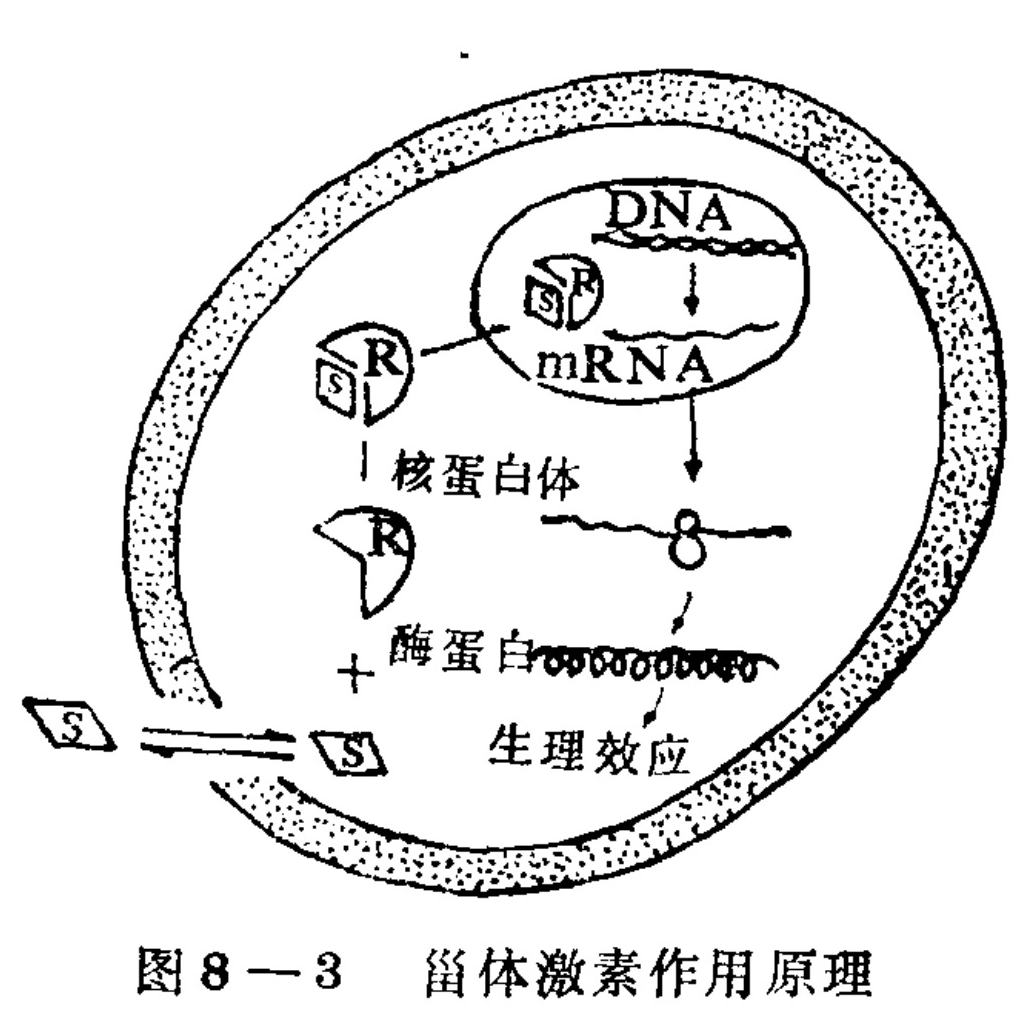
Figure 8-3 Mechanism of action of steroid hormones
Translated labels: S: Steroid hormone; R: Receptor; DNA; mRNA; Nuclear protein body; Enzyme protein; Physiological effect
The amplifying effect of hormones occurs not only within target cells; several hormones can also be connected in sequence to produce an even greater amplification effect. It is estimated that 0.1 micrograms of corticotropin-releasing factor released by the hypothalamus can cause the pituitary to release 1 microgram of ACTH (adrenocorticotropic hormone); ACTH can then cause the adrenal cortex to secrete 40 micrograms of glucocorticoids, and the glucocorticoids can increase glycogen storage in the liver by 6,000 micrograms. Through this three-level serial amplification, the amplification factor reaches 60,000. This example shows that although hormones are present in small quantities, they can perform important physiological functions.
II. Regulatory control of the endocrine system
The realization of the body’s physiological functions depends on the relative stability of the components of its internal environment, and on its ability to respond appropriately when the internal and external environments change. This task in turn depends on hormone secretion; therefore, hormone secretion should change with changes in the internal and external environments. Under normal conditions, the hormone level in the blood should also remain relatively stable.
Besides being governed by the nervous system, the regulatory control of hormones generally involves its own feedback-loop system to maintain a relatively stable level. Endocrine glands not controlled by the pituitary generally have simpler systems; glands controlled by the anterior pituitary are more complex.
Hormones not controlled by the pituitary, such as insulin and parathyroid hormone, are often subject to feedback control by the substances they regulate. Insulin, for example, is the hormone that controls blood-glucose levels. When the blood-glucose level falls, this can inhibit the pancreatic B cells from releasing insulin. When the external environment changes, the central nervous system can, through the vagus nerve, cause the pancreas to secrete insulin. After electrical stimulation of the parasympathetic nerves supplying the pancreas, or of the motor nucleus of the vagus nerve, the amount of insulin in the blood rises. The insulin-regulation system is shown in Figure 8-4.
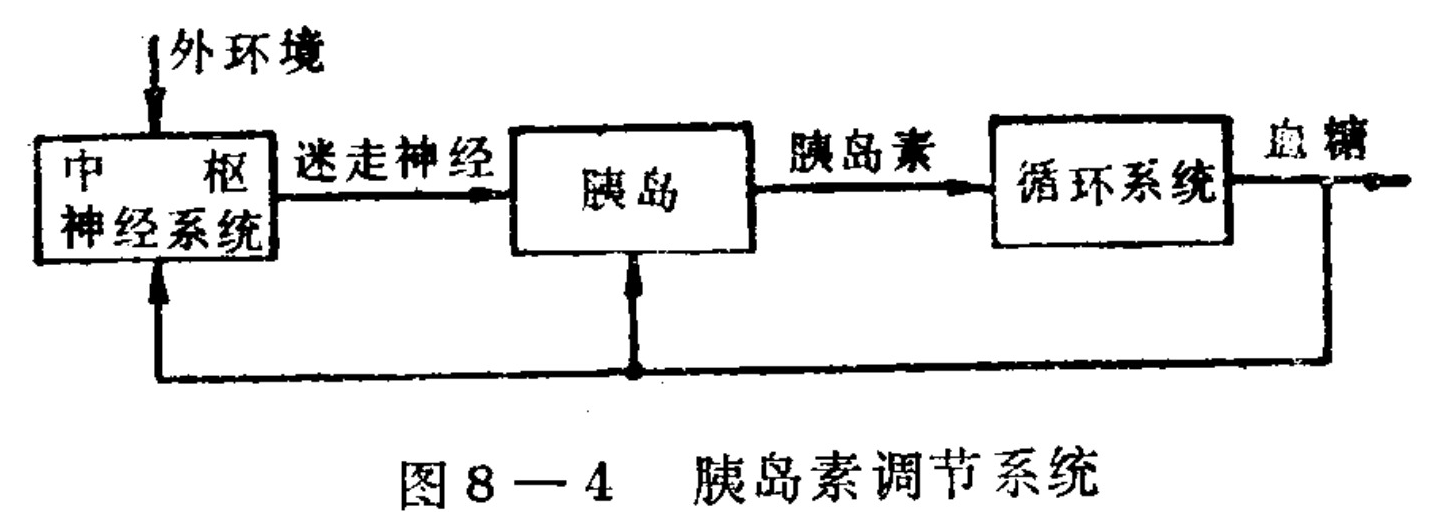
Figure 8-4 Insulin regulation system: External environment, Central nervous system, Vagus nerve, Pancreatic islets, Insulin, Circulatory system, Blood glucose.
Translated labels: External Environment; Central Nervous System; Vagus Nerve; Islets of Langerhans; Insulin; Circulatory System; Blood Sugar
Parathyroid hormone presents a similar situation. An increase in parathyroid-hormone levels can increase the concentration of calcium in the blood; when the calcium concentration rises, it in turn feeds back to inhibit the parathyroid glands from releasing parathyroid hormone. This maintains the relative constancy of the calcium level in the blood and also controls parathyroid hormone. The feedback regulation of parathyroid hormone is shown in Figure 8-5.
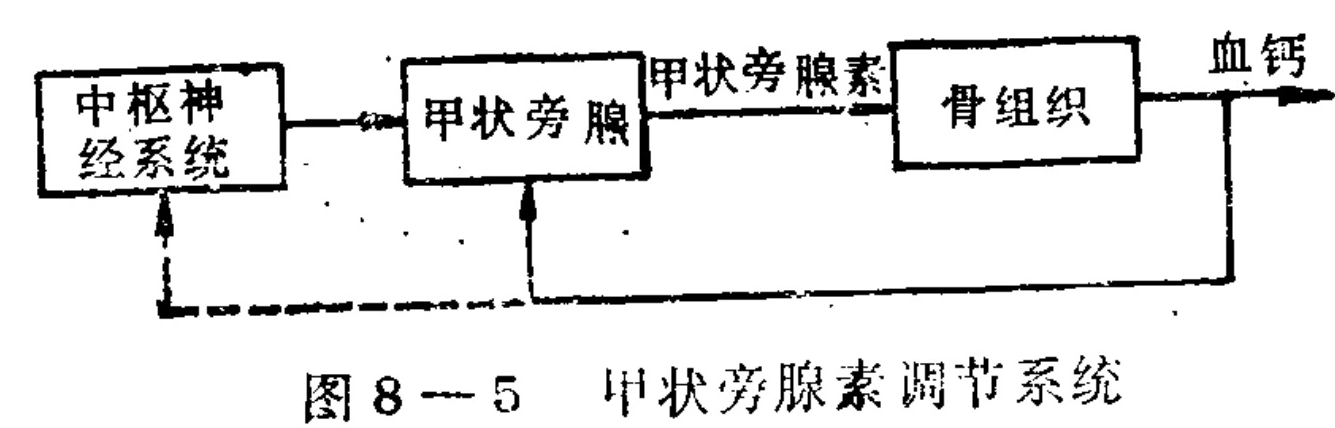
Figure 8-5 Parathyroid hormone regulation system: Central nervous system, Parathyroid gland, Parathyroid hormone, Bone tissue, Blood calcium.
Translated labels: Central Nervous System; Parathyroid Gland; Parathyroid Hormone; Bone Tissue; Blood Calcium
As for glands controlled by the pituitary, we will first explain their regulatory process using the regulation of adrenal-cortex hormones as an example. The synthesis and secretion of glucocorticoids in the adrenal cortex are directly controlled by ACTH, adrenocorticotropic hormone, secreted by the pituitary. When pituitary function is reduced, ACTH secretion also decreases; at that time, the zona fasciculata and zona reticularis of the adrenal cortex atrophy, and glucocorticoid secretion is greatly reduced. The normal human pituitary secretes a small amount of ACTH every day, which is necessary for the normal secretion of glucocorticoids.
ACTH is rapidly destroyed in the body and has a half-life of approximately 10 minutes. ACTH secretion is in turn controlled by corticotropin-releasing hormone (CRH) secreted by the median eminence of the hypothalamus, and CRH secretion is influenced by many parts of the central nervous system. When the body encounters intense stimulation, the increase in adrenal-cortex hormone secretion is the result of stimulation of the reticular formation and limbic system, which increases CRH release.
On the other hand, an increase in adrenal-cortex hormones can inhibit the pituitary’s secretion of tropic hormones; this is a form of negative-feedback regulation. If the adrenal glands are removed, eliminating this feedback inhibition, not only does ACTH secretion increase, but the hypothalamus also increases its release of CRH. This shows that adrenal-cortex hormones exert negative feedback on the hypothalamus. If a small amount of adrenal-cortex hormone is implanted directly in the median eminence, ACTH release is also markedly reduced. This shows that the effect of adrenal-cortex hormones on the hypothalamus is stronger.
In addition to the two longer-range feedback loops described above, the release of hypothalamic CRH is also affected by negative feedback from ACTH and from CRH itself. These two forms of feedback are called short feedback and ultrashort feedback. This multiple feedback can prevent the various hormones in the feedback loop—cortical hormone, ACTH, and CRH—from undergoing large fluctuations. The regulatory control of adrenal-cortex hormones is shown in Figure 8-6. The gonadal and thyroid hormones have similar situations.
Central nervous system
Hypothalamus
Pituitary
ACTH
Adrenal cortex
Adrenocortical hormones
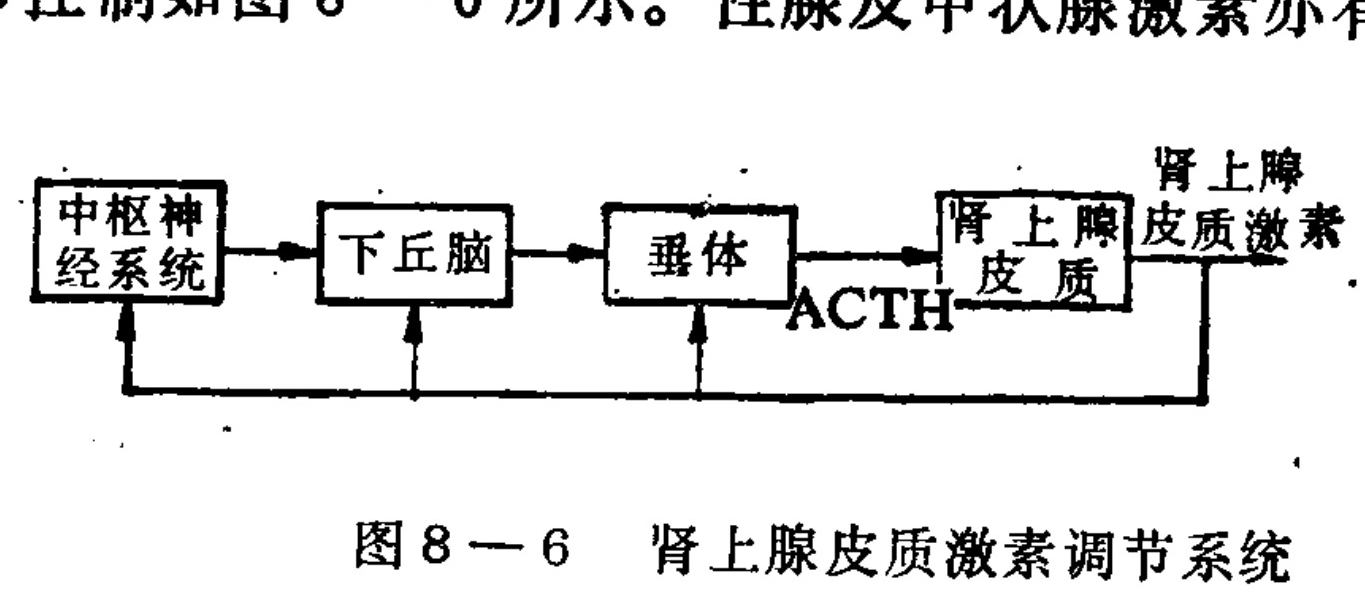
Figure 8-6 Adrenocortical hormone regulation system
Translated labels: Central Nervous System; Hypothalamus; Pituitary; ACTH; Adrenal Cortex; Adrenocorticotropic hormones
However, the feedback effect of thyroid hormone mainly occurs at the level of the pituitary gland. Other hormones controlled through the pituitary include growth hormone, prolactin, oxytocin, and antidiuretic hormone. These several hormones act directly on target cells without passing through tropic hormones.
In hormone secretion and regulation, the pituitary plays an important pivotal role and occupies a central position in the multilevel neuroendocrine regulatory system. Its basic control pattern is that the hypothalamus releases a “releasing factor,” thereby controlling the anterior pituitary so that it secretes a tropic hormone: neural impulse → releasing factor → tropic hormone → hormone.
When the external environment changes, integration through the central nervous system can control the pituitary’s secretion of the hormone appropriate to the environment. For example, toxic substances, hypoxia, and various injurious stimuli can cause ACTH release and increase adrenal cortical hormones, thereby enhancing the body’s ability to resist injury. Cold stimulation can increase the secretion of thyroid-stimulating hormone, raising the level of thyroid hormone and increasing the metabolic rate to resist the cold. Light stimulation, emotional excitement, and similar factors, on the other hand, reduce the secretion of thyroid-stimulating hormone. Here the hypothalamus is the regulatory-conversion hub from neural regulation to humoral regulation. The multilevel neuroendocrine regulatory system can be represented by Figure 8-7.
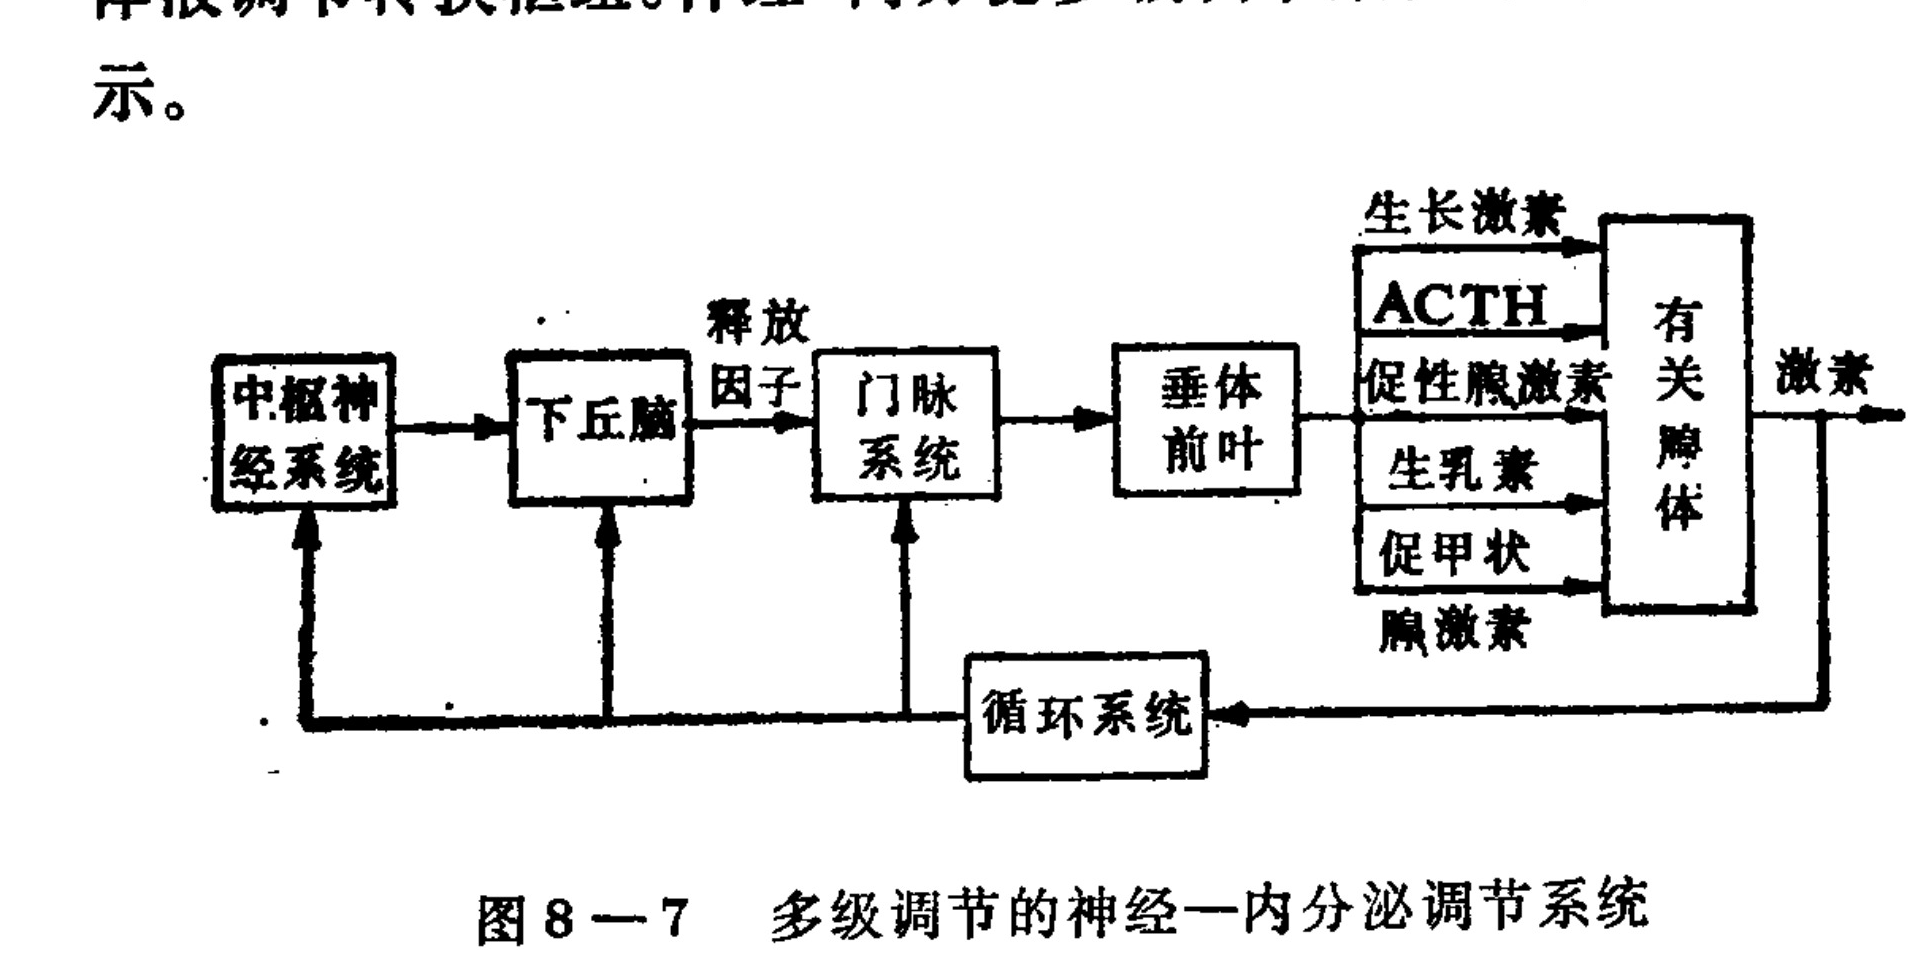
Figure 8-7. Neuro-endocrine regulatory system with multi-level regulation. Diagram labels: central nervous system, hypothalamus, releasing factors, portal system, anterior pituitary, growth hormone, ACTH, gonadotropins, prolactin, thyroid-stimulating hormone, related glands, hormones, circulatory system.
Translated labels: Central Nervous System; Hypothalamus; Releasing factors; Portal system; Anterior pituitary; Growth hormone; ACTH; Gonadotropins; Prolactin; Thyrotropin; Relevant glands; Hormones; Circulatory system
In addition to the negative-feedback regulation described above, hormones are also regulated in various other ways. For example, a medium level of estrogen can inhibit the secretion of luteinizing hormone, but before ovulation, a mature follicle can produce a high level of estrogen, thereby promoting the massive secretion of luteinizing hormone—this is a form of positive feedback. After hormones are released, some organs and tissues can convert them, weakening or strengthening their activity. For example, in many tissues, especially the liver, T4 (thyroxine) can be converted into the more active T3 (triiodothyronine). Various hormones can also mutually regulate one another.
Other hormones—for example, internal hormones can enhance progesterone’s effect on the uterus; that is, changes in the level of internal hormones can regulate the function of progestational hormones. Similarly, the presence of glucocorticoids can enable other hormones to produce stronger effects; norepinephrine’s action on blood vessels depends on the presence of glucocorticoids. In short, hormonal regulation is complex, with many different modes cooperating with one another. There are many kinds of hormones, and their regulatory modes are not all the same. Here, only the more important regulatory processes are outlined. Some details of hormonal regulation will be discussed further in the next section in conjunction with models of the corresponding hormonal regulation.
III. Mathematical Models of the Endocrine System
The preceding section has already mentioned that there are many hormones in the human body, each with its own regulatory control system. In this section, we use several specific hormonal regulatory processes as examples to explain how mathematical models of the endocrine system are established and what they are used for.
1. Model of the Blood-Glucose Regulatory System
Glucose in the blood is the body’s principal source of energy. If blood glucose is too low, the body’s cells—especially brain cells—do not have enough energy and cannot function normally; it may even cause hypoglycemic coma. If the blood-glucose level is too high, symptoms such as frequent urination, thirst, and fatigue occur, producing diabetes mellitus and making peripheral vascular lesions more likely. To maintain a relatively stable blood-glucose level, the human body has a blood-glucose regulatory system. The controllers of this regulatory system are hormones, chiefly insulin and glucagon. Adrenaline, adrenocortical hormones, growth hormone, and others also participate in the blood-glucose regulatory process. The controlled object is the glucose metabolism of the entire body, including glucose utilization by cells in all parts of the body, the breakdown and synthesis of glycogen in the liver, and renal glucose excretion. The controlled variable is the concentration of glucose in the blood. This blood-glucose regulatory system can be represented by Figure 8-8.
A great deal of work has been done on mathematical models of the blood-glucose regulatory system. Dozens of models have been published in the literature, and they can broadly be divided into two major categories: simplified models and comprehensive models. Simplified models reflect only the principal processes of blood-glucose regulation; their parameters are easy to identify and they can be used for theoretical analysis. Comprehensive models aim to reflect blood
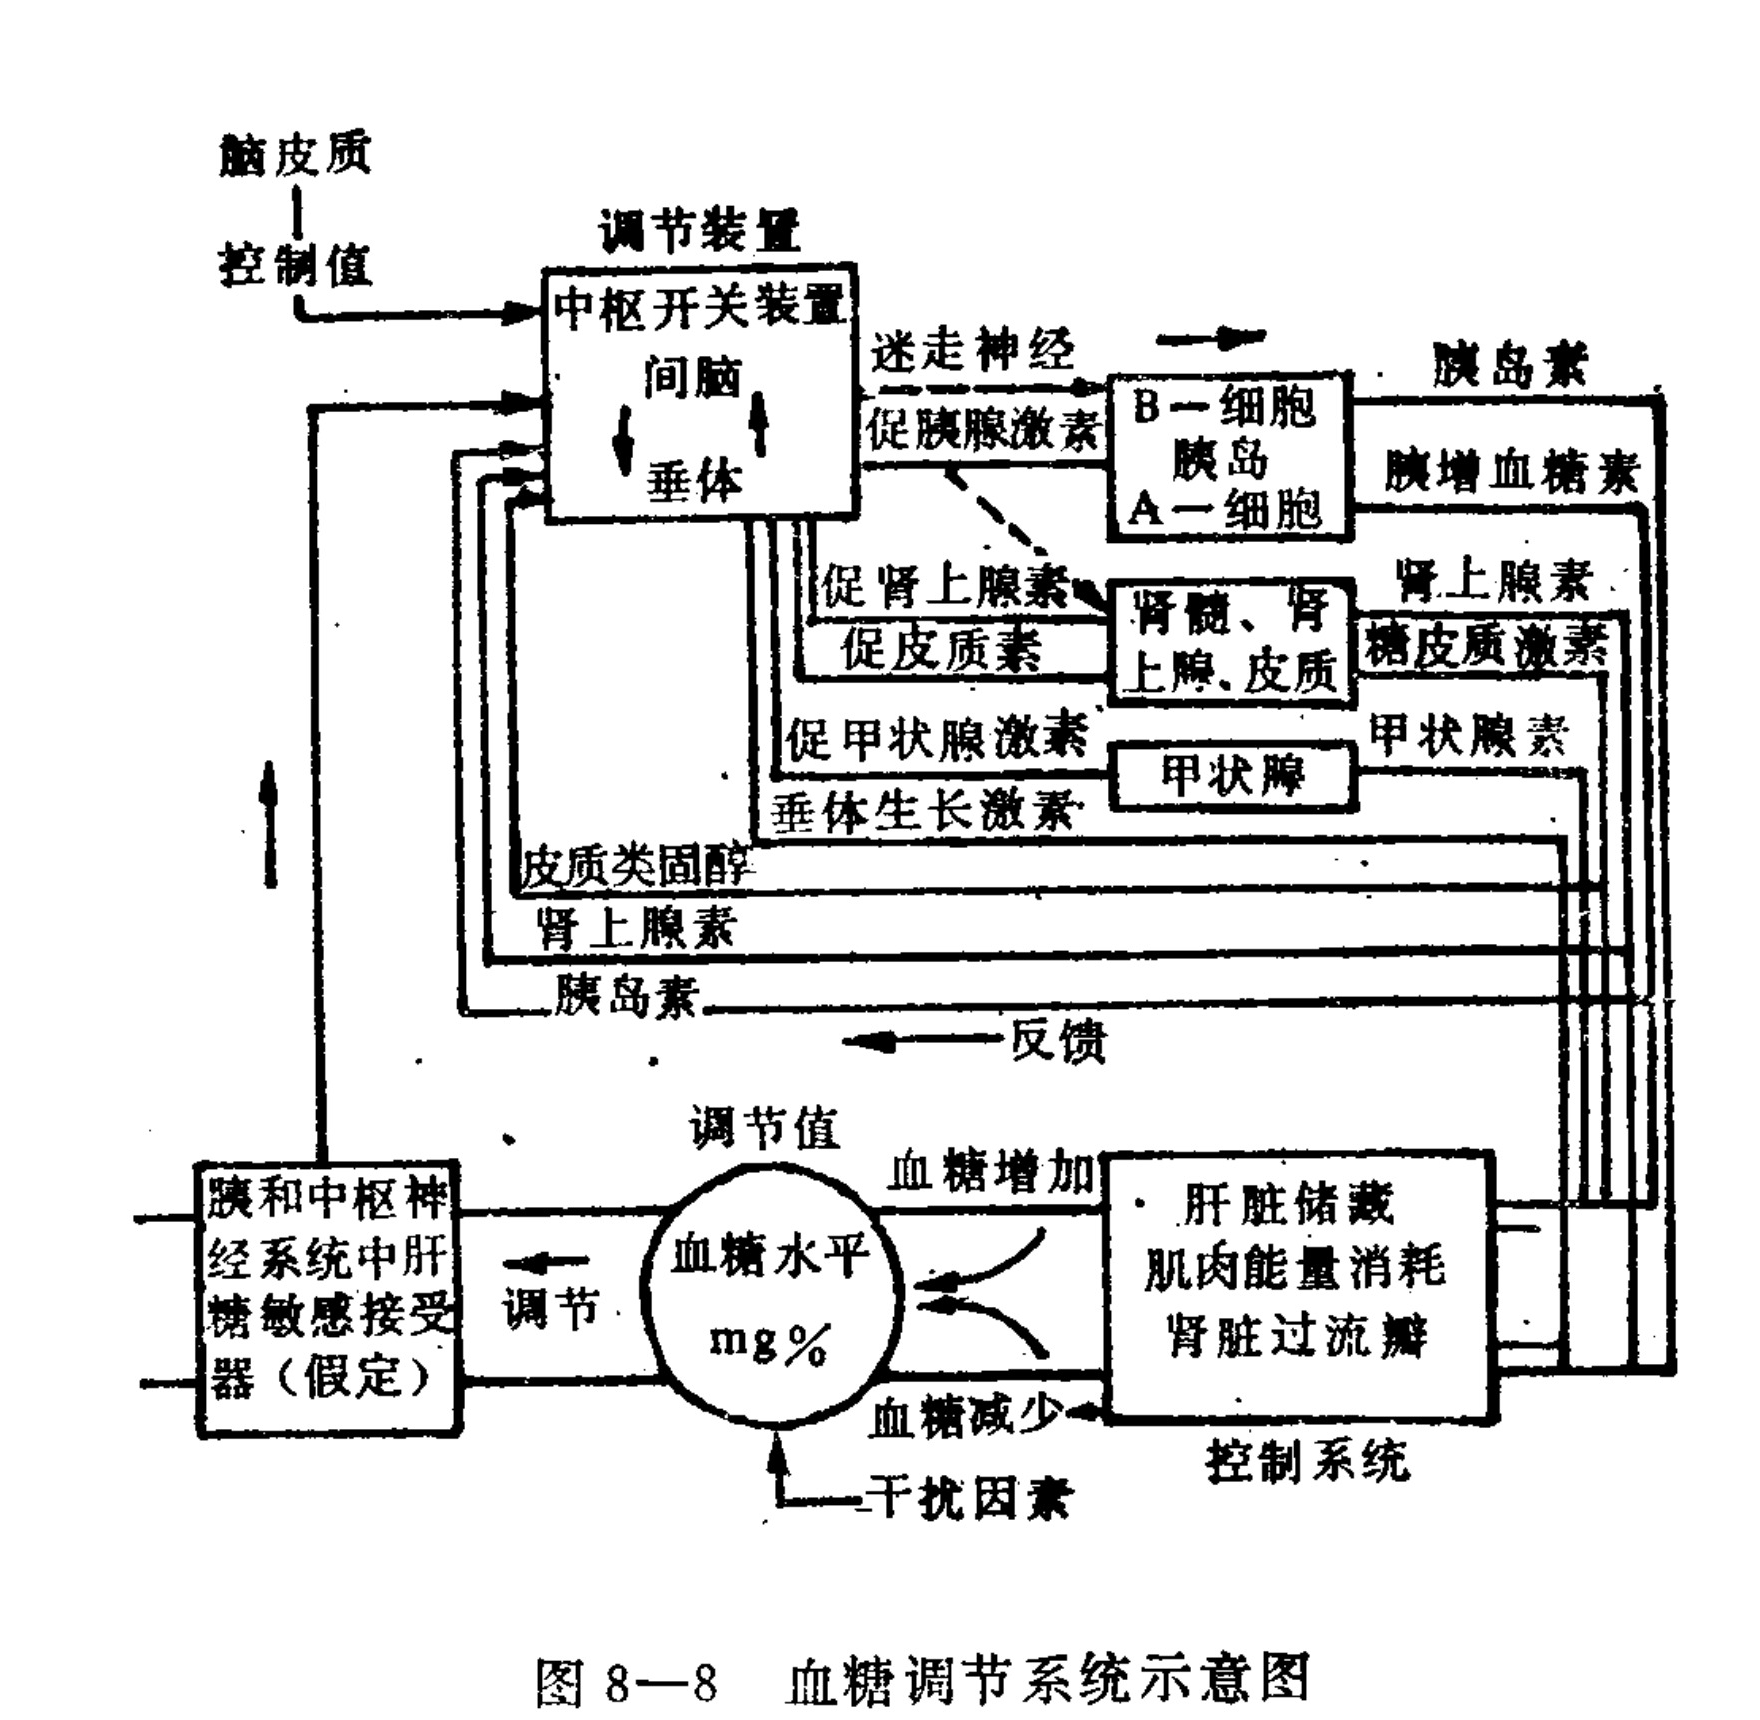
Figure 8-8 Schematic diagram of the blood glucose regulation system
Translated labels: Cerebral cortex; Control value; Regulating device; Central switch device; Hypothalamus; Pituitary; Vagus nerve; Insulin; Glucagon; Adrenaline; Glucocorticoids; Thyroxine; Blood glucose level; Control system; Feedback
Diagram labels: Cerebral cortex, Control value, Regulating device, Central switch device, Diencephalon, Pituitary gland, Vagus nerve, Pancreatic hormone, B-cells, Islets, A-cells, Insulin, Glucagon, Adrenaline, Glucocorticoids, Thyroxine, Corticosteroids, Adrenaline, Insulin, Feedback, Regulation value, Blood glucose increase, Liver storage, Muscle energy expenditure, Renal overflow valve, Control system, Blood glucose decrease, Disturbance factors
glucose regulation more accurately, including the dynamic processes of its various units, but they have high dimensionality, their parameters are difficult to determine, and validation is also very difficult. Such models can nevertheless predict the physiological processes of the units and deepen understanding of blood-glucose regulation. Thus both types of model have practical significance; one example of each is given below.
Simplified models often consider only the main factor regulating blood glucose—insulin. The β-cells of the pancreatic islets are sensitive to blood glucose. When blood glucose rises, the β-cells increase insulin secretion; insulin increases glucose utilization by peripheral tissues and glycogen synthesis in the liver, thereby lowering blood glucose. This constitutes a negative-feedback regulatory system (see Figure 8-4). If only the two principal variables—blood glucose and blood insulin—are considered, and the nonlinear relationship between them is ignored, the equations governing this process can be written as follows: x₁̇ = −a₁₁x₁ − a₁₂x₂ + G
x₂̇ = a₂₁x₁ − a₂₂x₂ + I
Here, x₁ is the blood-glucose concentration, x₂ is the blood-insulin concentration, G is the rate of exogenous glucose infusion, I is the rate of exogenous insulin infusion, and a₁₁, a₁₂, a₂₁, and a₂₂ are constant parameters. The first equation shows that the rate of change of blood glucose is determined by blood glucose, insulin, and the rate of exogenous glucose infusion; the first two have negative signs, meaning that they reduce it. The coefficients a₁₁ and a₁₂ are proportionality constants. For normal subjects, the parameter values are a₁₁ = 0.78, a₁₂ = 0.228, a₂₁ = 4.34, and a₂₂ = 2.920 (with glucose measured in mg per 100 milliliters and insulin in microunits per 100 milliliters).
An electronic computer was once used to simulate the changes in human blood glucose after a specified amount of glucose was infused. The results agreed with human experimental data, indicating that the model basically reflects the dynamic process of blood glucose. Clearly, for people with diabetes, the above parameters will change; therefore, these parameter values can be used to diagnose different types of diabetes. After glucose infusion, changes in blood glucose were recorded, and the above parameters were obtained from these data by system-identification methods for diagnosing different types of diabetes. The rate of agreement reached 80–90%. The simplified model fits blood-glucose values well, but fits insulin secretion and its dynamic process poorly. This model has also been used successfully in designing adaptive control systems for controlling blood glucose.
Next, we introduce a more recently developed comprehensive dynamic model of blood-glucose regulation. The purpose of establishing this model is to reflect the dynamic processes of the blood-glucose system in normal and pathological states under different disturbances or test conditions. It should also predict the physiological processes of its principal units, such as the glucose production rate of the liver and the secretion and dynamics of insulin in the pancreatic islets. At the same time, it should not be excessively complex and thus impossible to validate. In this model, according to the principal variables—blood-glucose level, insulin level, and glucagon—the system is divided into three subsystems. The three subsystems interact through control signals: the blood-glucose subsystem acts on the two hormone controllers, and the two controllers in turn act on the controlled blood-glucose subsystem, as shown in Figure 8-9.
The blood-glucose subsystem is treated as a single compartment; that is, the extracellular space, including the blood, is assumed to be uniformly distributed. It involves hepatic glycogen breakdown and synthesis (NHGB), renal excretion (F₃), insulin-dependent glucose utilization (mainly in muscle, adipose tissue, and other tissues, F₁), and insulin-independent glucose utilization (mainly in the central nervous system and red blood cells, F₂).
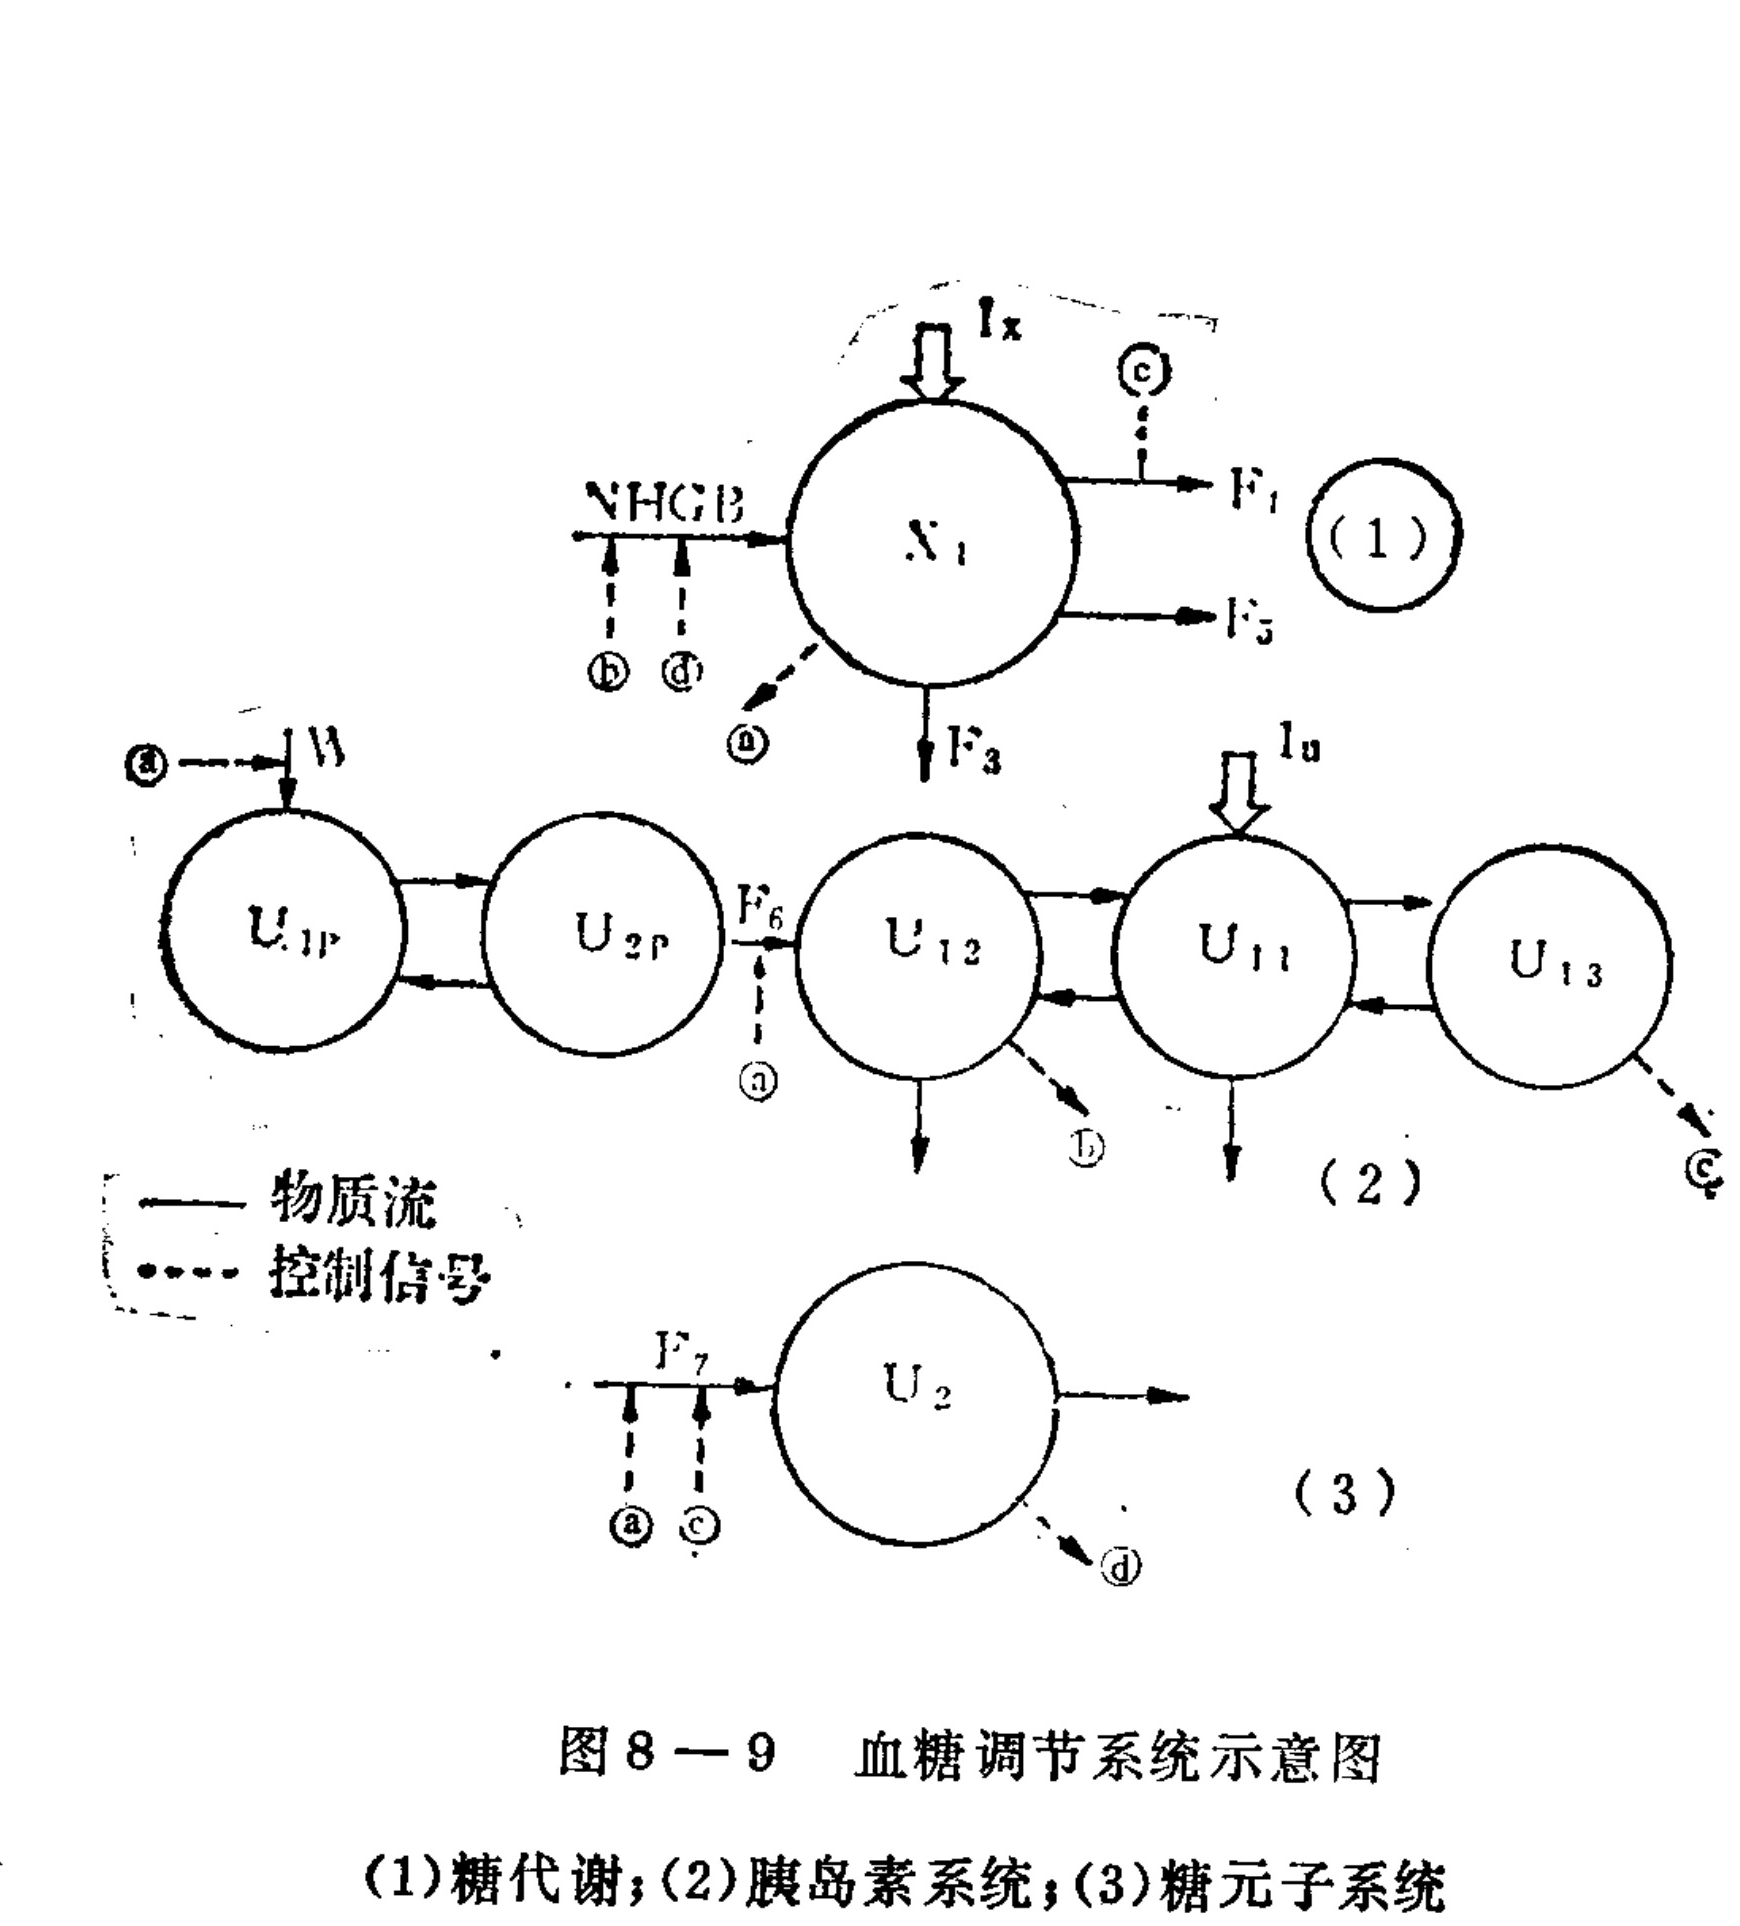
Figure 8-9. Schematic diagram of the blood-glucose regulatory system.
Translated labels: Sugar metabolism; Insulin system; Glycogen subsystem; Material flow; Control signal (1) Glucose metabolism; (2) insulin system; (3) glycogen subsystem.
The variables of the insulin subsystem include insulin in different states and locations: stored insulin (u₁ₚ), immediately releasable insulin (u₂ₚ), plasma insulin (u₁₁), liver and portal vein plasma insulin (u₁₂), and insulin in the interstitial fluid (u₁₃). This makes it possible to represent the secretion and transport processes of insulin and its different physiological effects at different locations. Glucagon is also treated as a single compartment, namely, the entire extracellular fluid. In this model, Wₕ, F₁–F₂, and other quantities are nonlinear functions of the input variables, describing the corresponding physiological processes. For example, Fᵢ is the hepatic glucose production rate; it is a nonlinear function of the plasma glucose concentration and is also related to the concentration of insulin in the blood, and it can be determined experimentally. Figure 8-10 is the curve for Fᵢ. Writing the relationships among the above variables as the corresponding equations yields the comprehensive model of the blood-glucose system (the specific equations are omitted here).
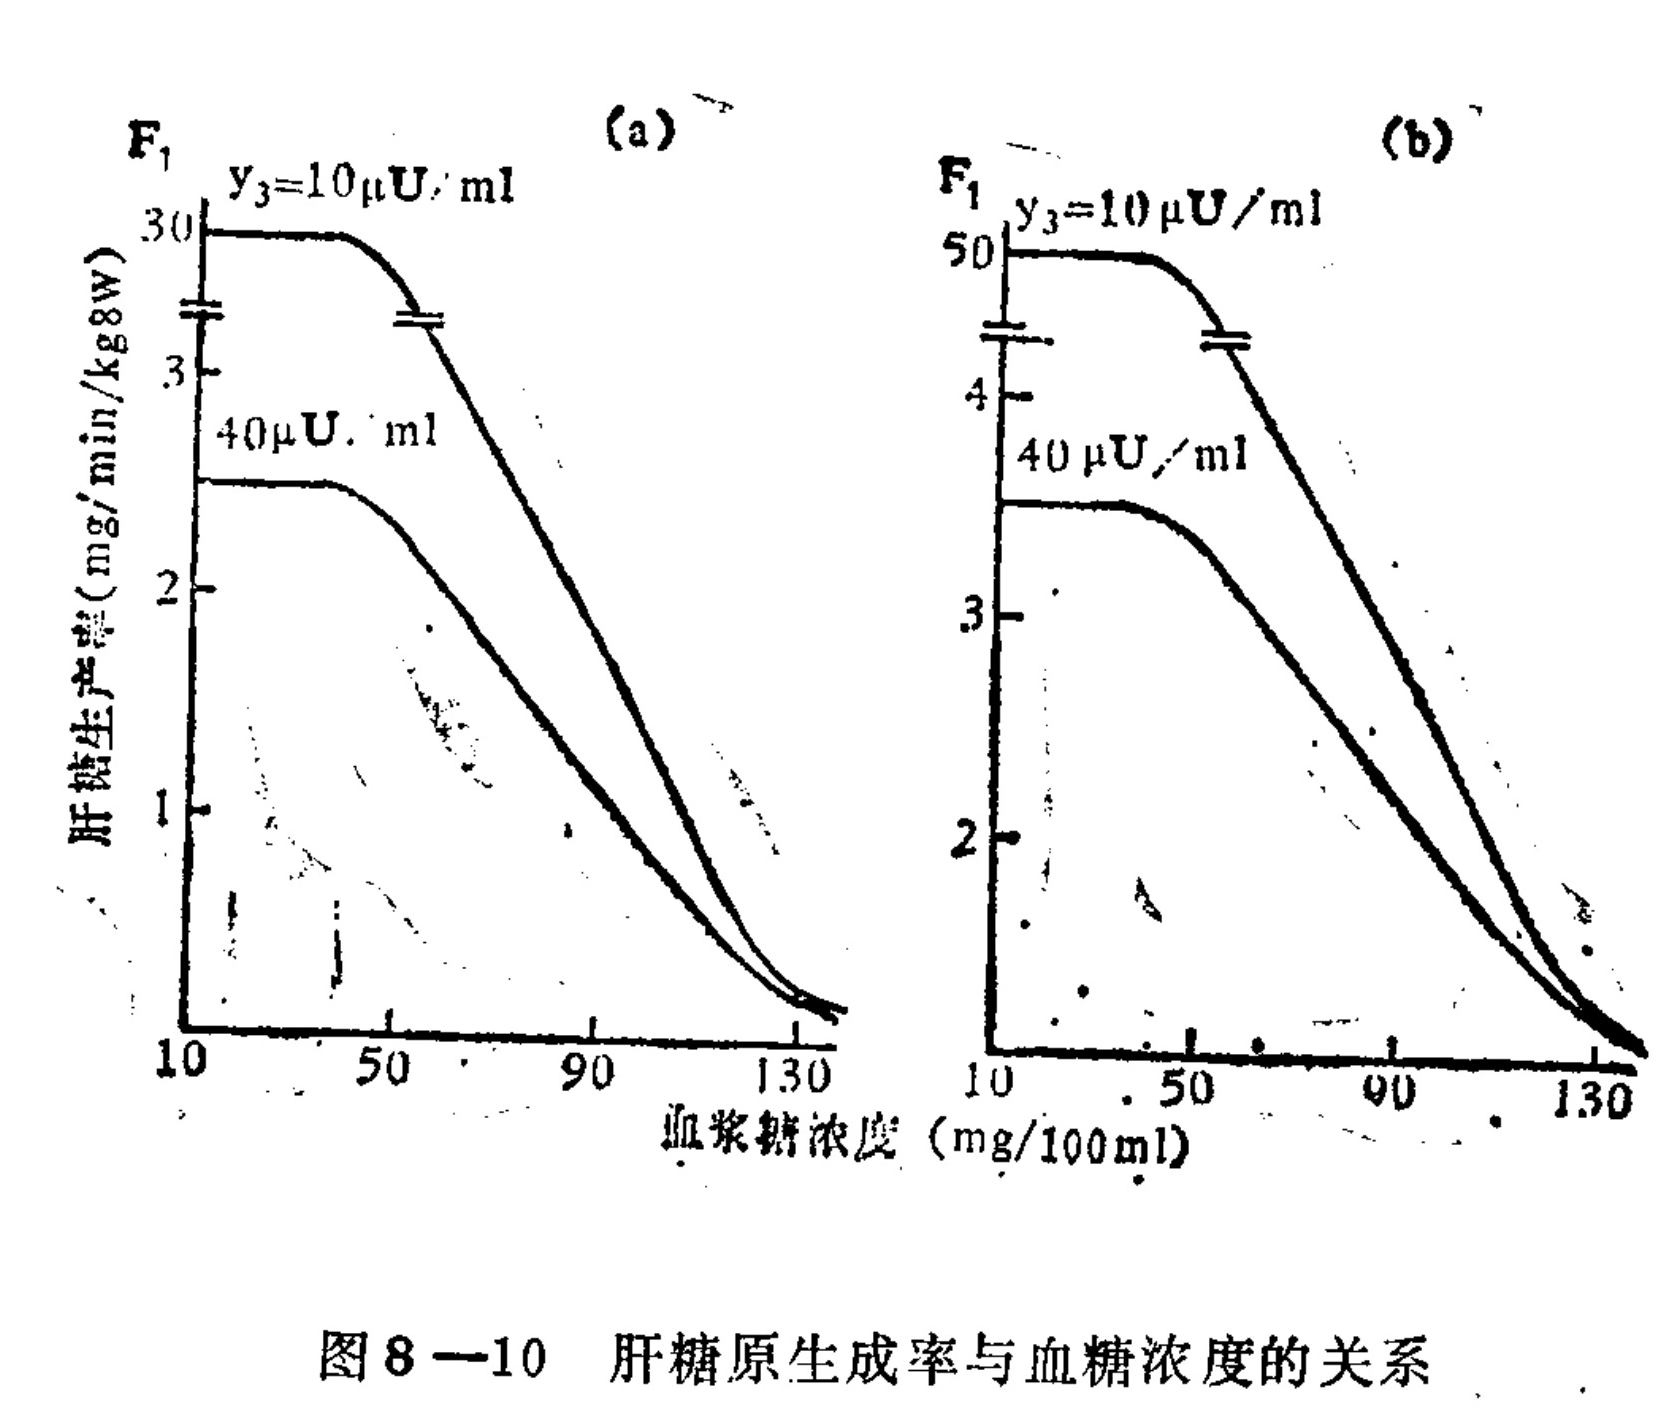
Figure 8-10 graph labels
Translated labels: Hepatic glycogen production rate (mg/min/kg BW); Plasma glucose concentration (mg/100ml); y3=10 μU/ml; 40 μU/ml
Panel (a): F₁; y₃ = 10 μU/ml; upper y value 3.0; y ticks 1, 2, 3; lower curve 40 μU/ml; x ticks 10, 50, 90, 130.
Panel (b): F₁; y₃ = 10 μU/ml; upper y value 5.0; y ticks 2, 3, 4; lower curve 40 μU/ml; x ticks 10, 50, 90, 130.
Shared axes: Hepatic glucose production rate (mg/min/kg BW); Plasma glucose concentration (mg/100 ml).
Figure 8-10. Relationship between the rate of hepatic glycogen formation and blood-glucose concentration
The mathematical model obtained is relatively complex and cannot at present be solved by analytical methods. To verify the validity of the model, an electronic computer was used to simulate the dynamic changes of the blood-glucose system under various conditions, and the results were compared with the corresponding experimental data. For the above model, computer simulations were performed under conditions corresponding to normal subjects, chemically diabetic patients, and obese diabetic patients, including tolerance tests involving intravenous glucose injection and insulin injection. In addition, under different glucose loads, simulations were conducted of the effects of different insulin and glucagon patterns in normal subjects and patients on hepatic and peripheral glucose utilization, yielding a large amount of data on the corresponding dynamic processes. In examples where actual data obtained experimentally in human subjects could be used for comparison, the two agreed very well. Figure 8-11 compares the simulation with experimental data from an intravenous-glucose tolerance test in a normal subject. Figure 8-12 compares experimental and simulated changes in blood glucose and blood insulin in an obese patient after rapid glucose injection. The simulation results are shown by curves and the experimental data by points; the two can be seen to overlap almost completely.
Figure/graph content: vertical axis labeled “Blood glucose concentration (mg/100 ml)”, horizontal axis labeled “Time (min)”, with axis numerals such as 0, 60, and 120.
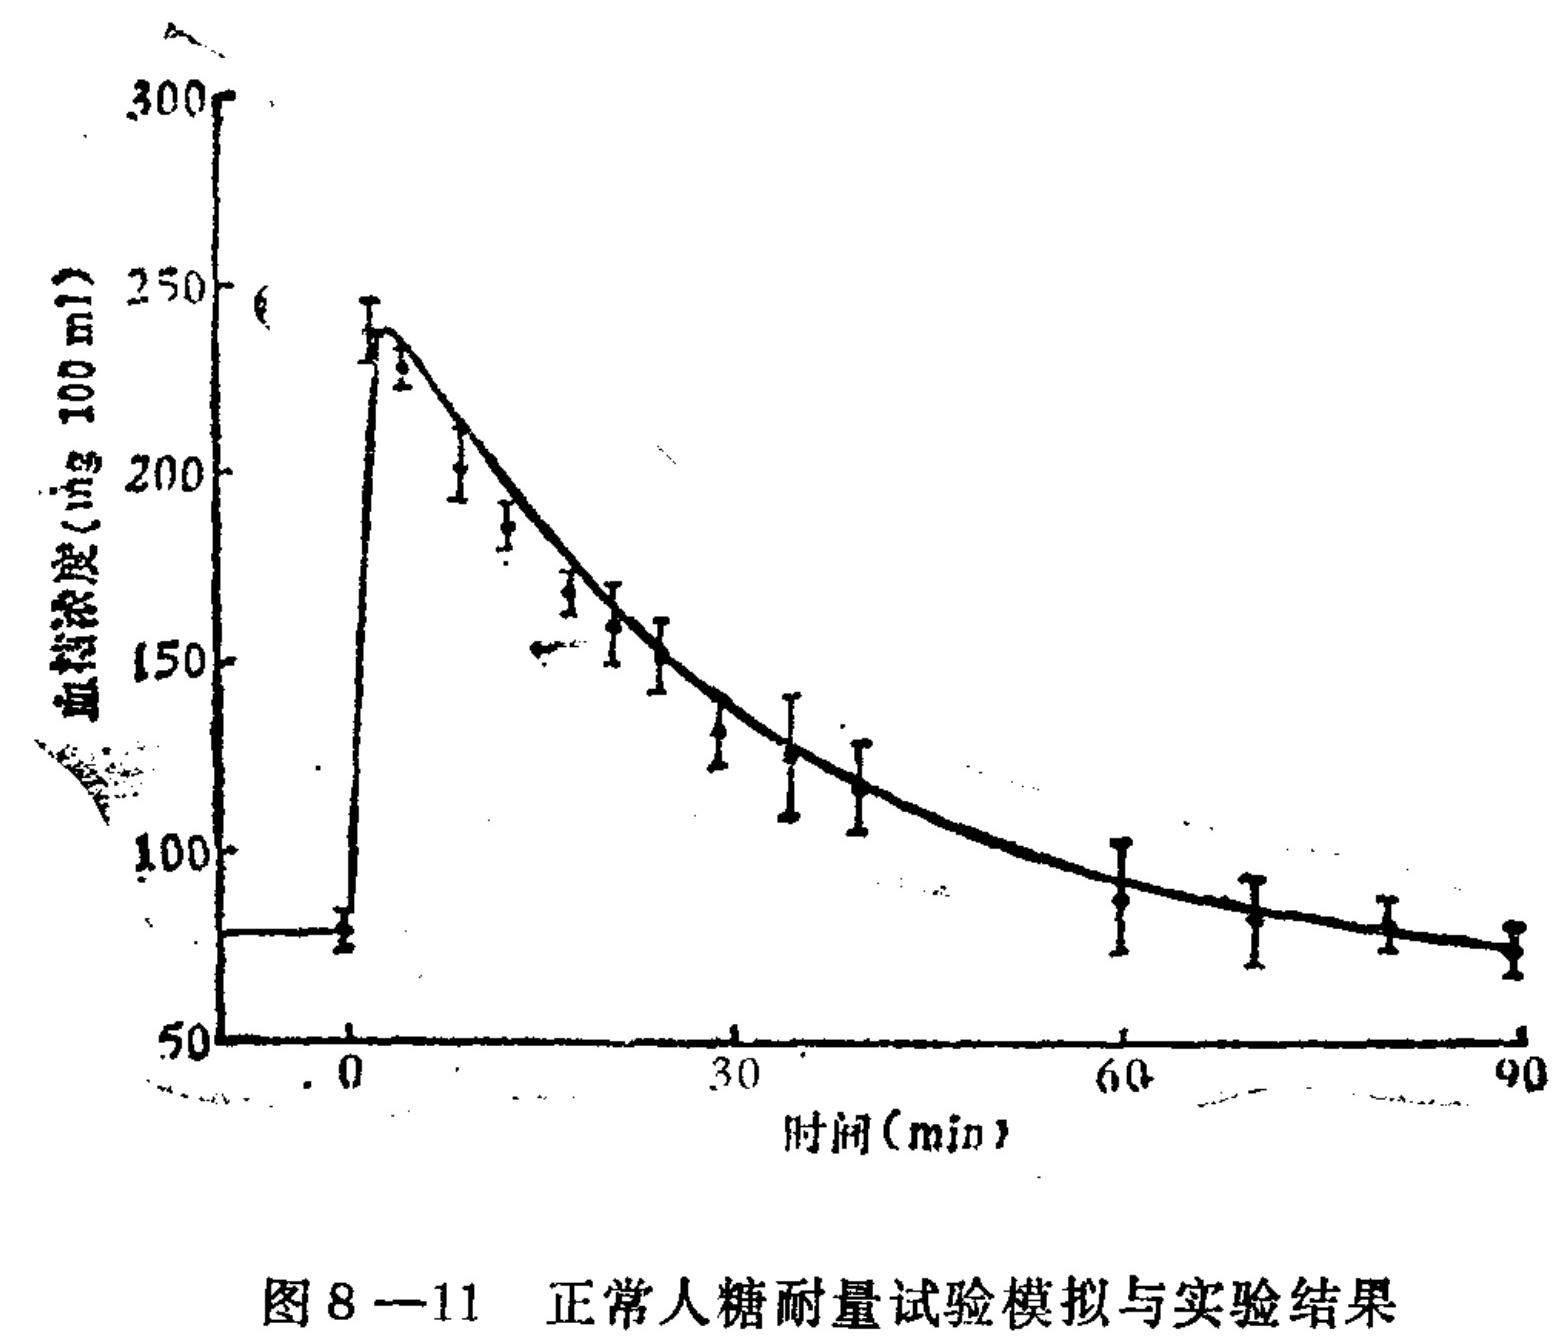
Figure 8-11. Simulation and experimental results of the glucose-tolerance test in a normal subject
Translated labels: Blood Glucose Concentration (mg/100 ml); Time (min)
Although the mathematical model described above has undergone a large number of computer-simulation experiments and has been compared with measured data as far as possible, this is still not sufficient to confirm that the model is correct. Nevertheless, this model has already been applied to research on the blood-glucose system. For example, the mathematical model was used to study a closed-loop-controlled artificial pancreas and to compare the effectiveness of three different algorithms (all algorithms already used clinically) when insulin is infused at two different sites, the portal vein and the peripheral circulation. It demonstrated that the differences in the effects of the three algorithms were not significant, but that infusion through the portal vein rather than the peripheral circulation would
Figure/graph content: vertical axes labeled “Blood glucose concentration (mg/100ml)” and “Blood glucose concentration (μU/100ml)”, horizontal axis labeled “Time (min)”; the visible caption is: Figure 8-12. Simulation and experimental results for an obese patient
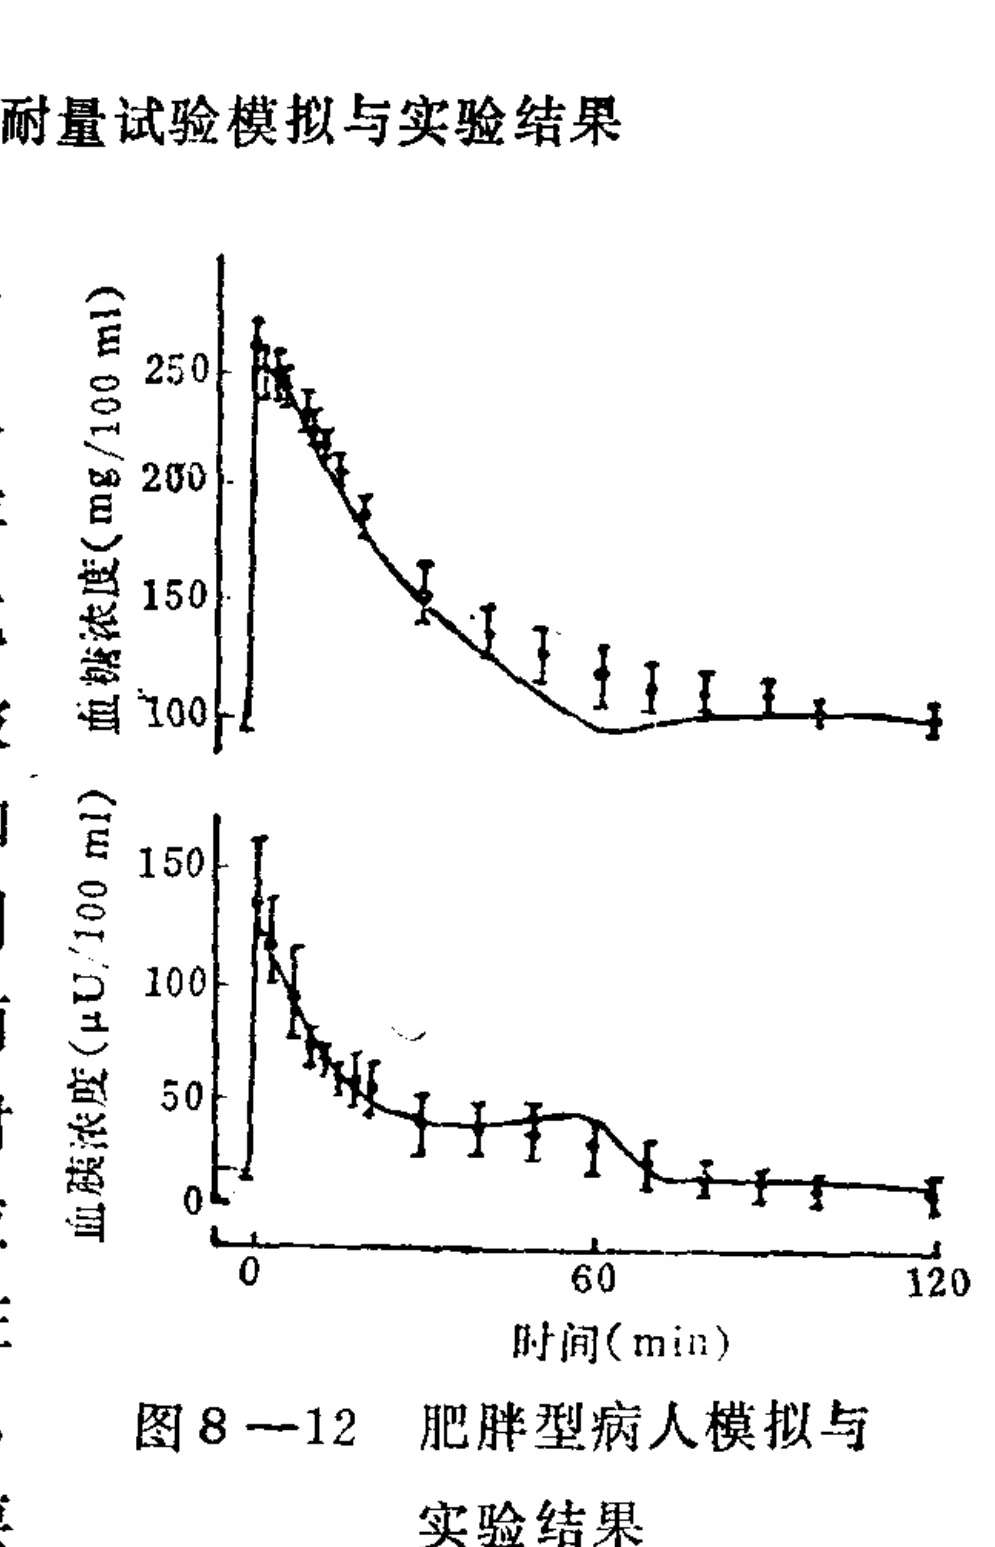
Figure 8-12 Simulation and experimental results for obese patients.
Translated labels: Simulation and Experimental Results of Tolerance Test; Blood Glucose Concentration (mg/100 ml); Blood Insulin Concentration (μU/100 ml); Time (min)
save insulin. In addition, some researchers have used this model to test the applicability of the blood-glucose adaptive-control algorithms they designed.
2. Dynamic model of thyroid hormones
The thyroid is the largest endocrine gland in the human body and plays an important role in the body’s basic metabolic processes. Abnormal thyroid function is an important metabolic disease. Models for studying the regulation and control of thyroid hormones and their metabolic processes have important practical significance. As discussed earlier, thyroid hormones are controlled by the pituitary; this belongs to the type of regulatory mode shown in Figure 8-7. The thyroid secretes thyroxine (T₄) and triiodothyronine (T₃), and the amount secreted is related to the thyroid-stimulating hormone secreted by the pituitary. The transfer function between them is of the proportional-plus-integral type, with different proportional and integral coefficients for the two hormones. Thyroxine in the plasma (mainly T₄) can in turn exert negative feedback on the pituitary. This feedback signal is free triiodothyronine (FT₃) in the brain circulation after a transfer delay and proportional-plus-integral processing. Pituitary secretion is also controlled by hypothalamic thyrotropin-releasing hormone (TRH). Thyroid hormones are secreted into the blood, distributed throughout the body, and undergo metabolic activity, such as the conversion of T₄ to T₃. This distribution and metabolism are also dynamic processes; consequently, the control of the thyroid hormones as a whole can be represented by Figure 8-13.
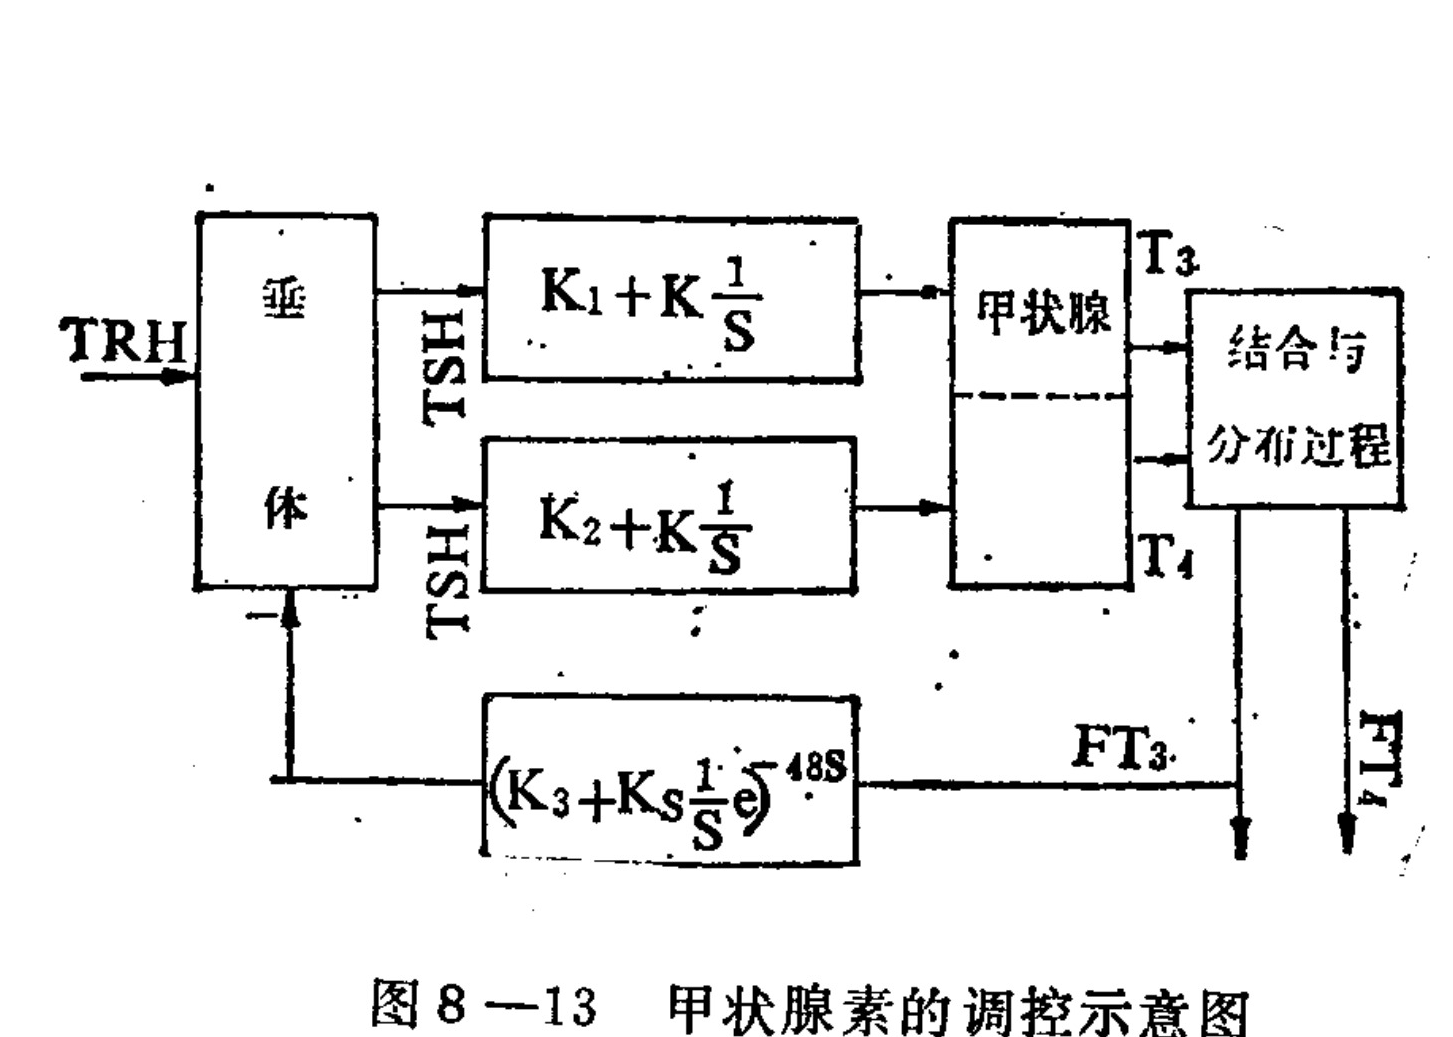
Figure 8-13. Schematic diagram of thyroid-hormone regulation
Translated labels: TRH; Pituitary; TSH; Thyroid; T3; T4; Binding and distribution process; FT3; FT4
To analyze the dynamic changes of thyroid hormones in the body further, the body should be divided, according to the distribution and metabolic processes within it, into several compartments, with the hormone content in each compartment regarded as a variable; that is, the distribution-and-metabolism schematic in Figure 8-13 should be further decomposed.
The two thyroid hormones are distributed among, and eliminated from, different parts of the body at different rates. Some T₄ is converted to T₃ in tissues at different rates, and in the plasma the hormones bind to and dissociate from plasma proteins. Therefore, each of the two hormones is divided into three subsystems. The plasma compartment, through binding to and dissociation from proteins, allows the two forms to interconvert; the liver and other regions with rapid distribution and clearance are distinguished from regions such as muscle, where metabolism is slow. This gives a six-compartment model, as shown in Figure 8-14. x₁, x₂, and x₃ respectively represent the T₃ concentrations in the plasma, fast, and slow compartments; x₄, x₅, and x₆ respectively represent the T₄ concentrations in the plasma, fast, and slow compartments; C₁₅, C₁₆, and C₁₇ respectively represent the volumes of the three compartments, while Cᵢ and Cₐ are the conversion and elimination coefficients. From this figure, the corresponding equations can be written directly. For example:
ẋ₁ = [U₁ + c₅x₃ + c₂x₂ − c₁x₁ − c₄x₁] / c₁₅
That is, the rate of change of T₃ in the plasma is proportional to the amount secreted by the thyroid and the amount transferred from the fast and slow compartments into the blood, minus the amount transferred from the blood into the fast and slow compartments, and is inversely proportional to the plasma volume. The equations for the other five variables can be written in the same way and are not listed one by one here. Thus, a sixth-order system of differential equations with 17 coefficients is obtained. In addition, because the process of hormone binding to proteins is faster than the metabolic process, it can be represented by two nonlinear algebraic equations. Together, these two sets of equations constitute the dynamic model of thyroid hormones.
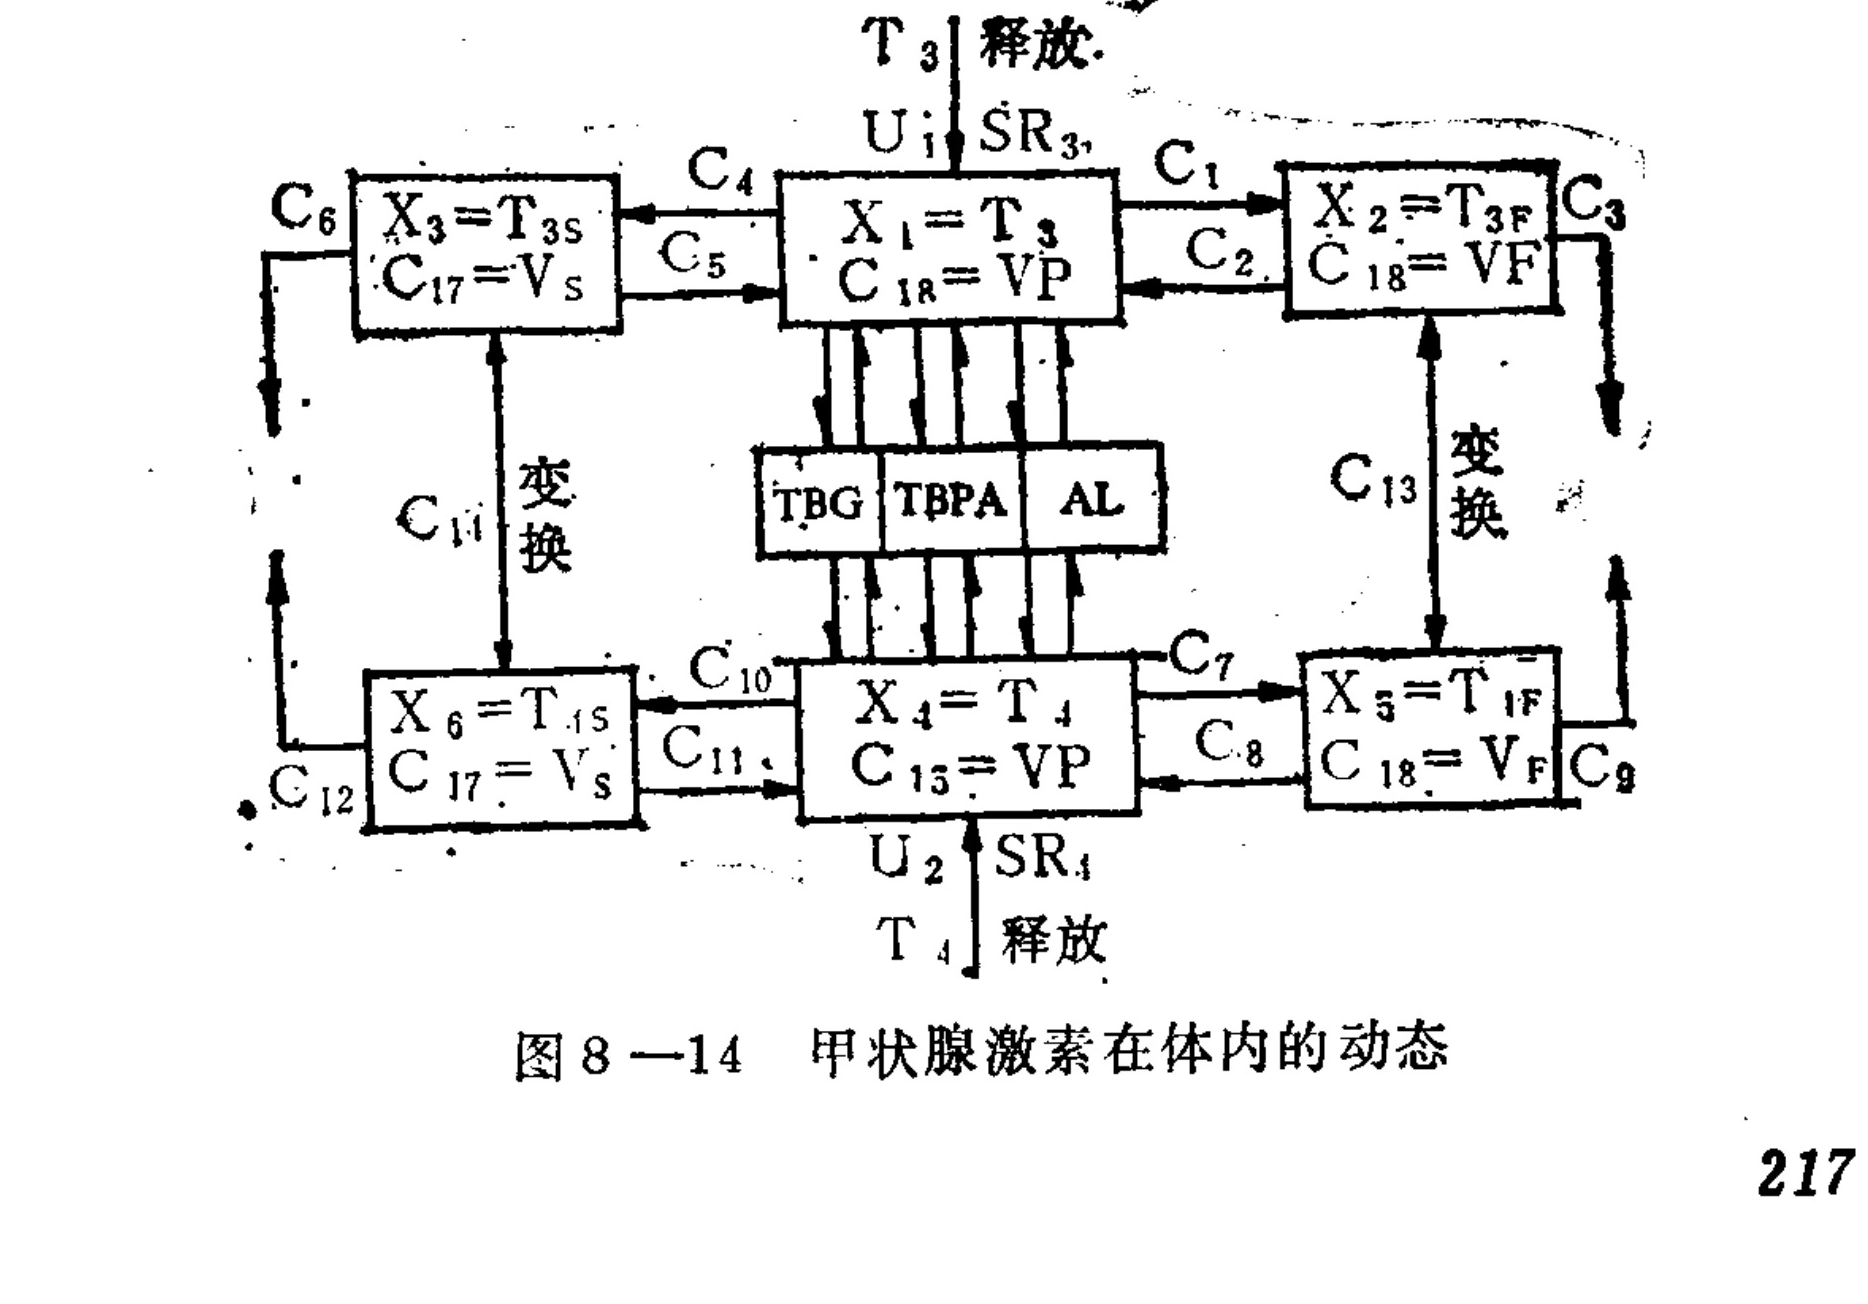
Figure 8-14. Dynamics of thyroid hormones in the body
Translated labels: Release; Conversion; TBG; TBPA; AL
Applying the above model, the relevant coefficients were obtained by means of system-identification methods. In the identification experiment, radiolabeled drugs 131I-T3 (u1) and 125I-T4 (u2) were injected into a vein. After a certain period of time, blood samples were taken for testing; Figure 8-15 is a curve plotted from the test data. Twelve of the parameters were estimated by the random-search method, eight of which could not be obtained by conventional methods. This provided important new information about the physiology of thyroid hormones. For example, according to the preliminary experimental results, from the calculated conversion rate of tetraiodothyronine (T₄) into triiodothyronine (T₃), only 16% of the body’s T₃ is directly secreted by the thyroid, while the remaining 84% is converted from T₄ in peripheral tissues. The production rate of T₃ is a useful indicator for diagnosing thyroid function and certain clinical pathologies, and it is related to obesity and the aging process. Thus, constructing the model provides a new means for the development of medicine.
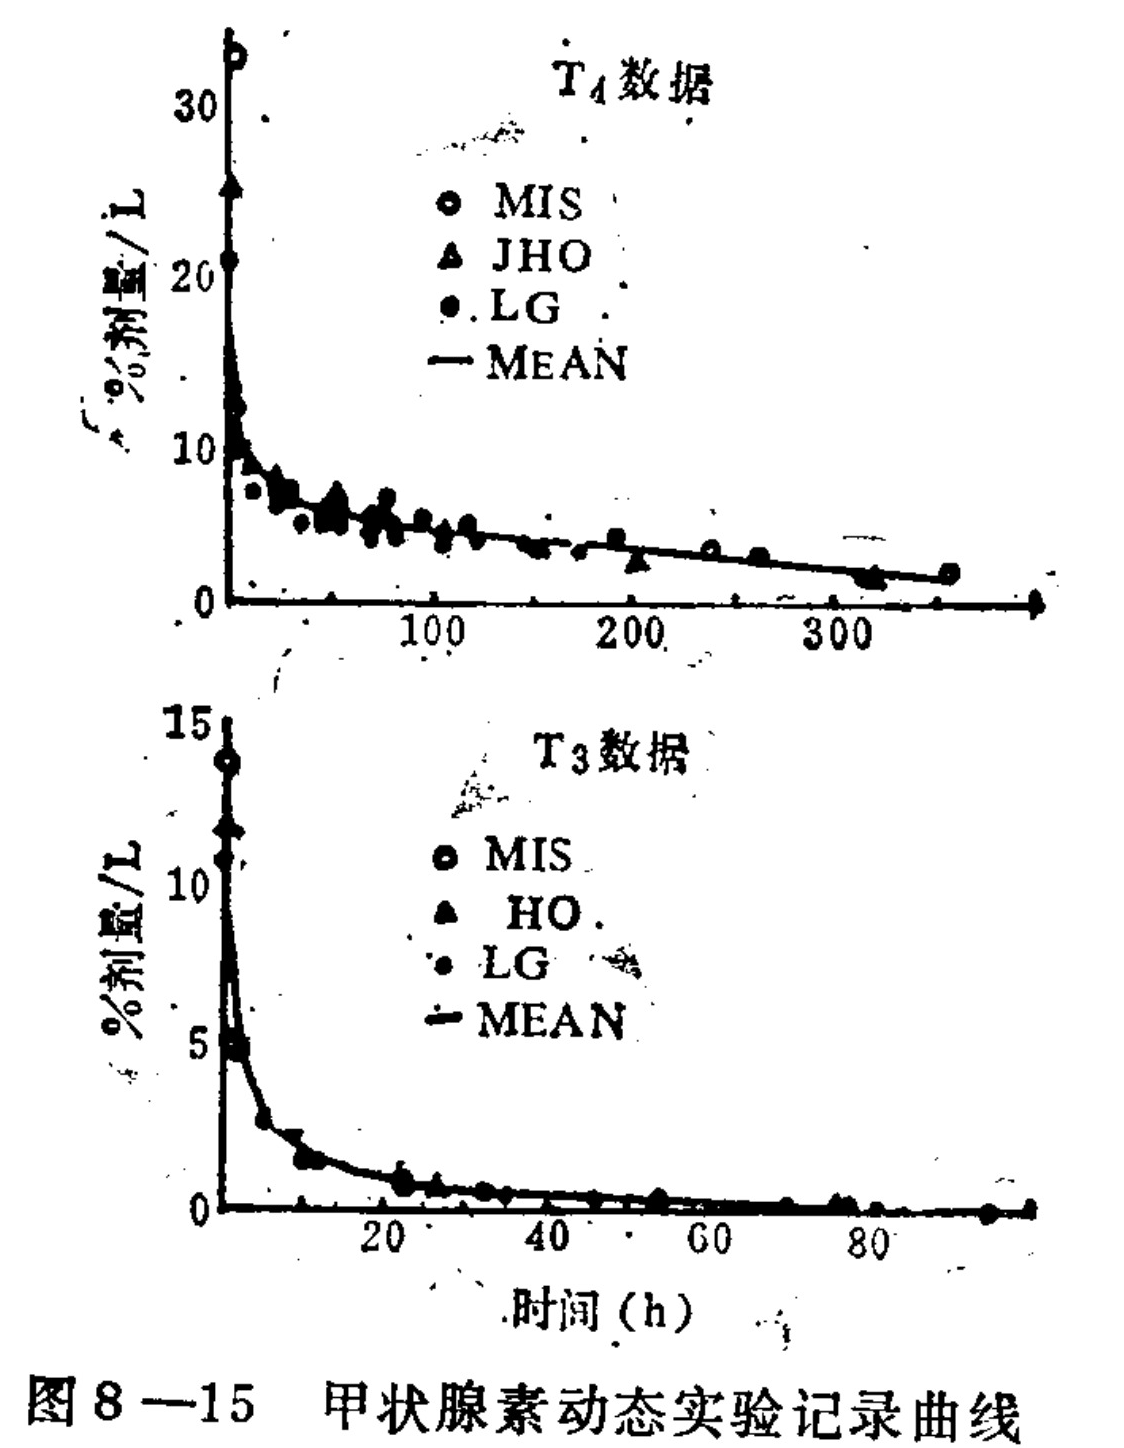
Figure 8-15 Dynamic experimental recording curves of thyroid hormone
Translated labels: T4 Data; MIS; JHO; LG; MEAN; % dose/L; T3 Data; HO; Time (h)
3. Feedback-control model of ovarian activity
The ovary is an important reproductive organ as well as an endocrine gland; it secretes female hormones and progesterone. Its basic activity is carried out under hormonal control. Under normal conditions, a human ovary releases one egg approximately every 28 days and secretes the corresponding hormones, preparing for fertilization, implantation of the egg, and pregnancy. Ovarian activity is controlled by follicle-stimulating hormone (FSH) and luteinizing hormone (LH), which are secreted by the pituitary gland. FSH causes the egg to develop and mature, but the egg can be released only when there is a certain concentration ratio between FSH and LH. In addition, hormones secreted by the ovary and corpus luteum, such as estrogen and progesterone, in turn act on the hypothalamus and pituitary gland. Through luteinizing-hormone-releasing factor (LHRF) and prolactin-inhibiting factor (PIF), the hypothalamus controls the pituitary’s hormone secretion, forming a complex feedback-control system that controls the ovary in completing its physiological functions. Figure 8-16 is a control-model diagram of ovarian activity.
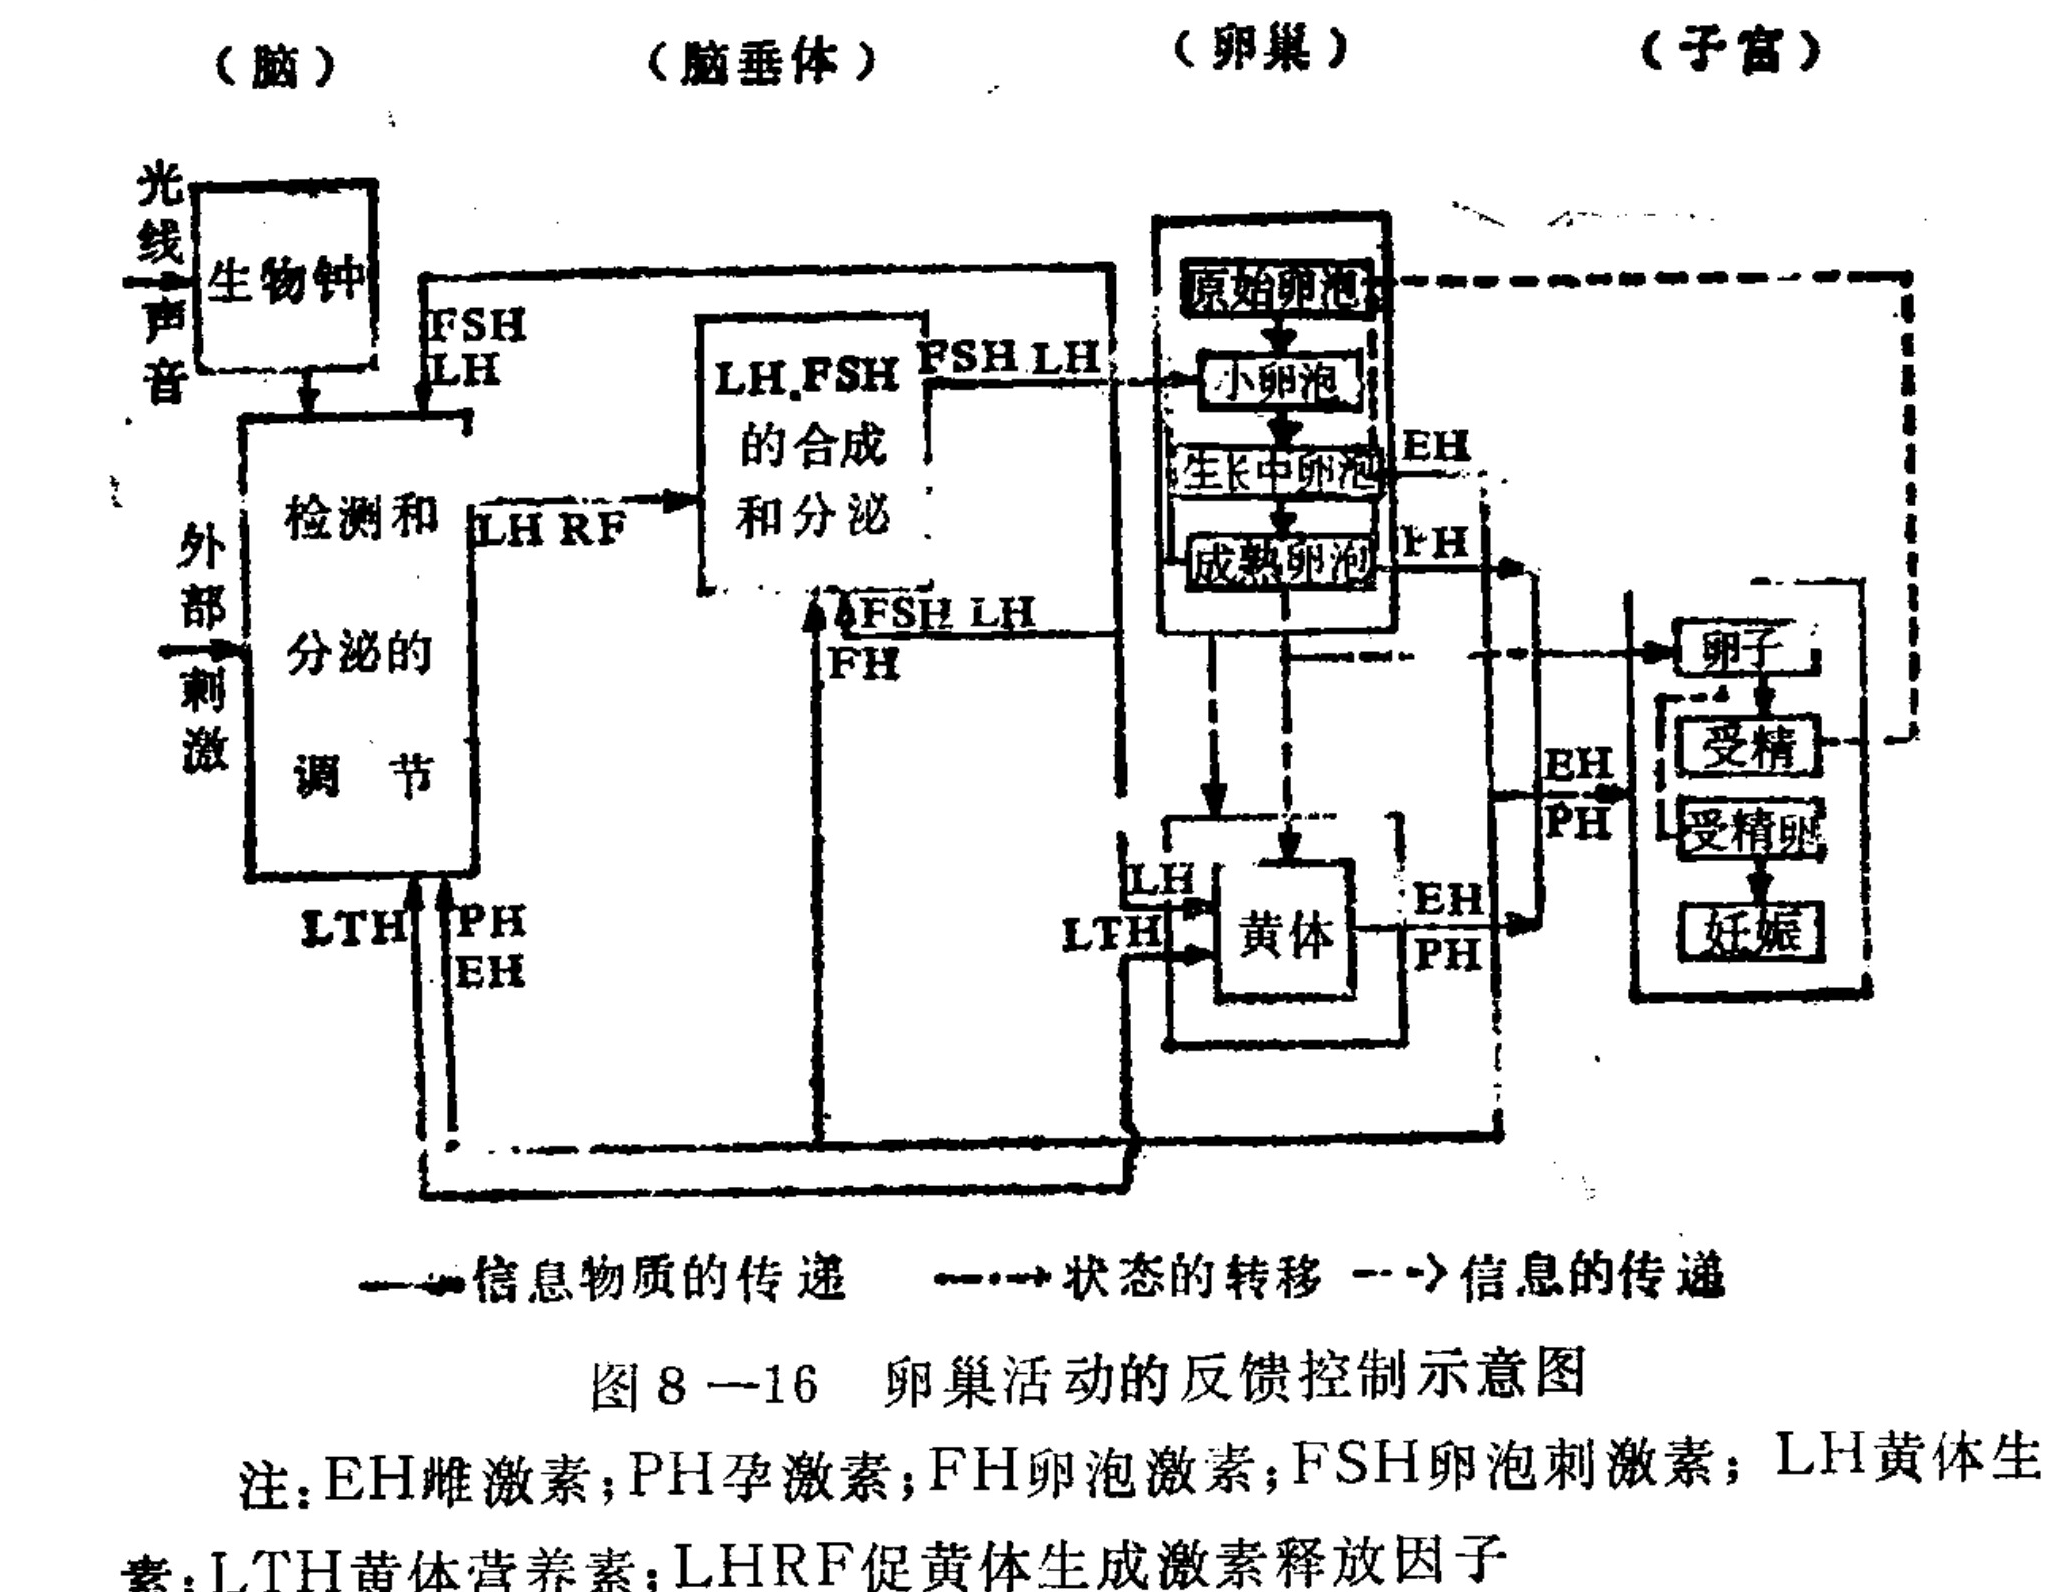
Figure 8-16 Schematic diagram of feedback control of ovarian activity
Translated labels: Brain: Biological clock; External stimuli: Light, Sound; Detection and secretion regulation; Pituitary gland: Synthesis and secretion of LH, FSH; Ovary: Primordial follicle, Small follicle, Growing follicle, Mature follicle, Corpus luteum; Uterus: Ovum, Fertilization, Zygote, Pregnancy; Hormones: LHRF, FSH, LH, EH, PH, FH, LTH
Note: EH estrogen; PH progesterone; FH follicular hormone; FSH follicle-stimulating hormone; LH luteinizing hormone; LTH luteotropin; LHRF luteinizing hormone-releasing factor
The figure indicates only the principal interrelationships. Among these interrelationships are many nonlinear links; there is both negative feedback and positive feedback that arises under certain conditions. Therefore, the dynamic process of this system does not maintain the hormones at relatively stable levels, but instead produces periodic changes.
This periodic change is precisely what is necessary for the ovary to perform its reproductive function. During the periodic process, progesterone has a very low concentration before ovulation, but the mature follicle secretes a large amount of estrogen, causing the pituitary to secrete a large amount of luteinizing hormone and thereby promoting ovulation, forming a positive-feedback process. After ovulation, the residual follicle forms a corpus luteum and secretes large amounts of estrogen and progesterone. In addition to acting on the uterus and causing it to undergo secretory-phase changes, the two hormones exert negative feedback on LH. If fertilization does not occur, the corpus luteum degenerates, causing progesterone to fall sharply and causing the uterus to undergo menstrual-phase changes. This sequential appearance of positive and negative feedback is most important for the formation of periodic activity.
On the basis of the qualitative analysis above, the dynamic differential equations governing this process can be written. Some researchers have analyzed the relationships among the various hormones during the sexual cycle of rats, taking into account such factors as hormone inactivation by the liver and excretion by the kidneys, and have established a dynamic model of the corresponding process. They also conducted simulation studies of this model on an electronic computer. Some parameters in the simulation model—that is, the coefficients of the equations—were obtained through animal experiments. Other parameters were difficult to obtain experimentally and were selected in the simulation by trial and error. Figure 8-17 shows the changes in the secretion cycles of rat sex hormones obtained through computer simulation. The simulated results were basically the same as the animals’ actual conditions. This shows that, through the construction of mathematical models and electronic-computer simulation, cybernetic modeling methods can not only clarify the mechanisms controlling the sexual cycle but also provide quantitative conclusions. On this basis, it is also possible to study the various changes that may occur when regulation and control are abnormal, as well as to investigate ways of controlling this process toward specified objectives.
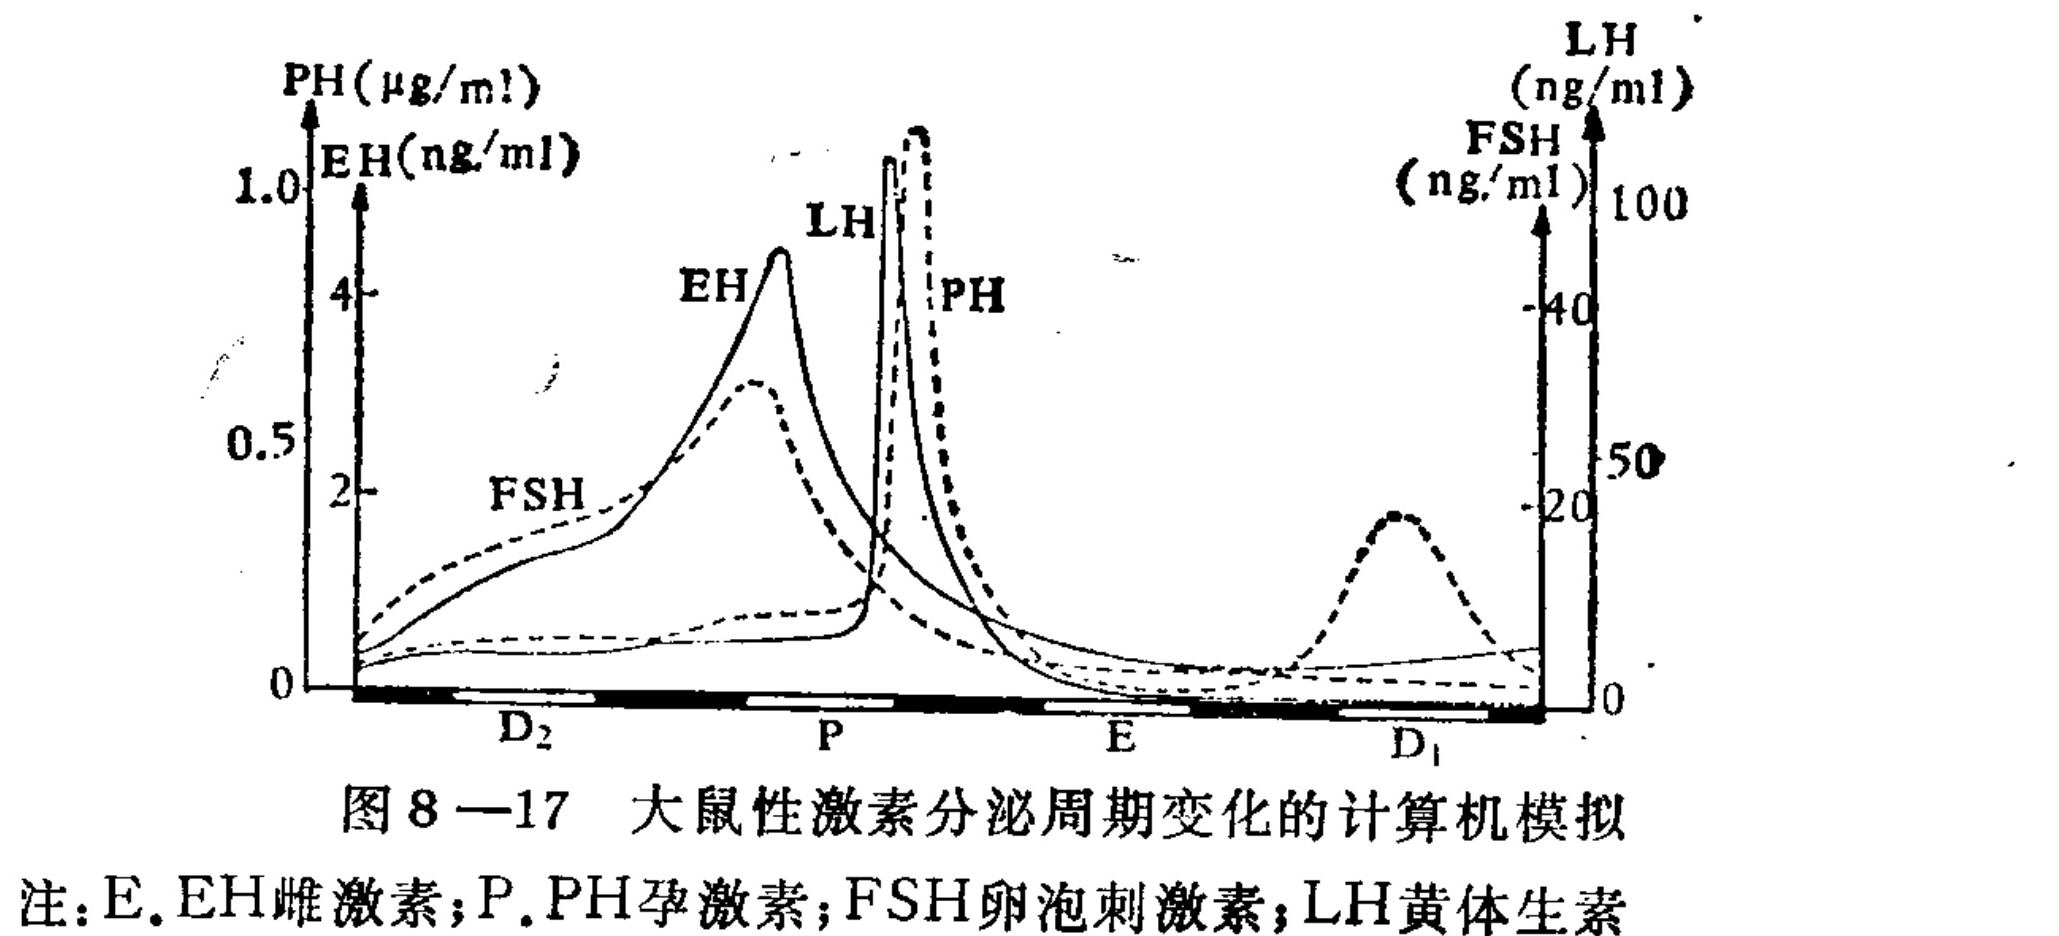
Figure 8-17 Computer simulation of the sex hormone secretion cycle in rats
Translated labels: LH: Luteinizing hormone; FSH: Follicle-stimulating hormone; PH: Progesterone; EH: Estrogen; D2, P, E, D1: Estrous cycle stages Note: E, EH estrogen; P, PH progesterone; FSH follicle-stimulating hormone; LH luteinizing hormone.
IV. Effects of qigong on the endocrine system
Because the endocrine system plays an important role in regulating the body’s overall functions, it can be imagined that at least part of qigong’s influence on the body’s regulatory and control processes is realized through its effects on the endocrine system. Some preliminary observations have already been made of changes in blood endocrine-hormone levels in the qigong state.
The Air Force Lanzhou Hospital and Lanzhou People’s Hospital observed the blood-hormone levels of 67 healthy adolescent students before and after qigong practice (after 90 days of practice). Measurements were made twice before and after practice. Using radioimmunoassay, they separately measured the levels of T₃ (triiodothyronine), T₄ (thyroxine), cortisol (hydrocortisone), and growth hormone. The results are shown in Table 8-1.
Table 8-1. Hormone levels before and after qigong practice in 67 cases
| T₃ (ng/ml) | T₄ (ng%) | Cortisol (ng/ml) | Growth hormone (ng/ml) | |
|---|---|---|---|---|
| Before practice | 1.81 ± 0.36 | 14.71 ± 3.47 | 15.99 ± 4.33 | 7.11 ± 5.4 |
| After practice | 1.03 ± 0.21 | 12.17 ± 3.69 | 12.48 ± 4.97 | 8.86 ± 6.16 |
| P | <0.001 | <0.001 | <0.001 | >0.05 |
It can be seen that the first three hormones decreased significantly, while growth hormone increased slightly after practice, but not significantly. The decrease in thyroid hormones may be related to qigong’s lowering of the body’s metabolic rate while increasing the efficiency of its physiological functions. The effects of qigong should not be evaluated solely from the increase or decrease in quantities; instead, they should be observed in terms of whether they benefit the body. Thus, qigong can often cause certain physiological indicators to undergo bidirectional changes.
Some observations have been made abroad of the effects of qigong practice on plasma hormone levels. For example, prolactin and hydrocortisone in the plasma were measured in three groups of subjects—long-term practitioners, short-term practitioners, and non-practitioners—before, during, and after practice. The experiment corresponded to three stages
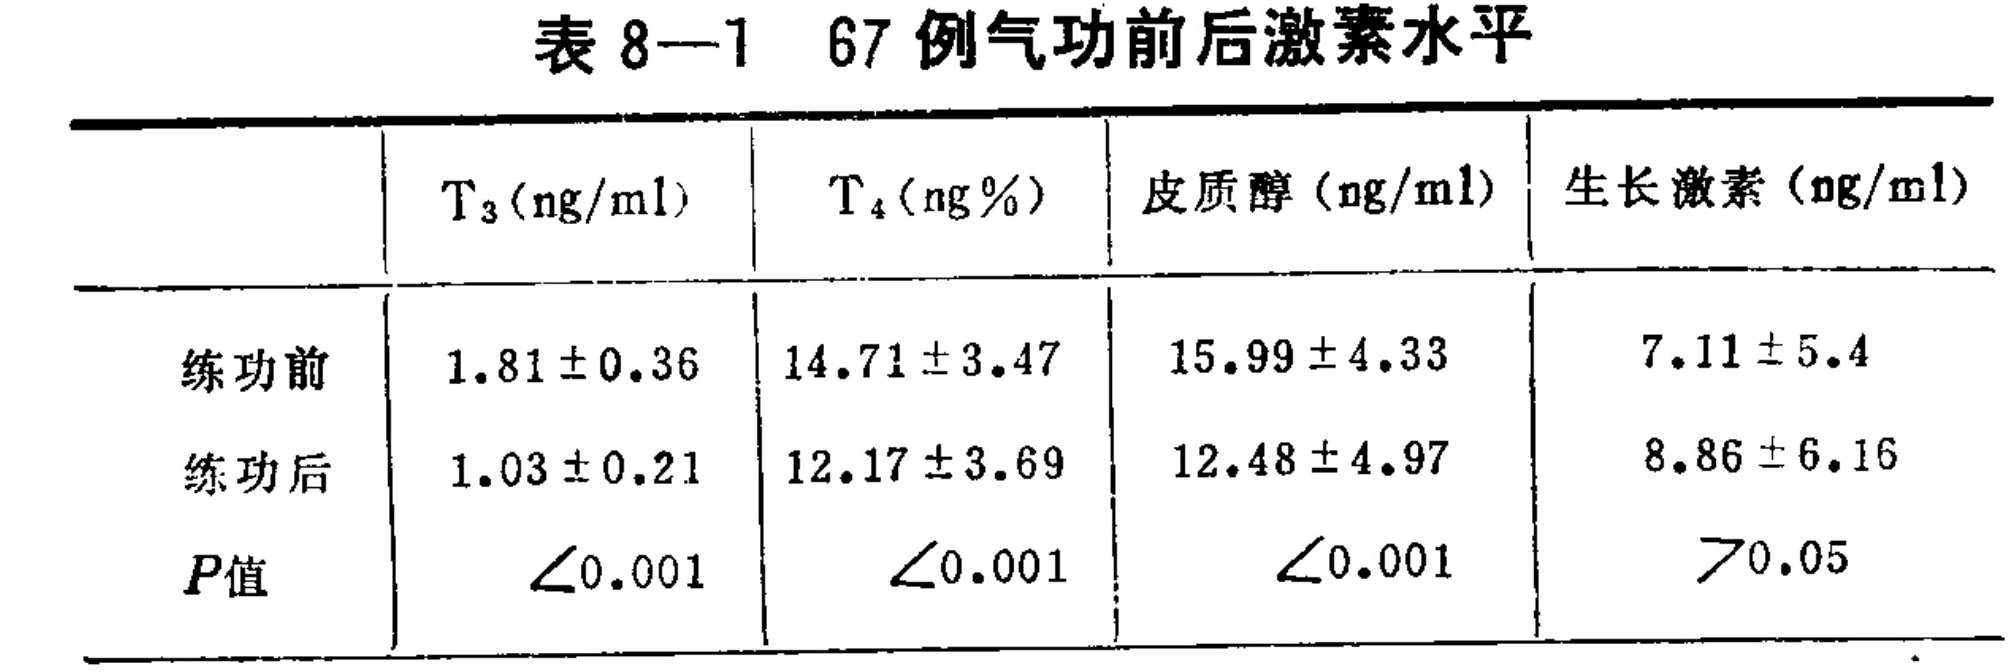
Table 8-1 Hormone levels in 67 cases before and after Qigong practice
Translated labels: T3 (ng/ml); T4 (ng%); Cortisol (ng/ml); Growth Hormone (ng/ml); Before practice; After practice; P value
Every 40 minutes, blood was sampled once every 20 minutes and measured by radioimmunoassay; the results are shown in Table 8-2.
Table 8-2. The effect of qigong function on plasma hormones (mean ± s)
| Group | Prolactin (ng/ml), P < 0.05 | Cortisol (μg%), P < 0.05 |
|---|---|---|
| Control group | 7.6±2.6; 6.9±2.3; 7.3±2.2 | 9.6±2.1; 10.2±2.4; 8.9±2.3 |
| Long-term qigong-practice group | 7.0±2.2; 7.3±2.6; 9.6±3.4 | 5.7±1.8; 4.3±1.2; 4.9±1.3 |
| Short-term qigong-practice group | 6.8±2.3; 8.2±2.1; 11.0±3.2 | —; —; — |
It can be seen that qigong function significantly increases the prolactin level, but lowers the corticosteroid level. An effect continues after stopping the practice: prolactin is even higher after stopping than during practice. This may be due to the relatively large time constant of this regulatory system. Thus, the effects of qigong may be delayed but long-lasting. The significance of these changes remains to be explored.
The Qigong Institute of Beijing College of Traditional Chinese Medicine made a preliminary observation of qigong treatment for diabetes. Among 13 patients, 11 had non-insulin-dependent diabetes. Before and after 26 days of qigong treatment, SRR was performed, and symptoms generally improved. Of the 12 patients whose urine sugar was originally ++++, one was originally ++; after treatment, only 5 were ++, 7 were +, and 1 was −. During qigong treatment of 11 non-insulin-dependent patients, medication was discontinued, and blood-glucose values were measured while medication was being used, after discontinuation, and after qigong treatment. The mean blood glucose before discontinuation was 220.09 mg%; the mean peak after discontinuation was 290.00 mg%, while after qigong treatment it fell to 188.55 mg%. These preliminary findings indicate that qigong has an effect in treating diabetes. Qigong may affect the secretion of insulin by pancreatic cells, and may also affect the glucose receptors and insulin receptors of cells.
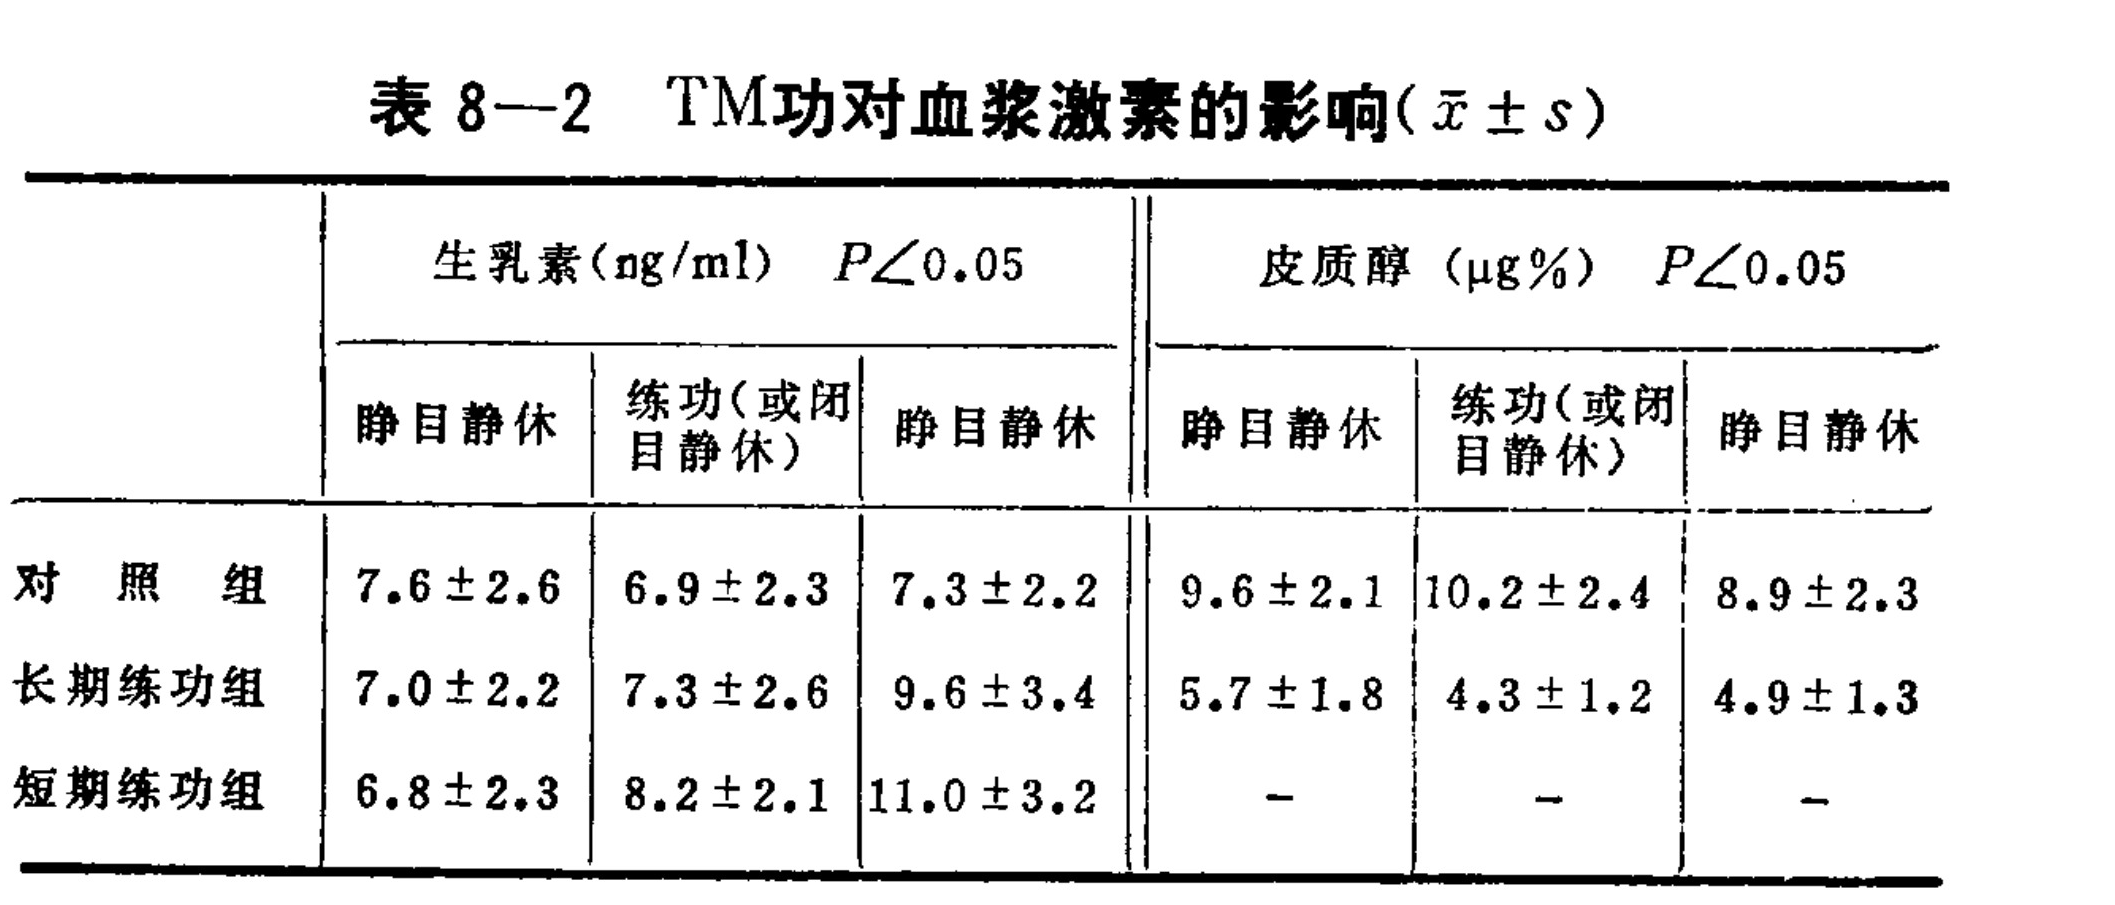
Table 8-2 Effect of TM practice on plasma hormones (mean \pm SD)
Translated labels: Table 8-2; Effect of TM practice on plasma hormones; Prolactin (ng/ml); Cortisol (\mu g%); P<0.05; Eyes closed rest; Practice (or eyes closed rest); Control group; Long-term practice group; Short-term practice group
Chapter Nine: Biofeedback
Biofeedback uses engineering techniques to enable people to perceive changes in certain physiological parameters of their own bodies. On this basis, people learn to consciously control their own psychophysiological activities, thereby adjusting bodily functions and treating disease. Thus, biofeedback training has certain similarities to qigong. Understanding the theory and practice of biofeedback is useful for clarifying the principles of qigong. In this chapter, we will discuss the principles of biofeedback, biofeedback equipment and technology, and applications of biofeedback. Finally, we will compare the similarities and differences between qigong and biofeedback.
I. Principles of Biofeedback
Biofeedback is a product of the combination of biocybernetics, modern psychology, and engineering technology. The development of cybernetics deepened people’s understanding of the body’s regulatory and control processes and led to recognition of the important role of feedback control within the organism. It inspired people to seek ways of using various kinds of feedback information to improve and enhance their ability to regulate and control the body. In the early 1960s, the American experimental psychologist Miller and others established operant conditioning of autonomic activity in humans and other animals, thereby revealing the possibility of controlling the viscera and other internal-environment systems of the body through consciousness. The issue of operant conditioning of visceral activity was introduced in Section 6 of Chapter 2 and will not be repeated here. The successful therapeutic use of qigong, yoga, and other relaxation training also promoted the development of biofeedback applications.
During biofeedback training, a particular controlled physiological variable, or a variable closely related to the control goal, is generally measured in a targeted manner. The measured variable is then fed into the body in a form readily accepted by the sensory system, such as a sound or a signal of changing light intensity or color. This signal indicates whether the bodily state is approaching the goal.
If the aim is to treat a headache, the electromyographic signal from the forehead can be measured. A decrease in electromyographic activity reflects a reduction in the degree of muscle tension and can relieve the headache. After processing, the electromyographic signal can be converted into sound: a lower volume or lower pitch can correspond to weaker electromyographic activity. The patient therefore learns the degree of muscle tension by perceiving the loudness or pitch of the sound. The patient can change their state of consciousness, causing the sound to change, and thereby discover whether this change induces muscle relaxation. Guided by the sound signal, the patient gradually learns, through practice and trial of success and failure, to master control of their subjective state of consciousness, achieving muscle relaxation and relief of the headache. Thus, biofeedback training involves perceiving the internal state of the organism under the indication of a feedback device (or instrument), seeking through trial and training a suitable subjective state of consciousness, and thereby controlling the development of an objective physiological process. In other words, through training, it develops the ability of subjective consciousness to control the objective internal environment.
Biofeedback therefore establishes a new bridge between subjective consciousness and objective physiological activity, a connection that does not exist in ordinary daily life. The principle of biofeedback is shIn ordinary daily life, subjective consciousness and objective physiological processes are also connected, as shown by the solid lines in the figure. For example, when a strong
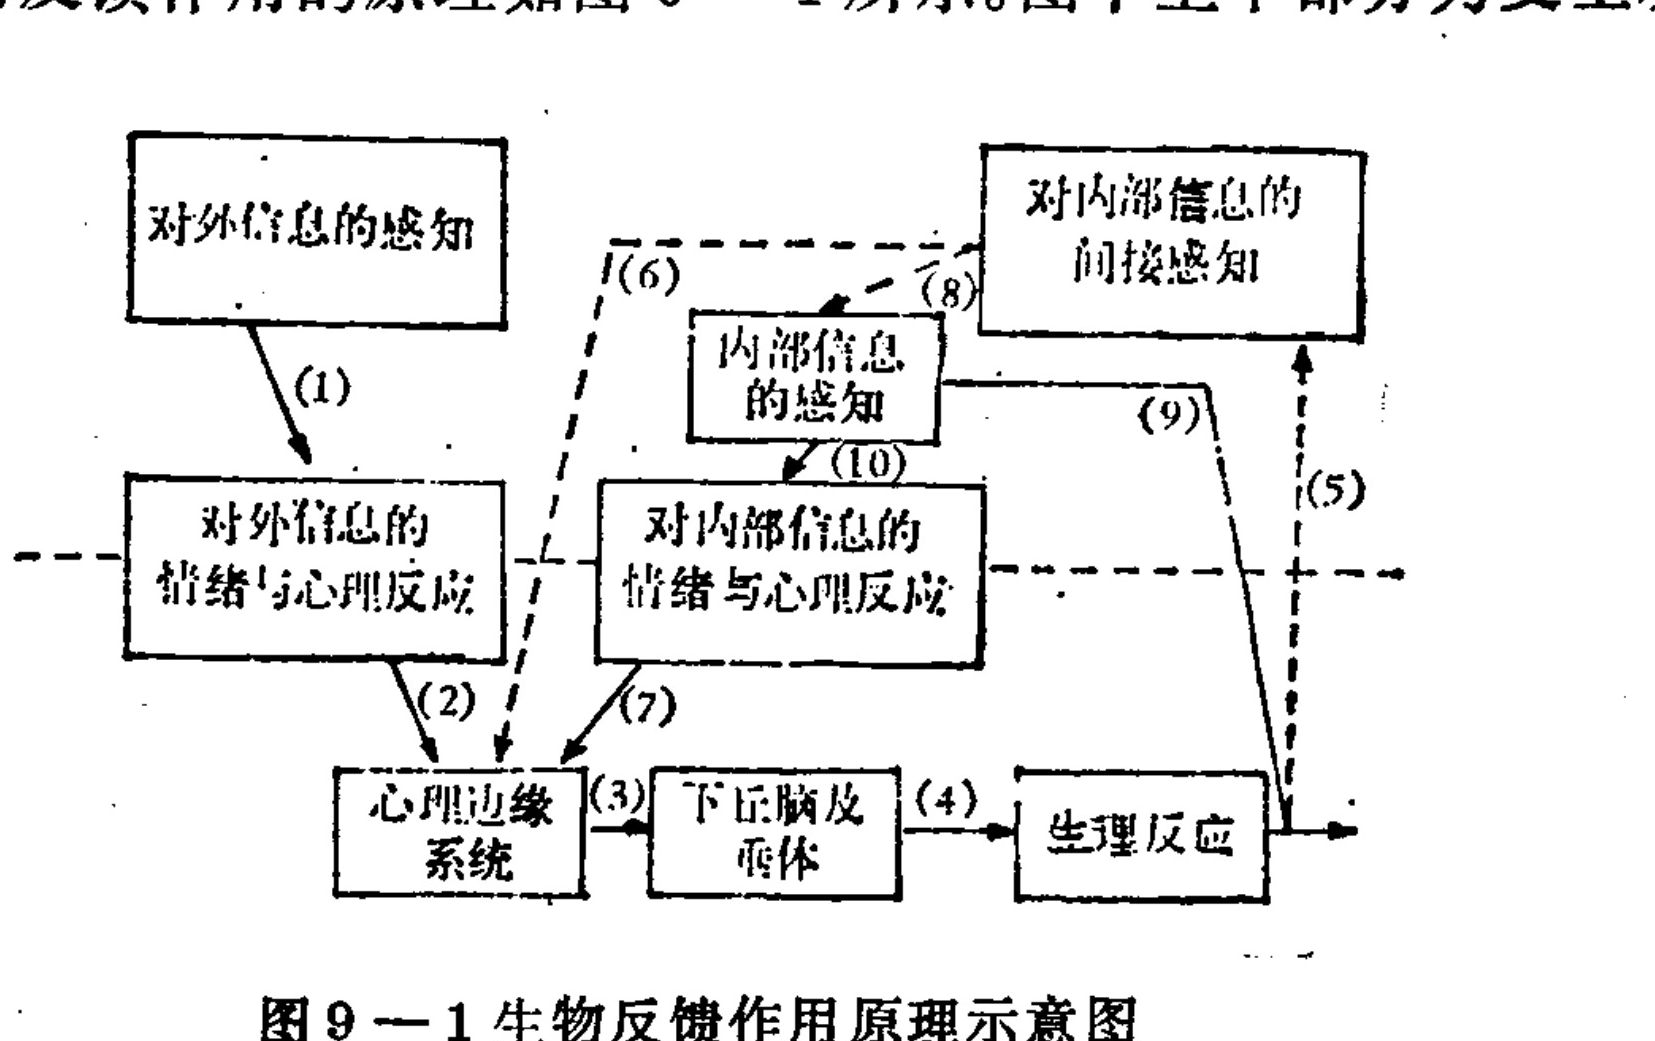
Figure 9-1 Schematic diagram of the principle of biofeedback action.
Translated labels: Perception of external information; Emotional and psychological response to external information; Limbic system; Hypothalamus and pituitary gland; Physiological response; Perception of internal information; Emotional and psychological response to internal information; Indirect perception of internal information
stimulus is received by the senses, it produces a stress response through connections ①→②→③→④, but this response is generally not under subjective control.
Biofeedback provides an indirect indication of internal-state information through a feedback device, enabling the organism to perceive changes in its physiological condition. the internal-information feedback loop ⑨→⑩→⑦. This loop is also normally imperceptible and not under subjective control. Qigong may increase the control capacity of this loop, thereby improving physiological responses.
Because of the latent plasticity of living organisms, when biofeedback training is repeated, the perception of internal information can also be changed through the connection of ⑧. Thus, when the feedback device is absent (that is, after feedback is withdrawn), regulation and control of the physiological process may still be maintained. Therefore, biofeedback equipment can also serve as a tool for qigong or relaxation training, helping people improve their ability to perceive the internal state of the organism and achieve conscious control of that internal state.
II. Biofeedback Equipment
Biofeedback training requires the assistance of special equipment. Such equipment should enable the subject, through information about the state of the organism that it provides, to perceive internal bodily states that cannot normally be perceived. In this way, the subject learns to control these internal states through consciousness and achieves the therapeutic objective. In general, biofeedback equipment should include three parts: biological-signal detection, biological-signal processing, and generation of the feedback signal. Its basic structure is shown in Figure 9-2. The requirements for each part are outlined below.
1. Biological-Signal Detection
To conduct feedback training effectively, it is necessary to measure physiological vari
Signal detection → Signal processing → Feedback signal → Generation → Biological signal → Subject → Audio-visual display
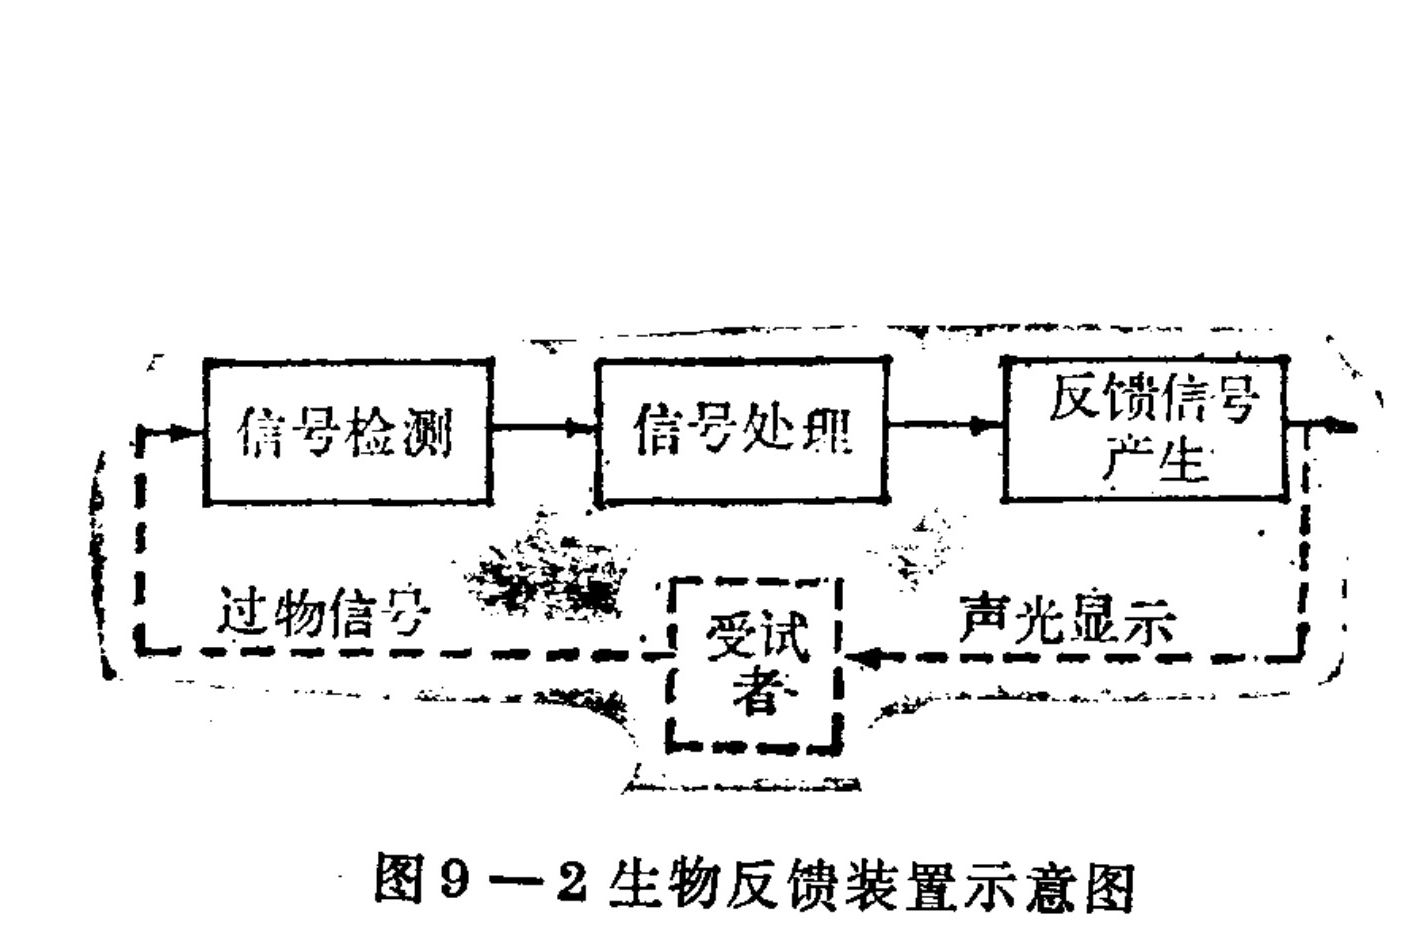
Figure 9-2. Schematic diagram of a biofeedback apparatus
Translated labels: Signal Detection; Signal Processing; Feedback Signal Generation; Bioelectric Signal; Subject; Audio-Visual Display
ables related to the purpose of control. These variables may take the form of biopotentials, pressure, flow, impedance, temperature, displacement, velocity, acceleration, or chemical concentration. Signals currently used in clinical treatment include electromyography, skin temperature, electroencephalography, electrocardiography, skin resistance, heart rate, blood pressure, blood-vessel volume, end-tidal respiratory carbon-dioxide partial pressure, gastrointestinal pH, rectal pressure, and others. In a biofeedback apparatus, the detection of these physiological signals is similar to the input section of an ordinary physiological-signal measuring instrument. First, they must be converted into electrical signals. The principal requirements are a suitably designed transducer and input circuit. Because biofeedback is performed on the human body, transducers and their installation positions are subject to certain special requirements. During preprocessing of biological signals, care should be taken to filter interference within the measurement band; particular attention should be paid to interference from mains electricity (50 Hz). A dedicated 50-Hz band-stop filter is generally required. The wires from electrodes and other transducers should be shielded, and experiments should be conducted in a shielded room whenever possible. The input circuit should use differential input and improve the common-mode rejection ratio. In addition, a calibration circuit should be provided.
2. Biological-signal processing
Signals output by the transducer and filter generally cannot be used directly as biofeedback output signals. They therefore require further signal processing to obtain signals that better reflect the physiological process and are easier to perceive. Common forms of signal processing include filtering, detection, spectral analysis, and voltage-controlled oscillator circuits (converting voltage into frequency signals). Biological-signal processing and conversion can be implemented with electronic or computer technology.
Simple signals need only undergo preprocessing before they can be used directly to control the feedback signal.
For example, after an electromyographic signal has been filtered and detected, its amplitude information can be extracted and used to control a voltage-controlled oscillator, converting the magnitude of the electromyographic signal into audio tones of different frequencies and thereby producing a continuous auditory feedback signal. The electromyographic amplitude signal can also be used to control an LED array and fed back to the subject visually. In heart-rate feedback control, techniques such as zero-crossing detection can be used to measure the heart rate, after which it is compared with a prescribed target value to control a binary feedback signal. Alternatively, the heart-rate signal can be multiplied by several dozen so that its frequency falls within the audio range, thereby converting heart-rate information into changes in an audio signal.
More complex signals require digital-signal-processing techniques to extract their information. An electroencephalographic signal contains many components. Although it can be simply divided in the frequency domain into several bands, with filters used to separate the individual components before controlling a feedback signal returned to the subject, this method often has disadvantages such as complex hardware and inaccurate processing. If a computer is used to perform spectral analysis in software and calculate the relationships among the various frequency bands, implementation and accurate processing are easier, and the method is more general-purpose. When the feedback band needs to be changed, it is only necessary to call the corresponding program; there is no need to redesign the filter, providing considerable flexibility.
3. Feedback-signal output
To make biofeedback more effective, the output of the feedback apparatus should be readily accepted by the human sensory system. Vision and hearing are relatively refined sensory systems in humans; consequently, visual or auditory signals are used mainly as the output of biofeedback apparatuses in practical applications. Outputs combining these two types of signal are also used. As with physiological-signal processing, the form of the biofeedback signal output depends on the nature of the physiological signal and on the feedback training being designed. The output signal may be continuous or discrete. Sometimes a signal proportional to the measured physiological variable is used as the output; at other times, a simpler signal with only a few states is used, such as a binary feedback signal.
Because biofeedback training uses conscious activity to produce control over visceral activity governed by the autonomic nervous system, it can also be described as establishing an operant conditioned reflex for visceral activity. Operant conditioning of the autonomic nervous system is generally much more difficult to achieve than conditioning in the voluntary nervous system. Therefore, biofeedback training often uses behavioral-shaping techniques to achieve the final objective step by step. The so-called behavioral-shaping method gradually increases the subject’s ability to regulate and control the physiological state throughout the training process. Based on the subject’s baseline physiological state and the objective of the training, an appropriate target value (an instantaneous target value) is set. According to the training results, the target value—the difference from the baseline—is gradually increased, and the final target value reached is the ultimate objective.
In accordance with the requirements of behavioral shaping, the output signal of the feedback apparatus is often designed in binary form. That is, a target value is set for the apparatus. When the output value of the measured physiological variable is greater than (or less than) this target value, one type of signal is output; when the output value is less than (or greater than) the target value, no signal is output. Thus, throughout the training process this output signal has only two states, on and off—that is, a binary condition. The subject is required to try to keep the output signal in the on state. As the training effect improves, the target value is continuously increased (or decreased). Under the requirements of the new target value, the subject again tries to keep the output signal switched on, thereby achieving progressively improved results.
Binary signal output, or other relatively simple forms of feedback signal, is generally used for biofeedback training that is difficult to accomplish, or for certain biofeedback training in which only a rough estimate is especially needed (such as determining direction). In EEG biofeedback training, for example, the signal is closely related to the subject’s psychological state and degree of emotional tension. Continuous forms of output signal, such as pointer-based or precise numerical signals, should therefore be avoided as far as possible; a discrete, simpler feedback signal having only a few states is preferable. In biofeedback training involving EMG, abdominal pressure, and similar variables, a continuous mode—such as a pointer or numerical signal—can generally be used as the output, because these physiological variables are not closely related to the subject’s psychological activity. Moreover, feedback training uses a trial-and-error method and requires continuous observation of the relevant physiological activity and its changes.
The choice between a visual signal and an auditory signal should be determined according to the subject of the feedback training. For example, in EEG feedback research the α-wave band mainly uses an auditory signal to obtain feedback information with the eyes closed; with the eyes open, either an auditory or a visual signal may be used. When the EEG θ-wave band is used to treat insomnia, an auditory signal with the eyes closed is commonly used. When the EEG β-wave band is used to study higher brain activity, a visual signal with the eyes open is commonly used. For visually perceived signals that are continuous in time and continuous in amplitude, meter pointers, LED arrays, digital display tubes, and similar devices are commonly used. Whereas for…
When the output signal is perceived auditorily and has a continuous amplitude, its level is commonly represented by the pitch of a tone; when a binary signal is output, the presence or absence of sound can be used simply to represent it.
III. Clinical applications of biofeedback
Biofeedback based on different physiological variables has been applied to the treatment of different clinical disorders. Biofeedback treatment has achieved relatively good results for psychosomatic diseases. Psychosomatic diseases are physical diseases in which psychological factors play an important role in their onset and development. Such diseases are not easily cured by conventional treatment methods. Biofeedback training helps eliminate physiological disturbances caused by stress. Psychosomatic diseases for which biofeedback training can be used include tension headaches, vascular headaches, certain cardiac arrhythmias, Raynaud’s disease, asthma, gastrointestinal diseases, epilepsy, certain metabolic diseases (such as diabetes mellitus), skin diseases, endocrine diseases, and others. A relatively long training period is generally required: results are gradually obtained after 10–100 training sessions, each lasting several dozen minutes. The feedback parameters and training time used differ among diseases.
Heart-rate biofeedback has been used to treat cardiac arrhythmias, such as premature ventricular contractions and tachycardia, and has achieved a certain degree of effectiveness. Skin-temperature techniques can also be used to treat autonomic muscle-tone abnormalities, Raynaud’s disease, and migraine.
Electromyographic biofeedback is currently one of the more widely used types of biofeedback because skeletal-muscle responses are readily brought under conscious control. Clinically, electromyographic feedback has been used to treat tension (muscle-contraction) headaches, pulmonary emphysema, muscle paralysis, spastic cerebral palsy, foot drop after stroke, and functional-recovery training for dysfunction caused by pathological changes in the motor system. For example, the primary cause of muscle-contraction headaches is prolonged, sustained contraction of the muscles of the face, scalp, and neck. At rest, the electromyographic level of the patient’s frontal muscles is higher than that of normal people. Patients often try to relieve the symptoms by squeezing, pressing, or rubbing, but these methods
This often causes increased local muscle tension and ischemia, which instead makes the headache more severe; traditional therapies are often of little effect for this condition. Frontal electromyographic (EMG) biofeedback relaxation training can be used to enable patients to perceive the degree of tension in the forehead muscles and learn how to reduce muscle tension, thereby relieving the headache. This method is highly effective for most patients and has also achieved relatively good results in some severe, refractory cases, with effects that are quite stable. A foreign report described the treatment results for 9 patients whose average disease history was 20 years (11–39 years) and whose ages ranged from 11 to 64; other treatment methods had been ineffective for these patients. With frontal EMG biofeedback treatment, each session lasted 30 minutes, training was performed 2–3 times per week, and home training was added. Results were generally seen within 1–2 months: before treatment, headaches averaged 95 hours per week, falling to 31 hours per week after treatment. EMG biofeedback has also been used to treat spasmodic torticollis, acute infectious polyneuritis, nonspecific anxiety disorders, facial nerve paralysis, and so on. EMG biofeedback has additionally been applied to rehabilitation-engineering problems, such as training to increase EMG levels so that myoelectric prostheses can be used effectively.
Brain electrical activity reflects excitatory processes within the brain. It has a direct relationship with mental activity and also affects the regulatory control of the organism as a whole. Biofeedback training can alter the frequency and amplitude of brain waves and the proportions of their various components. It may therefore achieve the therapeutic objective for certain diseases. EEG biofeedback is an important aspect of the biofeedback field. The alpha-wave component of the EEG is related to visual activity and also to whether thinking is directed and to the degree of calmness. Alpha-wave feedback can be used to treat conditions such as long-term nonspecific anxiety. The theta-wave component of the EEG is related to the level of arousal and drowsiness, and it often appears during the transition into sleep; theta-wave feedback has been applied to treat insomnia and similar conditions. Epileptic patients often cannot produce the sensorimotor rhythm (SMR) that normally appears in the frontal region, so biofeedback training can be used to induce SMR and thereby treat epilepsy. EEG biofeedback technology can also be applied to research on central-nervous-system conduction, the functions of neural nuclei, and the origin of EEG activity.
Below we introduce a specific example and process of treatment with biofeedback, so that readers can gain a further understanding of biofeedback. This is an example of the successful use of EMG biofeedback to treat long-term facial and laryngeal muscle tension. The patient was a skilled professional woodwind player, specializing in the flute, clarinet, and other instruments; he was 52 years old at the time of treatment. He had a 19-year history of facial and laryngeal muscle tension.
The muscle tension had gradually worsened, seriously affecting his performance level. It had developed to the point that his speaking voice trembled, especially when he pronounced the vowels “i” and “mu.” It was also found that the muscles of his neck and face were excessively tense when he spoke. The patient had used medication and psychotherapy for a long time, but neither had any effect. He therefore switched to EMG biofeedback treatment. Since the patient’s muscles were excessively tense, EMG biofeedback could teach him to consciously lower the corresponding EMG signal and thereby relax the muscles, making EMG treatment appropriate. The EMG biofeedback apparatus in this case used surface electrodes on the skin to detect the EMG signal; after amplification and filtering, the processed signal controlled an array of light-emitting diodes (LEDs). The array consisted of 7 vertically arranged diodes, whose output information was received visually. The system gain was adjusted so that the turn-on voltage of each LED corresponded to EMG peak values of 2.5, 5, 10, 20, or 30 microvolts. If the gain was set to the 10 μV range, with 5 LEDs lit, the EMG peak value was between 50 and 59 microvolts. The filter’s low- and high-frequency cutoff frequencies were 1.0 Hz and 1200 Hz, respectively. The internal noise of the EMG biofeedback apparatus was approximately 2–5 microvolts, depending on the input frequency. The apparatus therefore enabled the patient to perceive the level of his own EMG signal and gradually learn to relax tense muscles. The training proceeded in four stages.
Stage 1: Three training sessions were conducted, each lasting 40 minutes. The electrodes were placed on the frontal muscle and the bridge of the nose, and the electrode polarity was changed during each training session. The system gain was set so that the turn-on voltage of each LED corresponded to an EMG peak value of 10 microvolts. The patient was told to turn off as many LEDs as possible. Once he became familiar with the feedback apparatus, he operated it independently. At the end of the first session, the patient was already able to lower the EMG peak level from 70 microvolts (all 7 diodes lit) to 10–20 microvolts. He maintained this level during the next two sessions. The patient also felt that the muscles around his eyes had relaxed, and the sensation of muscle tension had shifted to the throat.
Stage 2: Three training sessions were conducted. The electrodes were placed over the hyoid muscle region and the mental region along the trachea and larynx, with the reference electrode alternately placed on the left and right mandible. In the first session, lasting 40 minutes, the EMG was reduced from 100 microvolts to 40 microvolts. During the second session, because the patient had performed several times in succession and played different instruments, he reported that his laryngeal muscles were quite fatigued.
After 40 minutes of training, the patient could not reduce the EMG level below 100 microvolts. Before the third session, the patient said that he was disappointed with the result of the previous session, so the system gain setting was lowered in order to encourage the development of his ability to control it. As a result, his relaxation control was better. While imitating flute playing, he managed to turn off as many diodes as possible; finally, the EMG level fell from 35 microvolts to 25 microvolts.
Stage 3: Four training sessions were conducted. During this stage, the patient was moved into a soundproof room; the electrodes were positioned as in Stage 2. In the first session, within 10–15 minutes the patient reduced the EMG from 35 microvolts to 10–5 microvolts. He then played the flute for a short period. After playing, he was required to return as quickly as possible to the relaxed level maintained before playing, namely 10–5 microvolts. On this occasion the patient was able to relax quickly. During the following three sessions, he was able to maintain 10–5 microvolts before playing and quickly return to this level afterward. The patient subsequently reported that not only could he continuously reduce the tension in his throat and mouth muscles during performances, but he also experienced an increasing sense of control. He was therefore asked to train at home and to use the same method to relax his muscles during everyday performances.
Stage 4: Ten training sessions were conducted, none of them in the soundproof room. During the first six sessions, the patient controlled the EMG level at 10 microvolts; during the final four sessions, he further maintained it at 5 microvolts. After Stage 4, the patient trained six more times, at one-month intervals, and was able to keep the EMG at a level of 5–10 microvolts each time. Beginning with Stage 4, the patient’s subjective sensations and performance level both improved significantly. He rose from third-chair player to principal player. From then on, he never again experienced discomfort in the affected area, and no new region of muscle tension was found.
IV. Similarities and Differences Between Qigong and Biofeedback
Qigong exercise and biofeedback training have similarities. An analysis of their relationship, as well as the advantages and disadvantages of their respective purposes, is beneficial to the development of qigong research.
Qigong therapy and biofeedback therapy have many points in common. Both depend on the active action of consciousness to bring the organism into a quiet, relaxed state. By stimulating the body’s latent potential, they automatically adjust internal functions, eliminate factors that produce disease, and achieve therapeutic aims.
Qigong exercise and biofeedback training both require adjustment of cerebral-cortex function and are closely related to psychological processes. Training should generally be conducted in a quiet environment with little interference. Both require a period of training before therapeutic results can be achieved; this may be related to the fact that both involve learning and gradually establishing new connections in the brain.
In terms of regulatory control, the relationship between the two can be seen approximately in Figure 9–3. In general, they are similar. In the figure, the double-arrow lines are information pathways shared by both; the solid lines are information pathways for qigong, and the dashed lines are information pathways for biofeedback. In both cases, the active control of consciousness plays the leading role. Consciousness influences the control center for the internal environment, producing corresponding physiological responses that place the body in a favorable state for resisting and preventing disease.
The difference lies in the source of the feedback information. Qigong mainly operates through active control and can selectively use certain internal states of the organism, sensed through interoceptors, as feedback signals, thereby improving control. The range of choice is considerable. Biofeedback equipment, by contrast, provides signals for a limited number of physiological states, with feedback information obtained through exteroceptors such as the eyes and ears.
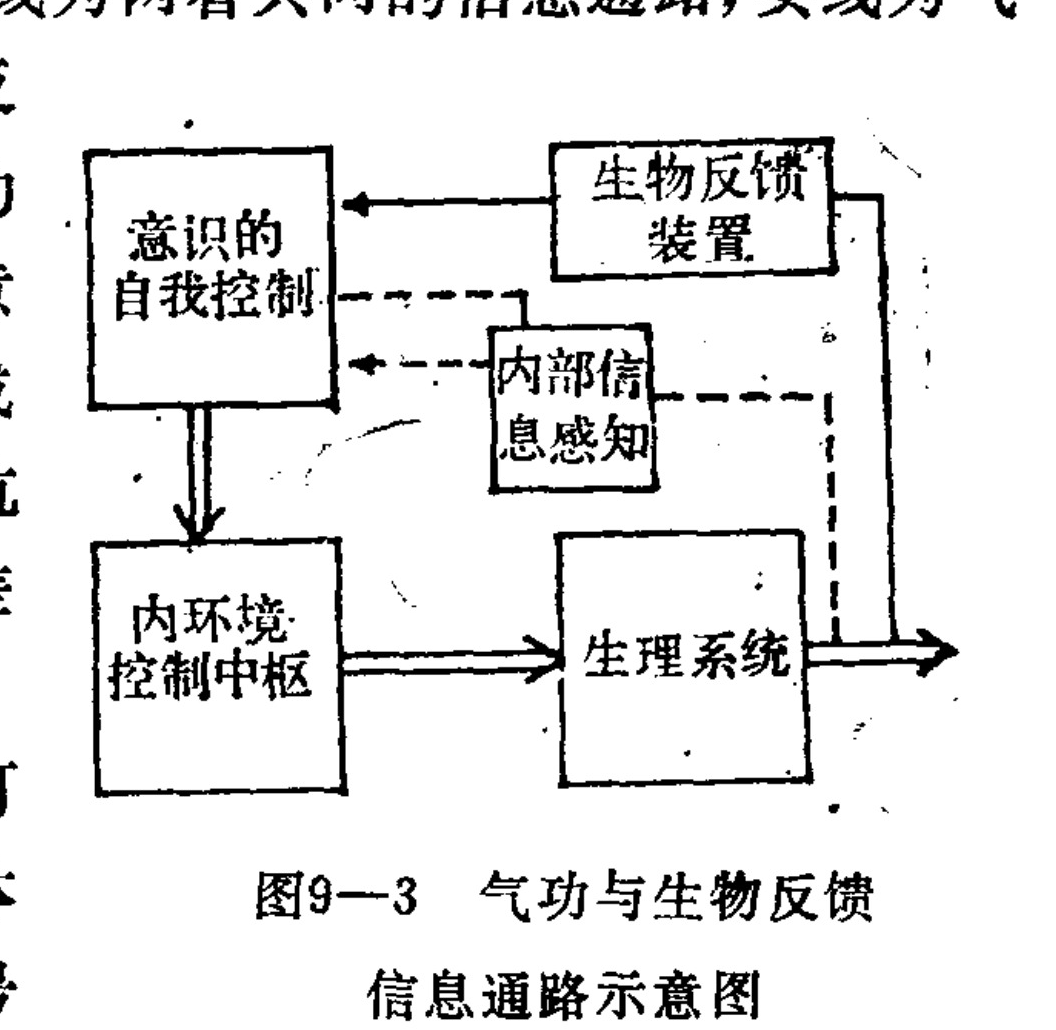
Figure 9–3. Schematic diagram of the information pathways of qigong and biofeedback
Translated labels: Conscious Self-Control; Biofeedback Device; Internal Information Sensing; Internal Environment Control Center; Physiological System
Conscious self-control
Biofeedback device
Internal information perception
Internal environment control center
Physiological systems
The differences between the two are analyzed further below. Biofeedback requires special biofeedback equipment to obtain information about the organism’s physiological state and to feed that information into consciousness through sensory pathways used in everyday life. As discussed in Chapter 2, the rate at which information can be processed in human consciousness is limited, at approximately 10² bits per second. Therefore, it can usually focus only on a limited number of the organism’s states. This selectivity brings both advantages and disadvantages. The advantage is that the objective is relatively clear and targeted, and it adopts sensory pathways commonly used in everyday life.
The input from the exteroceptors has high resolution, making it easy to concentrate the mind and reach the predetermined goal. Moreover, the gain of the feedback device can be adjusted. At the beginning, high sensitivity can be used so that the subject can easily perceive slight changes within the body and recognize the results of training, thereby building confidence. The sensitivity of the device can then be gradually reduced, guiding the subject to acquire an ever-greater ability to control the relevant physiological state. In addition, because the instrument provides an indication, the subject depends less on the instructor and can more easily reach the predetermined goal through personal exploration, thereby mastering the process and reaching the therapeutic objective more quickly. Its disadvantage is that different physiological parameters require different specialized devices, and the diseases it can treat are often limited to those associated with the finite parameters that can be measured.
The advantage of qigong is that it can regulate the body’s condition more comprehensively, and therefore has a broad range of indications. However, qigong depends on subjective effort to perceive changes within the body; these interoceptors are generally not very sensitive, and their sensations are relatively vague. A relatively long period of exploration and training is needed to master them. Moreover, the range of what qigong can control is very broad and the possibilities are numerous, so searching and testing over a wide range is required. Consequently, experience is especially important, and the master’s transmission of experience and guidance plays an important role. Relying on the subject’s own exploration makes deviations relatively easy. The functions of qigong practice are not limited to treating illness; it is also effective in disease prevention, strengthening the body, and promoting longevity—results that biofeedback currently cannot easily achieve.
In general, qigong and biofeedback differ, but they are not mutually exclusive; instead, each can make up for the other’s limitations. Qigong practice may, with the help of biofeedback equipment, achieve its own goals more quickly and effectively. Biofeedback, for its part, can absorb the experience of qigong practice, producing better results and expanding its range of applications. Because qigong and biofeedback developed against different backgrounds and have different histories, their practical experience also differs; bringing the two together will therefore require some effort. Nevertheless, it can be believed that an organic combination of the two will achieve better results than either method alone.
Chapter Ten: Cybernetics Is an Important Method for Studying Qigong
In the preceding chapters, we discussed the principles of biocybernetics, the regulatory control of the human physiological systems, and the effects of qigong on the various physiological systems. The corresponding chapters also touched on some hypotheses concerning the mechanisms of qigong’s effects, but these hypotheses were generally limited to explaining certain local manifestations of qigong. Qigong is an extraordinarily complex regulatory and control process within the human body, and at present it is difficult for us to give a relatively comprehensive account of this process with a sufficient scientific basis. As people’s understanding of the body’s regulatory and control processes deepens and the practice of qigong develops, a scientific theory of qigong will gradually take shape. In this chapter, we apply the principles and viewpoints of cybernetics to examine the mechanisms of qigong in a relatively comprehensive way, attempting to explain the important role of cybernetics in exploring those mechanisms.
I. Qigong Phenomena Take Many Forms
As we pointed out earlier, qigong is a specific state of the human body. The concept of “qi” has an extensive range of meanings in the classical qigong texts. In our view, qi mainly refers to manifestations of the organism’s functional and mental states, while qigong is a specific functional state beneficial to the organism’s survival, acquired through training and sustained effort. The practice of qigong shows that there are many different qigong states. In terms of the goals qigong seeks to achieve, there is ordinary qigong, primarily intended to prevent and treat disease, as well as martial-arts qigong, hard qigong, and special abilities. Ordinary qigong itself has many different schools and methods; different methods may produce different functional states in the human body. Even the same method can produce very different functional states when practiced to different levels of proficiency. Thus, different methods all have a certain efficacy in preventing and treating disease, but their degree of efficacy and the types of diseases to which they apply may differ.
Therefore, when studying the mechanisms of qigong, it is necessary not only to clarify the general principles by which qigong states are formed, but also to give a reasonable account of the different qigong states. This increases the difficulty of qigong research.
Qigong practitioners use the concept of “qi” to explain the effects of qigong and the process by which qigong states are formed. It seems as though a kind of substance (qi) continually circulates within the body; if this circulation is obstructed, the body becomes ill. The result of qigong training is that “qi” runs smoothly through the body, thereby achieving the purpose of treating illness. From the viewpoint of cybernetics, this account has a certain rationale, but it is too simple: it can be regarded only as a preliminary external-appearance model of qigong phenomena. It is difficult to develop the discussion further on this basis. Moreover, the account in terms of “qi” is hard to reconcile with modern physiological, biochemical, and anatomical knowledge. However, the science of the human body should—and can—bring these accounts into a unified framework. At present, various substances are continually transported throughout the body through the circulatory system; through the transmission of information in the nervous and endocrine systems, the regulation and control of the organism as a whole are achieved. No effect on the human body can be realized independently of the activity of these known physiological systems. The effects of “qi” cannot be an exception. We still do not know whether a substance like “qi” exists. Even if there were a substance as yet unknown to us that circulated throughout the body like “qi” and exerted an important regulatory effect on the organism, that substance would also have to act through the known physiological systems in order to perform its functions.
From the viewpoint of cybernetics, the “qi” of qigong described above need not be a substance circulating throughout the body. The effects of “qi” may very likely be produced by information that is continually transmitted and transformed within the organism. In other words, “qi” is the information within the human body and the process by which that information is transmitted. It is therefore evidently closely related to the known information-transmission and processing systems within the body—the nervous and endocrine systems. Of course, there may also be information-transmission and processing systems in the body that we have not yet recognized. If such a system exists, however, it should likewise be closely connected with the nervous and endocrine systems and be capable of interacting with them. Changes in the flow of information between the various parts of the organism can place the organism in different states. The many forms of the qigong state can be explained by differences in the organism’s information processes. Clearly, this is still only a general account and has not yet advanced our understanding very far. Nevertheless, following this line of thought can encourage us to investigate further the roles of the nervous system, the endocrine system, and other information-processing systems in qigong.
Only when we can specifically indicate the different qigong states and determine through what internal information exchanges within the organism the various phenomena that occur in qigong are realized can we say that we have given a scientific explanation of the mechanisms of qigong.
The principles by which different qigong states are formed have both commonalities and differences. Ordinary qigong for strengthening the body and treating illness has become a practical activity involving tens of millions of people in our country. Many people have mastered qigong techniques; most people can reach a certain qigong state through practice and obtain practical results. It therefore has broad applicability and practical value. Its mechanisms are relatively easy to connect with psychology, physiology, biochemistry, and other modern sciences. Most of its phenomena belong to special manifestations of the body’s normal functions, making them relatively easy to study and observe scientifically. It is estimated that breakthroughs may be achieved in the near future, and this should become the mainstream of current qigong research. The discussion of qigong in this book is directed mainly at this type of qigong.
Special abilities have attracted attention both domestically and internationally in recent years, and they have considerable potential for theoretical and practical development. At present, we still cannot clearly explain the principles of many ordinary functions that are commonplace in the human body. People with special abilities are still extremely few; many special-ability phenomena are strongly influenced by subjective and objective factors and have poor reproducibility. This makes experimental research into the principles of special abilities very difficult. Current experiments mainly observe the phenomena; clarifying their mechanisms will require a painstaking process. At first glance, these special abilities are difficult to explain using existing scientific theories. We should observe the phenomena carefully and systematically, accumulate data, and actively pursue theoretical exploration.
II. Qigong Is a Complex Regulatory and Control Process in the Human Body
The preceding section discussed how the qigong state results from the mutual interaction of information among the various parts of the human body. We know that the human body is an extremely complex automatic regulatory system. Under normal circumstances, the nervous system plays the leading role in the body’s regulatory and control processes. Through the sense organs and the various receptors within the body, the nervous system collects information about the internal and external environments and regulates and controls the organism as a whole, enabling it to maintain the conditions necessary for survival and adapt to changes in its environment. Qigong is a special state of the human body, and this state differs from the states in which the human body ordinarily exists.
There are differences. Nevertheless, it is still the result of the various parts of the organism interacting under the coordination and control of the nervous system. Therefore, qigong is a special regulatory-control process of the human body.
Centering on the regulation and control of the internal environment is one of the characteristics of the qigong regulatory-control process. When practicing qigong, it is generally required to be relaxed, quiet, and natural, and to eliminate distracting thoughts; one focuses the mind on a particular part of the body. These requirements can reduce the influence of the external environment on the organism, enabling the body’s regulatory-control center to break free from the pressure of the external environment and from the heavy tasks of information processing, thinking, decision-making, and so forth in daily life, and to shift attention to regulating the internal environment. Many human diseases are caused by disturbances of the internal environment. The human body normally has the ability to automatically adjust and stabilize its internal environment. However, because of disturbances caused by intense external stimuli, excessive fatigue of the organism, invasion by external pathogenic factors (such as bacteria and viruses), and other factors, if the regulatory-control center is unable to concentrate its efforts on regulating the internal environment because it is occupied with other work, an imbalance in the internal environment will result. The total working capacity of the human regulatory-control center is limited. After entering the qigong state, the organism’s regulatory-control center can concentrate on resolving problems of internal-environment regulation, increasing its ability to control the internal environment and making disturbances of the internal environment easier to correct. The qigong state shifts the organism toward regulation of the internal environment as its center, creating favorable conditions for preventing and treating disease.
The realization of qigong’s functions mainly depends on fully mobilizing the capacities of the various regulatory-control systems already present within the body. Strengthening the functions of the existing regulatory-control systems may overcome disturbances of the internal environment that have already appeared and achieve the goal of treating disease. As discussed in the preceding chapters, the human body possesses many automatic regulatory systems that stabilize the internal environment. Under ordinary circumstances, the normal operation of these systems ensures the relative stability of blood pressure, body temperature, respiratory ventilation volume, respiratory frequency, the concentrations of various hormones in the blood, the concentrations of various ions, and so on. The stability of these internal-environment parameters is a necessary condition for health. If the functions of these internal-environment regulatory systems are strengthened, they may resist external interference and maintain the health of the organism. In response to the invasion of pathogens, the body’s immune system can react to viruses, bacteria, and other pathogens; through humoral and cellular immunity, it can eliminate these pathogens and keep the organism healthy. When a person’s immune function is reduced, bacteria and viruses readily reproduce inside the body, and pathogens continually invade the body, rapidly reproduce within it, damage the body’s tissues, and cause disease. Therefore, immune function plays an extremely important role in the occurrence, development, and recovery from disease. A considerable body of experimental data demonstrates that qigong can enhance the function of the human immune system. Part of qigong’s disease-treatment function may be achieved by stimulating the latent capacities of the immune system.
3. The Nervous System Is the Key to Qigong’s Effects
The main functions of the nervous system are to process various kinds of information within the body and to regulate and control the organism. The nervous system is the center of the body’s regulation and control, and qigong, as a special regulatory-control process, is no exception. Therefore, the nervous system plays a key role in the formation of the qigong state.
In qigong practice, consciousness plays an important role in the key stages of regulating the breath, regulating the mind, and regulating the body. Qigong is a process by which people achieve self-regulation of the organism through the action of consciousness. As pointed out in the preceding section, qigong’s functions in preventing and treating disease are achieved to a large extent through self-regulation of the internal environment. That is, through the control of subjective consciousness, the potential of the internal-environment regulatory-control systems is mobilized, ensuring the stability and resistance to interference of the internal environment. It is generally acknowledged that the nervous system has an important influence on the internal environment. In particular, regions such as the limbic system, hypothalamus, and brainstem play important roles in regulating and controlling the internal environment. However, this influence normally does not enter consciousness: human consciousness cannot sense or control the process of regulating and controlling the internal environment. Therefore, traditional neurophysiology calls the part of the nervous system responsible for the internal environment the autonomic (vegetative?) nervous system and considers it not subject to conscious control. In reality, the nervous system is an integrated whole. Under ordinary circumstances, its parts are rationally divided and each performs its own function. Because changes in the internal environment are relatively predictable and slow, they do not need to pass through conscious activity, judgment, and decision-making before a response is made. However, the higher regions of the nervous system govern conscious activity, and according to the evolutionary development and organizational principles of the nervous system, higher regions normally regulate lower regions. Thus, a mechanism by which consciousness regulates the internal environment already exists in the neural structure, but under ordinary circumstances it is not manifested. This is because, under such circumstances, if consciousness were required to monitor and control the internal environment, the higher regions of the nervous system would be overburdened and would consequently find it difficult to deal with changes that might occur at any time in the external environment, as well as to carry out the various thinking activities necessary for human development. This division of labor also causes consciousness to lack precise and flexible control over the internal environment. Qigong training works precisely by learning and changing some of the connections within the nervous system, strengthening and enhancing consciousness’s ability to regulate and control the organism’s internal environment.
The control of the internal environment by consciousness (or by the higher activity of the nervous system) is generally macroscopic in nature. Under the active action of consciousness, the nervous system is placed in a quiet environment, allowing the higher nervous centers to escape the influence of external stimuli and eliminating adverse emotions such as anxiety and worry that are unfavorable to the internal environment, thereby creating working conditions favorable to the internal-environment regulatory-control system. Consciousness’s ability to control the internal environment can be continuously improved through training. A qigong master with deep skill can, through the action of consciousness, markedly alter certain internal-environment activities; for example, the heart rate and basal metabolic activity can be greatly reduced. With the development of neuroscience, it has gradually been revealed that consciousness has the ability to control the macroscopic state of the internal environment and, further, the ability to control local behavior within the internal environment. Excitation of the neural structure of the pleasure center can place an animal in a state of pleasure, and it may even stop eating and drinking. The excitation of these centers may be the mechanism underlying the realization of the saying, “When a person encounters a joyous event, the spirit feels refreshed.” In recent years, through operant conditioning of the viscera, animals have been made to learn to change their internal environmental responses. The development of biofeedback technology has demonstrated that, after training, human beings can alter the regulation and control of their internal environment and correct disturbances of that environment. Because the nervous system is plastic, its interconnections can change through use. This makes it possible to alter the nervous system’s capacity for response through training and to make consciousness’s control of the internal environment possible.
Psychological activity is an important function of the nervous system, and psychological activity is conscious. Qigong’s functions in preventing and treating disease also involve psychological processes. Psychological activity has an important influence on the occurrence and development of disease. With social development and advances in medical technology, the cure rate of diseases caused by biological pathogens has increased and the mortality rate has decreased. Meanwhile, diseases related to social stress and psychological processes—such as cardiovascular and cerebrovascular diseases, mental disorders, and psychosomatic diseases—have become major factors obstructing people’s health. Qigong therapy is highly effective for psychosomatic diseases, and especially effective for diseases of the nervous system. People who believe in qigong’s effects and have an urgent need for qigong often obtain relatively good results from practicing it. The qigong state can cultivate a person’s temperament and make the person calm and even-tempered, thereby making the internal environment less susceptible to interference from the outside. It has been observed experimentally that, while performing a stressful task, qigong practitioners and non-practitioners show no significant difference in respiration, pulse, or the increase in catecholamine secretion. However, after completing the stressful task, catecholamine levels recover more quickly in practitioners. Catecholamine levels reflect the organism’s state of stress, indicating that qigong may help restore the organism after a stress response. Other experiments have shown that qigong improves certain psychological functions. For example, it produces significant improvements in the forward and backward digit spans of the memory-learning system and in the color-naming speed of the thinking system. Qigong not only depends on psychological processes to achieve its effects; it may also improve the organism’s psychological qualities. These circumstances show that psychological processes are one component of qigong’s effects, and their role should not be neglected in qigong research.
The nervous system is the most recently formed and most complex and refined structure in the course of biological evolution. The human brain is the organ that emerged most recently and developed most rapidly during phylogenetic evolution; it possesses various complex and wondrous functions. At present, our understanding of the human brain remains very limited. However, the basic laws of the known brain structures and functions can provide a preliminary foundation for the principles of qigong and for explaining qigong phenomena. The plasticity of the nervous system means that the interconnections among many parts of the nervous system can change through use, learning, and so forth. The existence of conditioned reflexes indicates that the brain can establish temporary connections under certain conditions. These circumstances provide a possible basis for establishing, through qigong training, connections between consciousness and control of the internal environment and for eliminating the interference of external stimuli with the internal environment, thereby providing a possible basis for the principles by which qigong prevents and treats disease. An important mode of nervous-system operation is the existence of mutual inhibition among its parts. At any given time, only one part is in a state of excitation; an increase in the excitability of one part causes a decrease in the excitability of another: “One mind cannot serve two purposes.” The qigong state differs from the everyday state, and the state of the nervous system correspondingly differs as well. Regions that play a dominant role in the everyday state may become secondary in the qigong state. For example, the sensory organs and their associated neural structures play a major role in the normal state, but in the qigong state they occupy a secondary position, while interoceptors that sense the body’s interior and their associated neural structures rise to an important position. The sensations of warmth, crawling, and other unusual sensations that occur inside the body during qigong practice may be related to this. These sensations of the internal environment can also become more sensitive through practice and form conditioned reflexes.
The activity of the nervous system has the ability to regulate and control all parts of the organism. Therefore, when the nervous
When a certain region assumes a dominant role, the bodily tissues under its control also undergo changes. When neural structures related to the internal environment assume the primary role and perception of the internal environment is strengthened, control over the corresponding internal environment may also be strengthened. At present, we still know very little about which structures of the nervous system assume the dominant role during the qigong state, and how they differ from those in the ordinary state. Gaining a thorough understanding of the changes in the nervous system during the qigong state is a key issue in studying the principles of qigong.
Because the nervous system is a complex system, cybernetics is a useful tool for studying the brain. In studying information processing within the brain, cybernetics has applied methods such as systems analysis, neural networks, and brain models, and has contributed to revealing how information is processed in the brain. These methods were introduced in Chapter Two. They can also be applied to studying the role of the nervous system in qigong. Our understanding of the functions of the human brain is still very incomplete. Studying the principles of qigong and revealing qigong’s effects on the nervous system will also help people understand the human brain. Qigong activates neural functions that are ordinarily in an inhibited state. In-depth research on qigong may even reveal brain functions that people have not yet understood.
IV. Cybernetics Is a Useful Tool for Qigong Research
We have explained above that qigong is a regulatory and control process in the human body, and that this process is governed by the human brain. The human brain is the most complex system known to us so far, and at present there is no exceptionally effective method for studying a system as complex as the human brain. Cybernetics, however, is the science that studies the laws governing regulation, control, and information-processing processes in various systems. Cybernetics has been widely applied to problems in complex systems such as ecological, biological, economic, and social systems. In particular, applying cybernetics to problems in biomedical systems has produced the important branch known as biocybernetics. The experience gained from applying cybernetics to various complex systems, and the methods used in studying biomedical systems, can all be transferred and applied to qigong research.
The human body is an interconnected whole. Qigong does not merely cause changes in certain local functions of the organism; the qigong state involves changes in the organism as a whole. In applying cybernetic methods to qigong research, one must grasp the interconnections among the various parts and the relationship between the local and the whole in order to reveal the essence of the qigong process.
Some people have tried to explain the qigong process as a change from disorder to order in the system. This statement is too general and insufficient. Qigong does indeed cause some local parts of the organism to change from a relatively disordered state toward a relatively ordered one. However, the concept of order itself is relative and difficult to measure precisely. The living organism is itself a highly ordered structure, and all human activities depend on some kind of ordering. When people engage in thought, some parts of the nervous system may display greater order, while another part may become more disordered. It may be said that the various normal activity states of the human body correspond to different ordered activities; the qigong state is merely one kind of order replacing another. Ordering is not unique to the qigong state. If we can clarify what new conditions specifically arise in the interrelationships among the various parts of the human body during the qigong state, and under what conditions this ordering in qigong can form, then our understanding of qigong can be considered to have advanced.
We have observed many qigong phenomena. These phenomena are mainly manifested in behavior, while the internal regulatory and control processes governing behavior are too complex to study easily. Under these circumstances, black-box theory in cybernetics is especially useful for qigong research. Chapter One mentioned that black-box theory allows us, without yet knowing the specific internal structure, to establish quantitative relationships between an object and the things around it on the basis of its external manifestations. Such relationships can be represented by a model. A model established by the black-box method reflects only the external characteristics of the object and can be called a phenomenological model. Once a black-box model has been established, if the model is correct, it can summarize certain regular responses of the object, making it possible to conduct theoretical and experimental research on the model and predict the development of events. For example, suppose a model has established that the breathing, intention, and body-regulation activities of a particular qigong exercise cause the parameters of a certain bodily system to change after a certain period, and that a particular disease causes this parameter to change in the opposite direction. It could then be predicted that this exercise might treat that disease.
A black-box model is only the first step in studying a problem. As biological research advances, more knowledge will be obtained about the laws governing regulatory and control processes within the human body. We can then gradually open the black box, take qigong research a step further, and obtain models of interrelationships at a deeper level. The methods used by cybernetics in studying biological systems will provide inspiration for qigong research, and some can be transferred directly to the study of qigong. For example, in Section Three of Chapter Five we introduced a cybernetic study of acupuncture’s influence on the blood-pressure regulation system. There, the black-box method was first used to obtain the dynamic response of the blood-pressure regulation system through animal experiments, thereby obtaining the conclusion that acupuncture can indeed improve the dynamic characteristics of the blood-pressure regulation system. If the effect of acupuncture in that example were replaced by the external qi of qigong, the same method could be used to study the effect of external qi on the cardiovascular system and determine whether qigong external qi treats cardiovascular disease by improving the performance of the blood-pressure regulation system.
The black-box model can further promote and inspire our development of deeper-level models. In the example above, we also used an open-loop frequency-response testing method to open the black box preliminarily. The results suggested that at least part of acupuncture’s effect on the blood-pressure regulation system was achieved by improving the characteristics of the carotid-sinus pressure-feedback loop. Following this approach, it is also possible to determine further through which links qigong affects the cardiovascular system.
Cybernetics’ study of the general laws of regulatory and control systems helps us understand phenomena in the qigong process. For example, qigong research has observed that some physiological indicators may change bidirectionally: qigong can make an excessively high indicator decrease, while making an excessively low indicator increase. Thus, qigong can lower the blood pressure of patients with hypertension, raise it in patients with hypotension, and have no effect on normal blood pressure. In other words, qigong acts to correct abnormal states. At first glance this may seem difficult to understand, but in fact all automatic regulation systems have this function: improving the function of a regulatory system always causes the controlled variable to tend toward a predetermined target.
Models of qigong’s effects can be established by drawing on the achievements of biocybernetic research. Cybernetic research on biomedical systems has produced many results and established numerous regulatory and control models for biological systems. The earlier chapters of this book introduced a certain number of mathematical models of biological-system regulation. All of these models may be used to study qigong’s effects on such systems. We believe that qigong mainly relies on fully mobilizing the potential of the regulatory and control functions originally present in biological systems themselves. Cybernetic research shows that the performance and regulatory and control capacity of a control system are closely related to its parameters. In systems with the same structure, differences in their parameters can produce very different regulatory effects. Changes in the parameters of human-body systems may reflect a change from a physiological state to a pathological state, or a change from a pathological state to a physiological state. Therefore, qigong’s influence on a particular physiological process can be studied on the basis of a model of that physiological system.
Qigong’s effect may merely change the parameters of the existing system. When the organism changes from its ordinary state to the qigong state, it may simply be that the parameters of the various systems change. Therefore, if we determine what changes qigong causes in the parameters of each physiological system, we may be able to explain through which links qigong performs its functions. By analyzing the factors that cause changes in the parameters of biological regulatory and control systems, it may be possible to determine further the pathways through which qigong exerts its effects. For example, if qigong increases certain parameter values in a system, and if that parameter can be increased by excitation of certain regions of the nervous system, then it may be inferred that qigong’s effect is achieved by increasing excitation in that neural structure.
As for the values of the parameters of the various physiological systems, the systems-identification methods introduced in Chapter Two of this book can be applied. Using existing physiological-system models, the values can be calculated from experimental data measured in the organism before and after qigong. Qigong’s effects are related to psychological processes, but some effects are not directly related to psychological processes. Therefore, through experiments applying qigong’s effects to animal systems, if the experimental results confirm that qigong has caused changes in the parameters of certain animal systems, this can rule out the claim that qigong’s effects are merely psychological factors. Direct observation of the human nervous system is very difficult. When it is known that qigong has caused changes in the parameters of physiological systems, animal experiments can be used to seek the relationships between these parameters and the central nervous system, and thereby infer the changes qigong causes in the nervous system. This is also a feasible method.
Many of the cybernetic methods discussed in this book may be applied to qigong research. For example, once a model of qigong’s effects has been established, systems simulation can be applied: a computer can simulate the qigong process, forecast qigong’s effects on system parameters, and predict the effects of various factors on the qigong process. Since parameters can easily be changed in an electronic computer, simulation experiments can be repeated under various conditions, making computation an important tool for studying qigong.
Qigong is an extremely complex process within the human body, and cybernetics is a powerful tool for studying this process. Cybernetics is an interdisciplinary field, and its success requires collaboration among multiple disciplines. Cybernetic research on qigong is no exception. Only through close integration and concerted cooperation with qigong practitioners and other biological disciplines can cybernetic research on qigong achieve important results.
Main References
-
Qian Xuesen. “Establishing Phenomenological Qigong Studies—A Current Task in Scientific Qigong Research.” Nature Magazine 1986; 9(5): 323.
-
Editorial Committee of the Fundamentals of Chinese Qigong, eds. Modern Scientific Research on Chinese Qigong (vol. 1). Beijing: Chinese Qigong Training Academy, 1985.
-
Tao Bingfu et al. Collection of Qigong Therapies (vol. 3). Beijing: People’s Medical Publishing House, 1984.
-
N. Wiener, author (Chinese translation). Cybernetics. Beijing: Science Press, 1962.
-
Tu Xuyan et al., eds. Biocybernetics. Beijing: Science Press, 1980.
-
Huang Bingwan, ed. Biocybernetics in Medicine. Beijing: People’s Medical Publishing House, 1987.
-
A. P. Luria, author (Chinese translation). Principles of Neuropsychology. Beijing: Science Press, 1983.
-
Kuang Peizi, ed. Physiological Psychology. Beijing: Science Press, 1987.
-
Huang Bingwan. “Some Characteristics of Information Processing in the Brain.” Progress in Biochemistry and Biophysics 1984; (4): 14.
-
Huang Bingwan. “Associative Memory and the Brain Model.” Reference Materials for Biological Sciences, collection 25, 1988: 145.
-
Shanghai First Medical College, ed. Human Physiology. Beijing: People’s Medical Publishing House, 1978.
-
Chen Ren, comp. Fundamentals of Immunology. Beijing: People’s Medical Publishing House, 1984.
-
Zhang Zuosheng et al. Biofeedback—Theory, Systems, Developments, and Applications. Reference Materials for Biological Sciences, collection 25, 1988: 79.
-
Zhang Sufan et al., trans. and eds. Biofeedback. Beijing: Beijing Science and Technology Press, 1987.
-
Wang Jisheng et al. “Some Psychological Studies of Qigong.” Materials of the First Chinese Qigong Science Theory Training Seminar (13), 1984.
-
Mei Lei et al. “A Study of Brain Waves in the Functional State of Qigong.” Nature Magazine 1981; 4(9): 662.
-
Xu Hefen et al. “A Preliminary Study of Qigong and Immunity.” Proceedings of the First National Academic Exchange Conference on Scientific Qigong Research, Xingcheng, 1987.
-
Luo Hesen et al. “Experimental Observation of Changes in Salivary IgA and Lysozyme Content under the Qigong State.” Nature Magazine 1984; 7(2): 107.
-
Li Caixi et al. “The Effect of Practicing Qigong on the Levels of Three Hormones in Human Blood Plasma.” Nature Magazine 1983; 6(12): 910.
-
Wang Yuqin et al. “The Effect of Qigong ‘External Qi’ on Hypertension and an Exploration of Its Mechanism.” Nature Magazine 1983; 6(1): 7.
-
Du Luoyi et al. “A Preliminary Observation of 13 Cases of Diabetes Treated with Qigong.” Proceedings of the Beijing Regional Medical Qigong Scientific Research Reporting and Exchange Conference, 1986.